Coeur Mining: revenue up 77% but profit halved – metal prices and one-off charges absorbed the effect of new Canadian assets
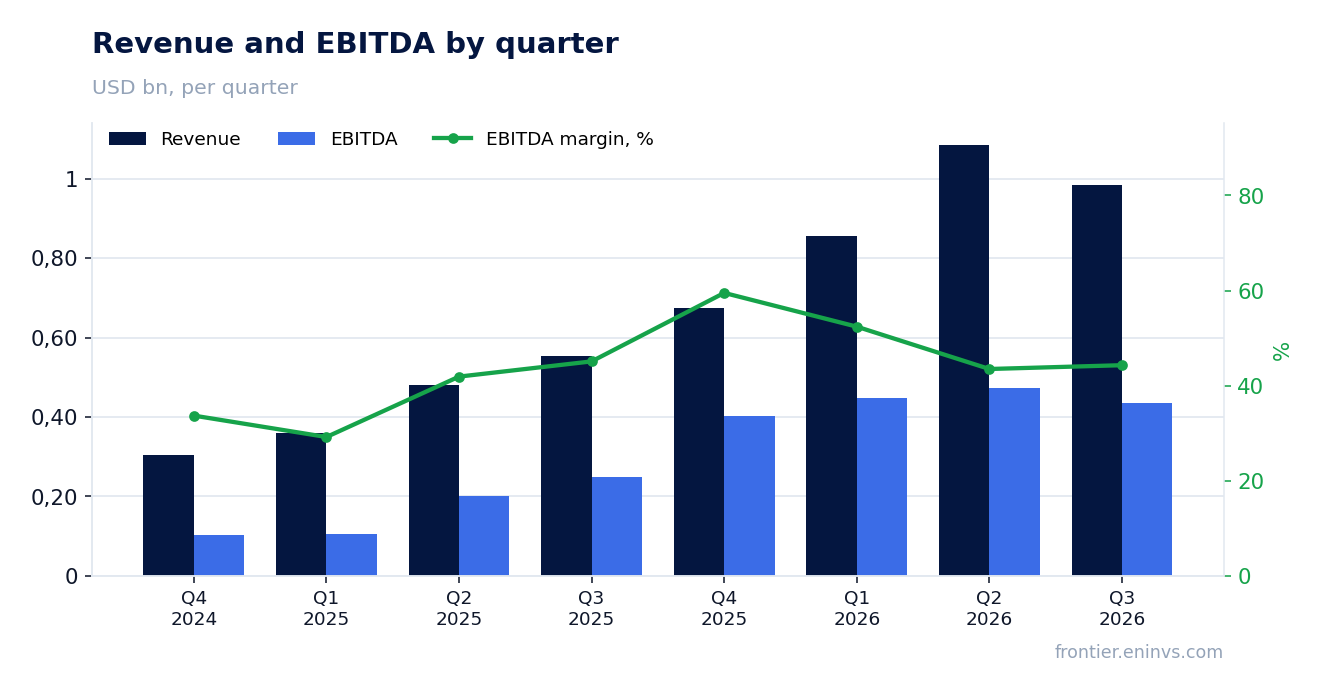
On November 4, Coeur Mining reported third-quarter 2026 results. Revenue came in at $983.6 million (+77.4% year over year), EBITDA at $435.6 million (+74.2%), and net income at $109.4 million (-59.0%). The company returned nearly half of quarterly free cash flow to shareholders through buybacks and declared a second dividend of $0.02 per share. At an EV/EBITDA of 7.9 versus its own three-year average of 23.7, the stock looks cheaper than its history, but the portal model implies -11% upside to fair value, so the verdict is neutral.
Key takeaways
— Revenue rose 77.4% to $983.6 million, but that is slower than the 125.9% growth in the second quarter
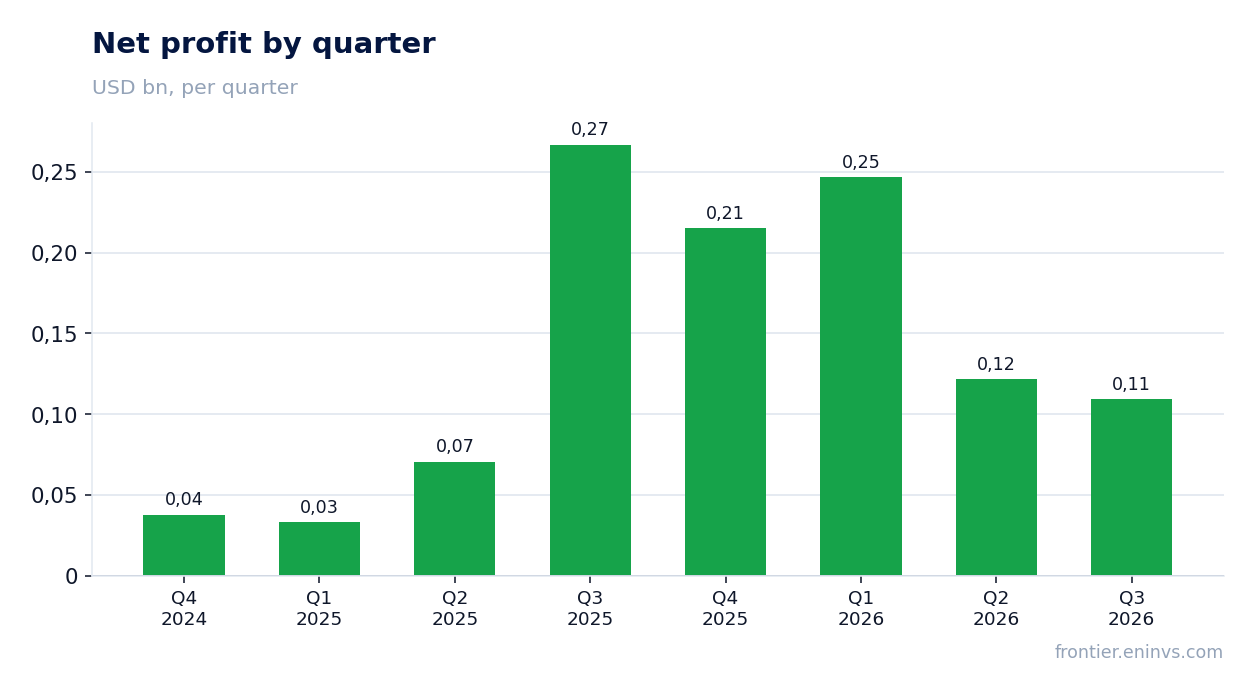
— Lower gold and silver prices and one-off Rainy River inventory charges cut net income by 59.0%
— Free cash flow of $240.2 million allowed returning $111 million to shareholders via buybacks and declaring a dividend
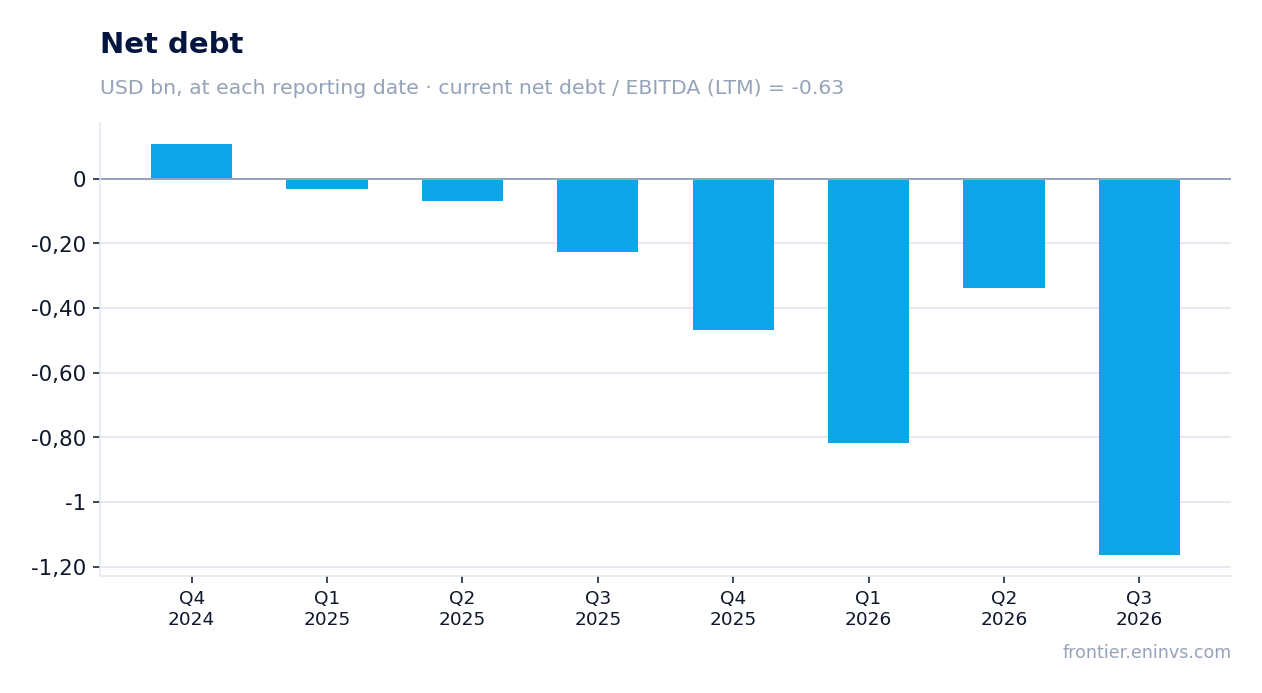
— Net debt is negative at -$1.2 billion as of September 30, 2026, providing a cushion
— EV/EBITDA of 7.9 is below its own three-year average of 23.7, but the portal model shows -11% to fair value
— Dividend yield of 0.14% is not comparable to the key rate, and the payout depends on metal prices
Attractiveness
Key figures, USD bn
| Metric | Q3 2025 | Q3 2026 | Change |
|---|---|---|---|
| Revenue | 0.55 | 0.98 | +77.4% |
| EBITDA | 0.25 | 0.44 | +74.2% |
| Operating profit | 0.18 | 0.17 | -1.5% |
| Net profit | 0.27 | 0.11 | -59.0% |
| Operating cash flow | 0.24 | 0.39 | +62.2% |
| Capex | 0.05 | 0.15 | +196.5% |
| EBITDA margin | 45.1% | 44.3% | -0.8 pp |
| Net margin | 48.1% | 11.1% | -37.0 pp |
Revenue rose 77.4% to $983.6 million, but that is slower than the 125.9% growth in the second quarter
Third-quarter 2026 revenue came in at $983.6 million, up 77.4% year over year. The growth was driven mainly by the inclusion of the Canadian assets New Afton and Rainy River, acquired in late 2025, as well as higher metal prices compared to the third quarter of 2025. However, compared to the second quarter of 2026, when revenue grew 125.9%, the pace decelerated.
The deceleration reflects lower average realized prices: gold sold at $3,979 per ounce versus $4,140 in the second quarter, silver at $62.22 versus $71.18. In addition, metal sales declined at several assets, including New Afton, Rainy River and Palmarejo, due to operational disruptions – a conveyor failure, heavy rains and planned maintenance.
Gold accounted for 66% of revenue, silver for 27% and copper for 6%. U.S. operations contributed 34% of revenue, Canadian operations 36% and Mexican operations 30%. Geographic diversification supports revenue, but lower precious metal prices remain the key driver of dynamics.
Lower gold and silver prices and one-off Rainy River inventory charges cut net income by 59.0%
Third-quarter 2026 net income was $109.4 million, down 59.0% from the third quarter of 2025. At that time, profit was inflated by a one-off factor – likely an asset sale or tax effect, as Q3 2025 net income of $266.8 million significantly exceeded operating profit. There was no such one-off gain in the current quarter.
In addition, profit was affected by $40 million ($0.03 per share) of non-cash expenses related to purchase price allocation for Rainy River inventory. These charges reduced adjusted EBITDA to $448.0 million and adjusted net income to $97.8 million. Lower average realized gold and silver prices also compressed the margin.
The EBITDA margin was 44.3% versus 45.1% a year earlier. The net margin fell to 11.1% from 48.1%, reflecting both the absence of the one-off gain and higher depreciation and taxes. Operating profit declined to $174.5 million from $177.1 million a year earlier.
Free cash flow of $240.2 million allowed returning $111 million to shareholders via buybacks and declaring a dividend
Third-quarter operating cash flow was $385.6 million, capital expenditures $145.4 million, and free cash flow $240.2 million. The company allocated $111 million to share repurchases under its $750 million program, representing about 46% of quarterly free cash flow. Since the program began in mid-May, $231 million of stock has been repurchased.
The board declared a second dividend of $0.02 per share, payable on December 16, 2026 to shareholders of record on November 30, 2026. The trailing 12-month dividend yield is only 0.14%, which is not comparable to the key rate. The payout depends on metal prices and operating results.
Capital expenditures rose to $145.4 million from $49.0 million a year earlier, driven by the development of new assets and sustaining production. The company expects full-year free cash flow to exceed $1.3 billion at current prices, which should support further capital returns to shareholders.
Net debt is negative at -$1.2 billion as of September 30, 2026, providing a cushion
Net debt as of September 30, 2026 was -$1,164.6 million, meaning the company has a net cash position. Compared to June 30, 2026, net debt decreased from -$0.3 billion to -$1.2 billion (a change of -$0.8 billion), and compared to September 30, 2025, from -$0.2 billion to -$1.2 billion (a change of -$0.9 billion). The increase in cash was driven by strong free cash flow.
The net debt to EBITDA ratio for the trailing 12 months is -0.63. A negative value means cash exceeds debt. This gives the company financial flexibility for investments and capital returns. Interest expenses are not disclosed, but with such a position they are not a significant burden.
Total debt at quarter-end was $701.7 million, while cash and equivalents were $1,172.7 million. Liquidity allows financing project development and sustaining dividend payments even if metal prices decline.
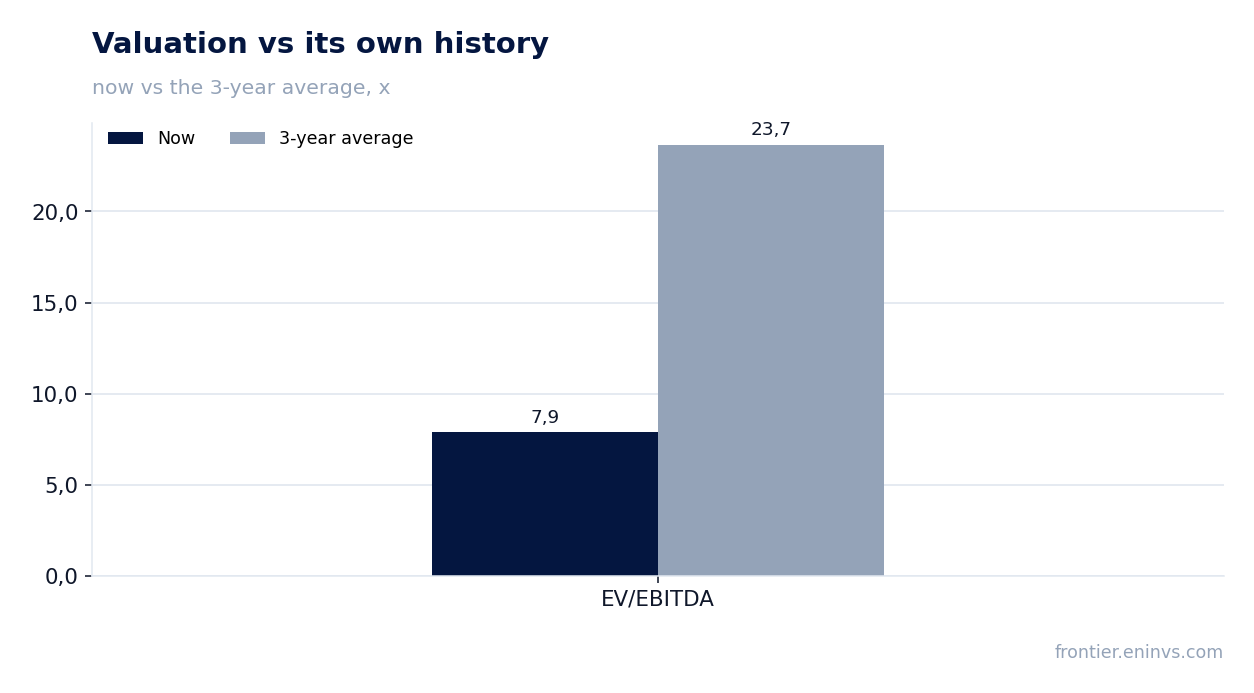
EV/EBITDA of 7.9 is below its own three-year average of 23.7, but the portal model shows -11% to fair value
The trailing 12-month EV/EBITDA multiple is 7.9, which is 67% below its own three-year average of 23.7. This indicates the stock trades cheaper than its historical valuation. However, the portal model, which reprices EBITDA at current commodity prices at the target EV/EBITDA, implies -11% upside to fair value.
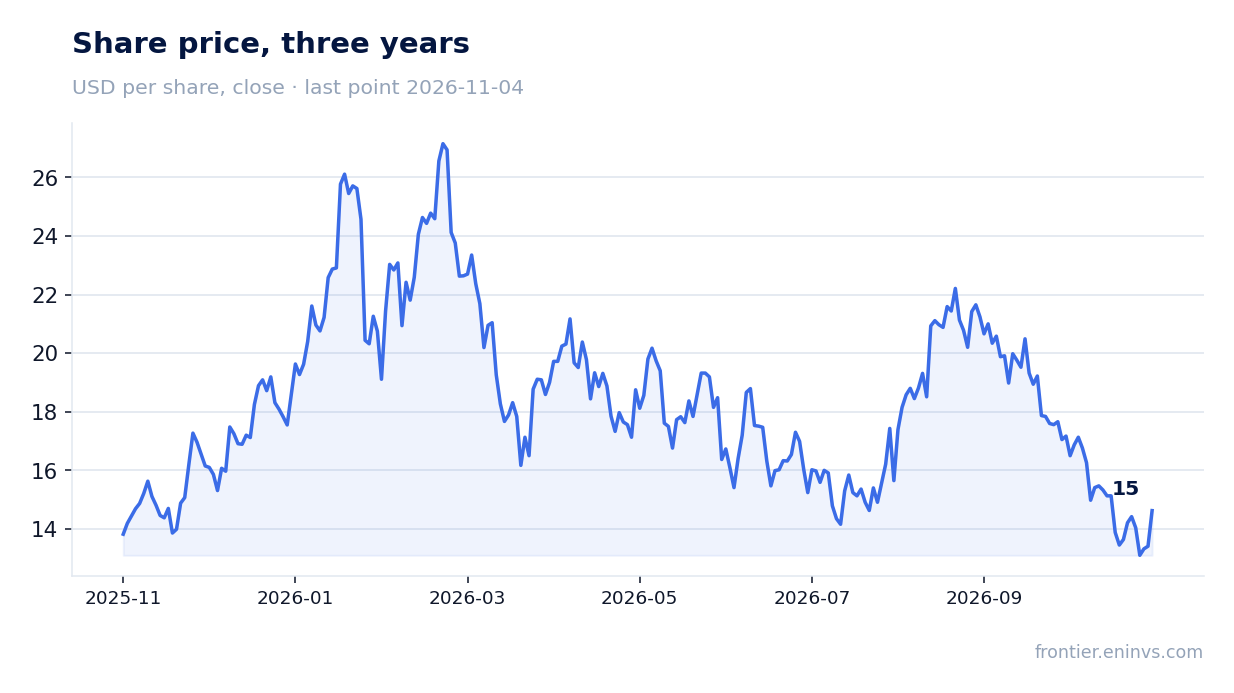
The trailing 12-month P/E is 21.7. Return on equity (ROE) is 4.2%, which is low for a mining company. Market capitalization is $15.0 billion. At the same time, net debt is negative, which supports the valuation.
The multiple's decline relative to history may be explained both by the general decline in gold and silver prices and by the increase in EBITDA over the last 12 months to $1,846.7 million. The market is likely pricing in metal price cyclicality. For an investor, this means the stock is conservatively valued, but upside is limited.
Dividend yield of 0.14% is not comparable to the key rate, and the payout depends on metal prices
The trailing 12-month dividend yield is 0.14%. The company declared a second dividend of $0.02 per share, which at the current price gives a negligible yield. For comparison, the key rate in Russia is significantly higher, making the dividend unattractive for income-oriented investors.
Dividend payments depend on metal prices and operating results. If gold and silver prices decline, the company may cut payouts. In addition, the priority is share repurchases, with $111 million allocated in the quarter, significantly exceeding dividend payments.
The dividend policy is not disclosed, but the current payout level appears symbolic. The main capital return comes through buybacks. For an investor, the dividend is not a significant factor in the investment decision.
Valuation on the latest reported figures
| Metric | Value |
|---|---|
| Market cap | 15.0 bn USD |
| P/E (LTM) | 21.7 |
| EV/EBITDA (LTM) | 7.9 |
| P/B | 4.54 |
| Net debt / EBITDA (LTM) | -0.63 |
| Operating cash flow (LTM) | 1.61 bn |
| ROE | 4.2% |
| Dividend yield (12m) | 0.1% |
| EV/EBITDA, 3-year average | 23.7 |
Bottom line
The report's strength remains cash flow: free cash flow of $240.2 million allowed returning $111 million to shareholders via buybacks and maintaining negative net debt of $1.2 billion. However, net income fell 59.0% due to the absence of last year's one-off gain and lower metal prices. The EV/EBITDA multiple of 7.9 is below the historical average of 23.7, but the portal model sees no upside. The verdict is neutral: the stock is valued cheaper than its history, but the 0.14% dividend yield and dependence on metal prices limit its appeal.
Open the company's financial profile CDE →
See also: market overview · valuation map · stock screeners