CF Industries: revenue still grows double digits, but profit no longer keeps up
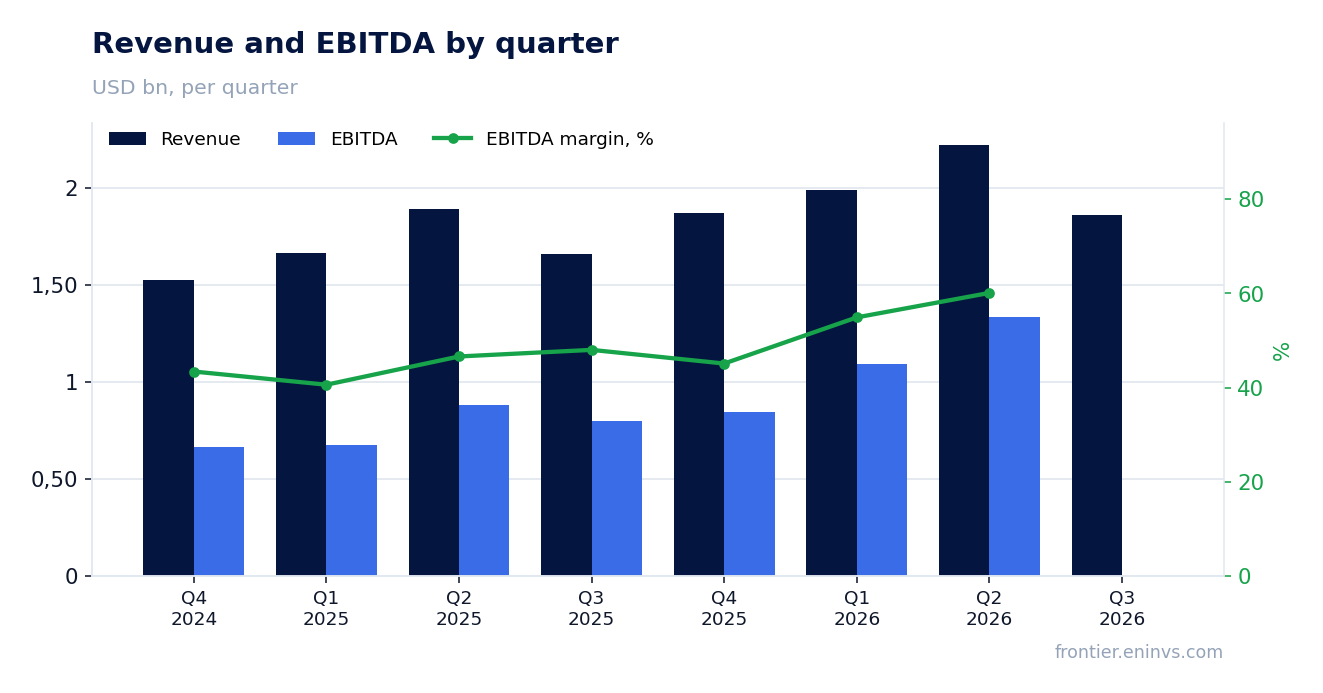
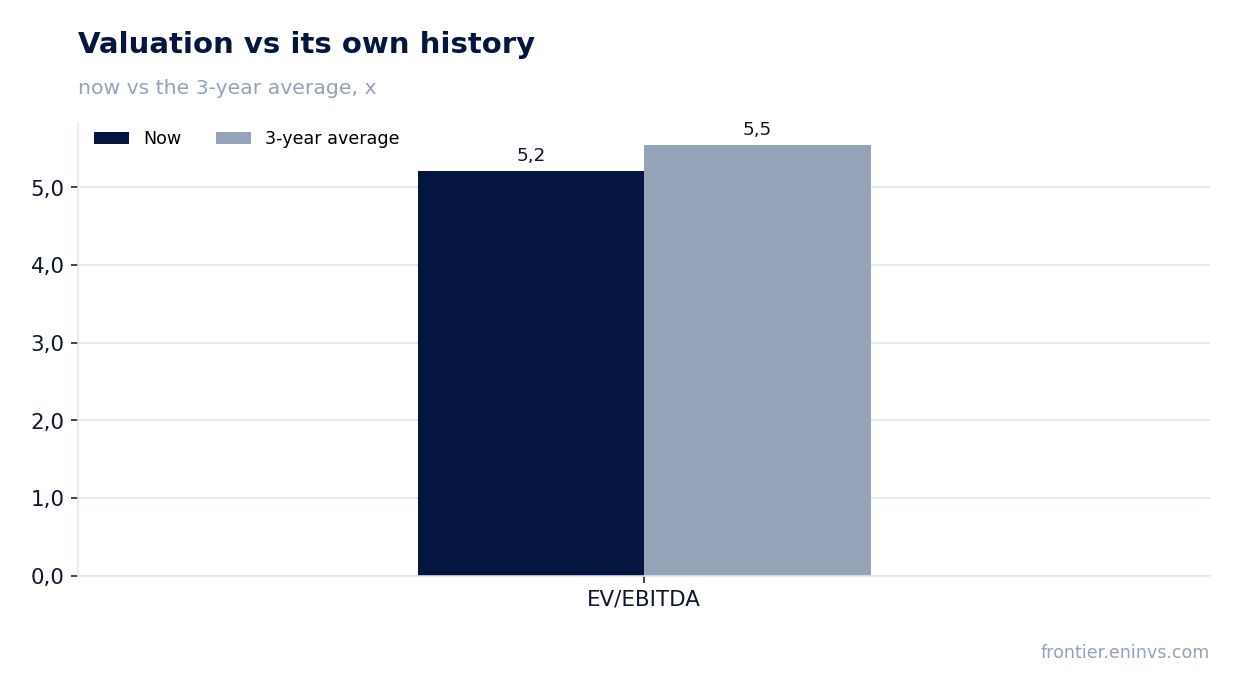
CF Industries reported third-quarter 2026 revenue growth of 12.1% year on year to USD 1,860.0 million, while net profit fell 5.2% to USD 436.0 million. The net margin compressed from 27.7% to 23.4%, and top-line growth decelerated from 17.6% in the second quarter. At an EV/EBITDA of 5.2 against its own three-year average of 5.5 and with the portal model pointing to 26% upside, the share looks attractive, but the weakening margin is the main argument against.
Key takeaways
— Revenue added 12.1% year on year, but that is slower than 17.6% in the second quarter
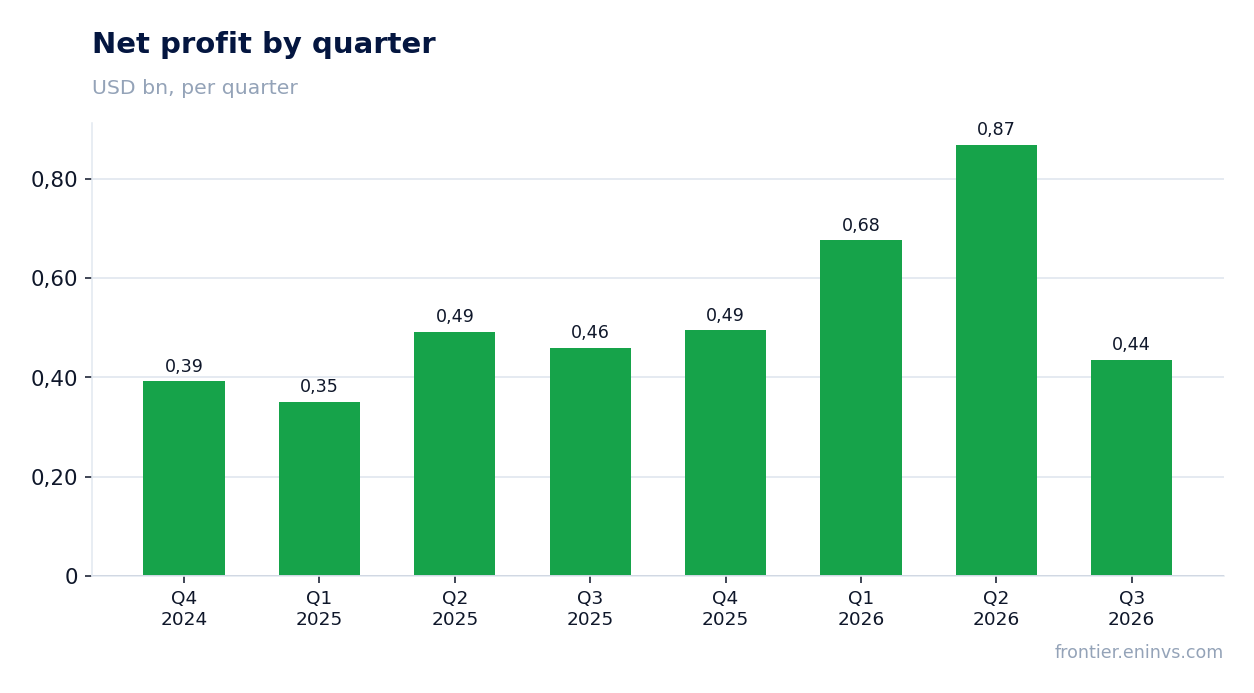
— Net profit fell 5.2%, and the margin compressed from 27.7% to 23.4%
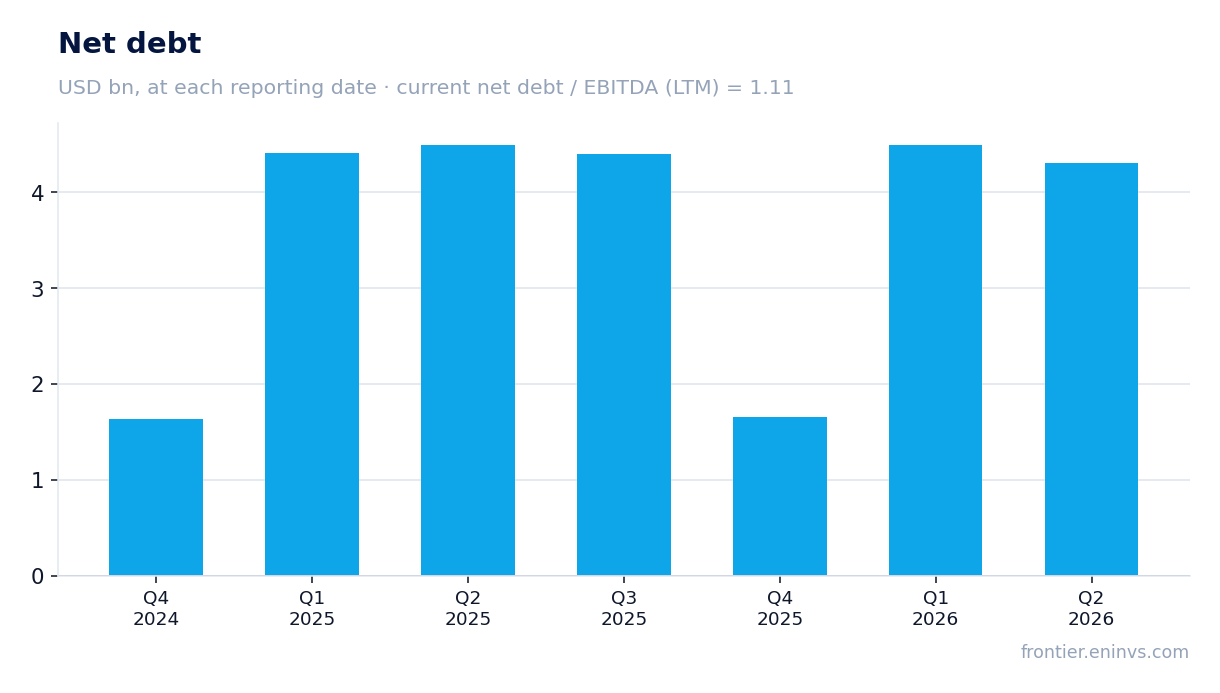
— Leverage at 1.11x LTM EBITDA remains moderate
— The EV/EBITDA multiple of 5.2 is below its own three-year average of 5.5
— A dividend yield of 1.9% is modest against an ROE of 62.7%
— The portal model implies 26% upside to the share's fair value
Attractiveness
Key figures, USD bn
| Metric | Q3 2025 | Q3 2026 | Change |
|---|---|---|---|
| Revenue | 1.66 | 1.86 | +12.1% |
| EBITDA | 0.80 | — | — |
| Operating profit | 0.58 | — | — |
| Net profit | 0.46 | 0.44 | -5.2% |
| Operating cash flow | 1.06 | — | — |
| Capex | 0.35 | — | — |
| EBITDA margin | 48.0% | — | — |
| Net margin | 27.7% | 23.4% | -4.3 pp |
Revenue added 12.1% year on year, but that is slower than 17.6% in the second quarter
In the third quarter of 2026, CF Industries' revenue came to USD 1,860.0 million, up 12.1% from a year earlier. Growth remains double-digit, but its pace is steadily slowing: it was 17.6% in the second quarter and 19.4% in the first. The deceleration reflects the high base of last year, when quarterly revenue was growing by more than 20%.
The quarterly pattern is uneven: after USD 2,222.0 million in the second quarter, revenue fell to USD 1,860.0 million. That is typical for the seasonal fertiliser business, where the spring quarter is stronger than the autumn one. Year on year the company is still growing, but no longer as fast as in the first half.
Net profit fell 5.2%, and the margin compressed from 27.7% to 23.4%
Net profit for the third quarter of 2026 was USD 436.0 million against USD 460.0 million a year earlier – a decline of 5.2%. With revenue up 12.1%, this means costs grew faster than income. The net margin fell from 27.7% to 23.4%.
The gap between revenue and profit shows operating leverage working in reverse: additional sales volumes did not bring proportional profit. The drivers of the cost movement are not disclosed in the facts, so we confine ourselves to the observation: the margin compressed by 4.3 percentage points, and that is the key change in the report.
For assessing sustainability, it matters that profit over the last twelve months was USD 2,476.0 million on revenue of USD 7,900.0 million – an LTM margin of about 31%. The quarterly compression has not yet reversed the annual picture, but if it continues, the annual margin will start to decline.
Leverage at 1.11x LTM EBITDA remains moderate
Net debt at the latest balance-sheet date was USD 4,591.0 million, equivalent to 1.11x EBITDA over the last twelve months. That is a moderate level for capital-intensive chemical production: the company services its debt without strain.
LTM EBITDA of USD 4,123.9 million on revenue of USD 7,900.0 million gives an EBITDA margin of about 52%. Such a cushion allows the company to absorb quarterly margin swings without threatening debt sustainability. The direction of change in the ratio is not disclosed in the facts, so we state the level only.
The EV/EBITDA multiple of 5.2 is below its own three-year average of 5.5
At an LTM EV/EBITDA multiple of 5.2, the company trades below its own three-year average of 5.5 – by 6%. This means the market values the business more cheaply than it did on average over the past three years. The LTM P/E stands at 6.8.
A market capitalisation of USD 16,895.4 million with net debt of USD 4,591.0 million gives an enterprise value of about USD 21.5 billion. An EV/EBITDA of 5.2 for a producer with an EBITDA margin of about 52% looks modest, but it reflects the cyclicality of the industry and concerns about the margin.
The portal model, which reprices EBITDA at current commodity prices at the target EV/EBITDA, implies 26% upside to the share's fair value. This is our own estimate, not a market consensus.
A dividend yield of 1.9% is modest against an ROE of 62.7%
The dividend yield over the last twelve months is 1.9% on the current price. With a return on equity of 62.7%, the company earns far more than it returns to shareholders through dividends. Most of the profit stays in the business or goes into buybacks.
A yield of 1.9% is below the key rate, which makes the share unattractive to investors focused on current income. However, with a P/E of 6.8 and a low EV/EBITDA multiple, the main return for the shareholder comes from share-price appreciation rather than dividends.
What could reduce the payout: further margin compression and lower profit. If the current LTM profit level of USD 2,476.0 million holds, the dividend base remains solid, but the quarterly trend – a 5.2% decline in profit – bears watching.
The portal model implies 26% upside to the share's fair value
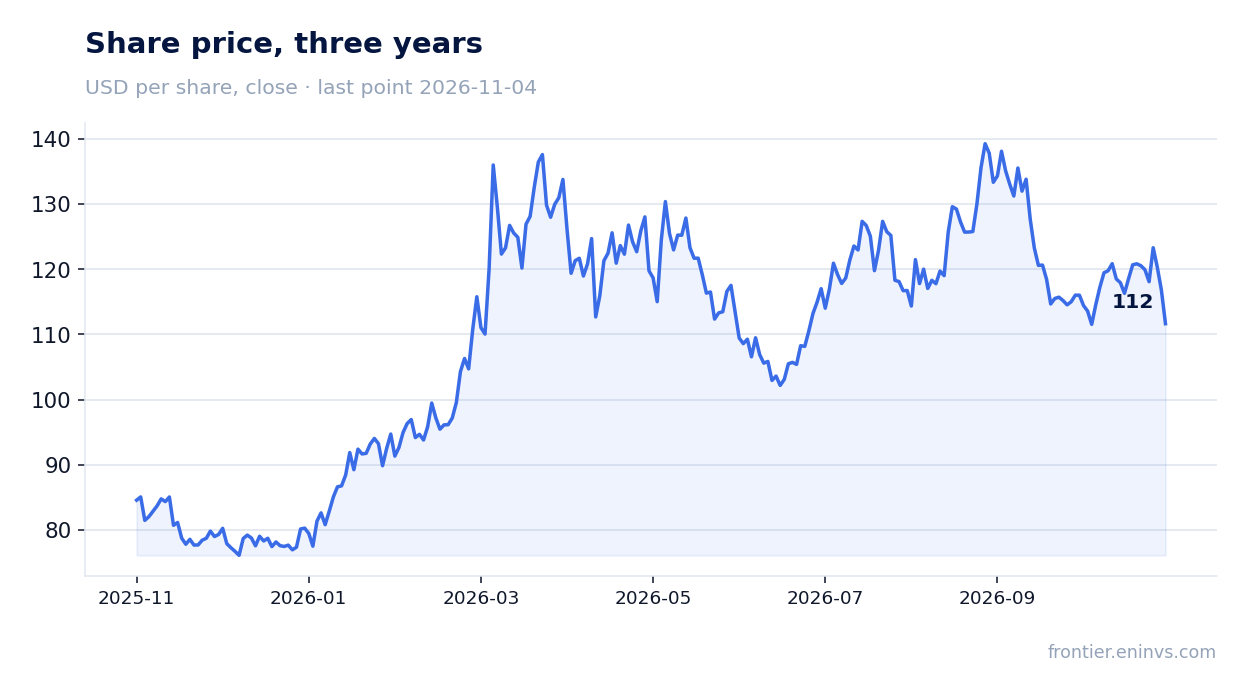
Our model reprices EBITDA at current commodity prices and values the business at the target EV/EBITDA. On that basis, the fair value of the share comes out 26% above the current market price. This is not a target price or a consensus, but our own estimate.
The 26% upside rests on two factors: a low current multiple relative to its own history and a high EBITDA margin. If the margin continues to compress, the model will need to be revised downward.
Judging by the below-historical multiple, the market is already pricing in the risk of lower profit. The question is whether the quarterly margin compression proves temporary or a sustained trend.
Valuation on the latest reported figures
| Metric | Value |
|---|---|
| Market cap | 16.9 bn USD |
| P/E (LTM) | 6.8 |
| EV/EBITDA (LTM) | 5.2 |
| P/B | 2.17 |
| Net debt / EBITDA (LTM) | 1.11 |
| ROE | 62.7% |
| Dividend yield (12m) | 1.9% |
| EV/EBITDA, 3-year average | 5.5 |
Bottom line
The report's strength remains double-digit revenue growth of 12.1% and moderate leverage at 1.11x LTM EBITDA. The weak spot is profit: it fell 5.2%, and the margin compressed from 27.7% to 23.4% – the second deceleration signal after revenue growth slowed from 17.6% to 12.1%. The EV/EBITDA multiple of 5.2 is below its own three-year average of 5.5, and the portal model implies 26% upside, which outweighs the margin-compression risk. The verdict is 'rather attractive': a valuation below its own history and a high EBITDA margin support the share, but an upgrade to 'attractive' requires seeing the margin turn in the next quarter.
Open the company's financial profile CF →
See also: market overview · valuation map · stock screeners