Cardinal Energy: oil price up 31.7% and revenue up 65%, but at last year's volumes the company earned less than the price implied
On 6 November Cardinal Energy released its third-quarter 2026 results. The average WTI price in the period was USD 85.4 versus USD 64.9 a year earlier (+31.7%), revenue rose 65.0% to USD 153.5m, net profit jumped 314.7% to USD 41.5m and operating cash flow reached USD 70.5m. At last year's volumes and costs, our calculation shows the same price would have produced revenue of USD 120.1m and EBITDA of USD 62.1m, so reported revenue came in USD 33.4m above the price-implied figure – the gap came from volumes and realisations, not from price. Leverage is minimal (net debt USD 6.6m, 0.03x LTM EBITDA) and the trailing dividend yield is 6.5%, but EV/EBITDA of 7.7 is 39% above its own three-year average of 5.6, so at the current price the share looks neutral.
Key takeaways
— Oil rose 31.7% year on year but fell 7.9% quarter on quarter – and that is already visible in revenue
— At last year's volumes our calculation shows the price implied USD 120.1m of revenue, while the company booked USD 153.5m – volumes and realisations made the difference
— Revenue grew 65.0% year on year, but the pace decelerated from 80.3% in the second quarter
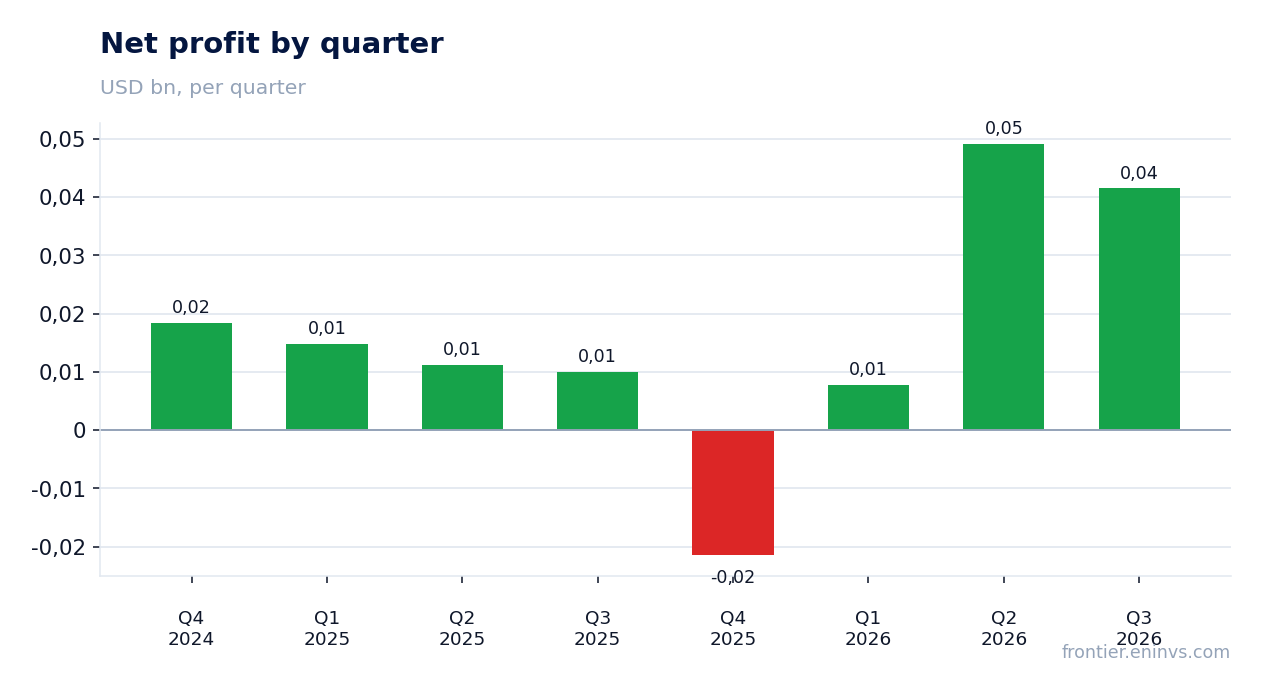
— Net margin rose to 27.1% from 10.8%, and the USD 41.5m quarterly profit is a price result, not a one-off
— Operating cash flow of USD 70.5m covers capex of USD 43.0m almost twice over
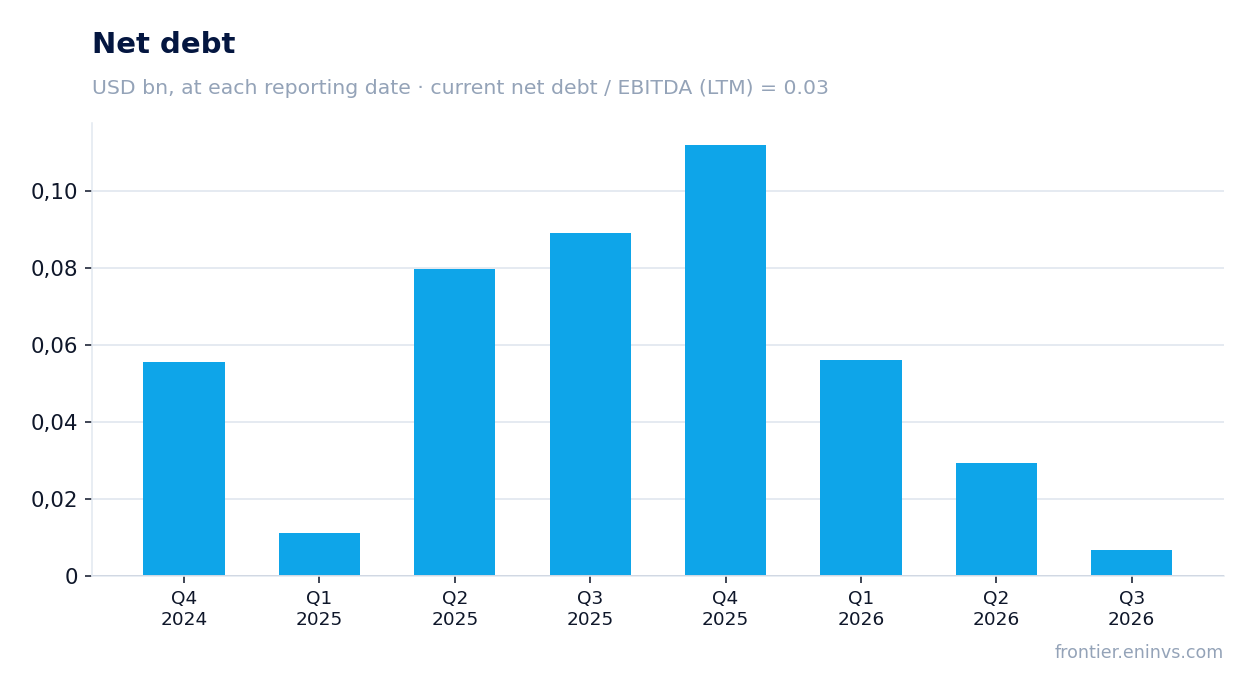
— Net debt fell from USD 0.1bn on 30 September 2025 to USD 0.0bn on 30 September 2026, with leverage at 0.03x LTM EBITDA
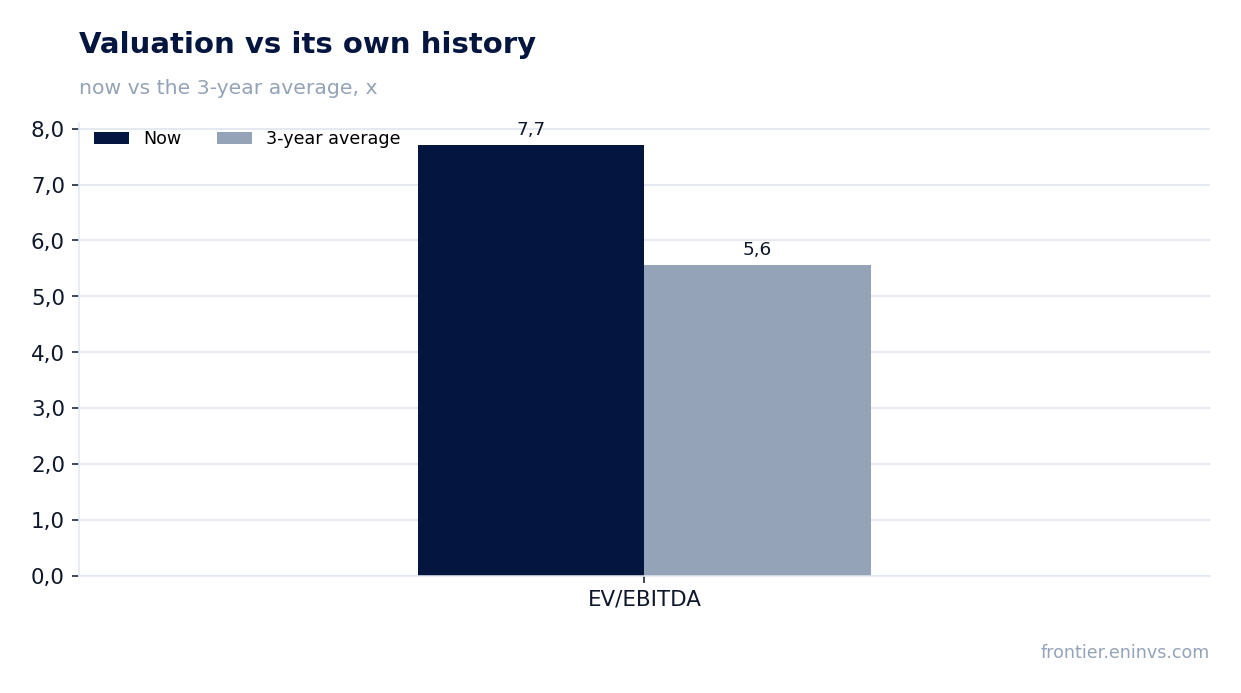
— A 6.5% dividend yield against EV/EBITDA of 7.7 versus its own 5.6 average – the yield is there, but investors pay a premium to history for it
Attractiveness
Key figures, USD bn
| Metric | Q3 2025 | Q3 2026 | Change |
|---|---|---|---|
| Revenue | 0.09 | 0.15 | +65.0% |
| EBITDA | 0.04 | — | — |
| Operating profit | 0.02 | — | — |
| Net profit | 0.01 | 0.04 | +314.7% |
| Operating cash flow | 0.04 | 0.07 | +75.0% |
| EBITDA margin | 37.6% | — | — |
| Net margin | 10.8% | 27.1% | +16.3 pp |
Oil rose 31.7% year on year but fell 7.9% quarter on quarter – and that is already visible in revenue
The average WTI price in the third quarter of 2026 was USD 85.4 versus USD 64.9 a year earlier – a 31.7% increase. This is the main external driver of the report: the company sells oil, and its revenue is first of all a function of price.
Quarter on quarter the price fell 7.9%, from USD 92.8 in the second quarter to USD 85.4 in the third. Spot is now USD 91.8 on 6 November, 7.5% above the reported-period average: if the price holds, the next quarter gets a higher base price.
Reported revenue of USD 153.5m reflects both the year-on-year rise and the quarter-on-quarter decline. Year on year growth is 65.0%, but it decelerated from 80.3% in the second quarter – precisely because of the price pullback from quarter to quarter.
Commodity prices: period average and now
| Benchmark | Year ago | Q3 2026 | YoY | Spot 2026-11-06 |
|---|---|---|---|---|
| WTI, USD | 64,9 | 85,4 | +31,7% | 91,8 |
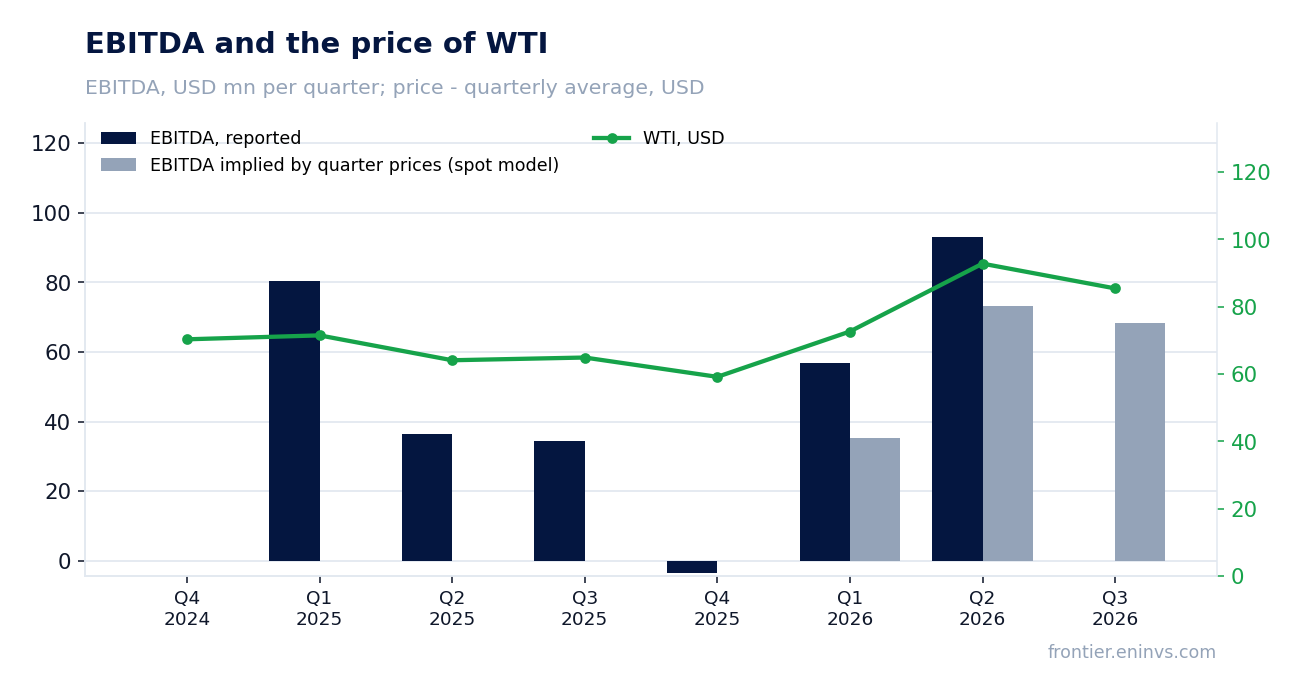
At last year's volumes our calculation shows the price implied USD 120.1m of revenue, while the company booked USD 153.5m – volumes and realisations made the difference
At the third quarter of 2025's volumes and non-commodity costs, with only the price moving, our calculation gives revenue of USD 120.1m (price effect +USD 27.1m, +29.1%) and EBITDA of USD 62.1m. Reported revenue of USD 153.5m is USD 33.4m (27.8%) above that benchmark.
The gap is explained by volumes and realisations: at the same price the company sold more oil or sold it at a higher realisation relative to WTI. The company did not disclose EBITDA for the reported quarter, so a direct comparison of reported EBITDA with the price-implied USD 62.1m is not possible.
Against the previous quarter the picture is reversed: at the second quarter's volumes and costs our calculation gives price-implied revenue of USD 155.4m (price effect -USD 12.2m, -7.3%), while reported revenue was USD 153.5m – USD 1.9m (1.2%) below. Quarter on quarter, volumes and realisations did not offset the cheaper oil.
The portal's spot model, re-priced to the reported period's prices, expected revenue of USD 139.1m; reported USD 153.5m is 10.4% above. On EBITDA the model expected USD 68.4m, but the company did not disclose reported EBITDA, so that comparison is incomplete.
What the prices implied and what the company earned
| Base (Q3 2025) | Implied at period prices | Reported | Reported vs implied | |
|---|---|---|---|---|
| Revenue, USD mn | 93,0 | 120,1 | 153,5 | +27,8% |
| EBITDA, USD mn | 35,0 | 62,1 | — | — |
| EBITDA, portal spot model, USD mn | — | 68,4 | — | — |
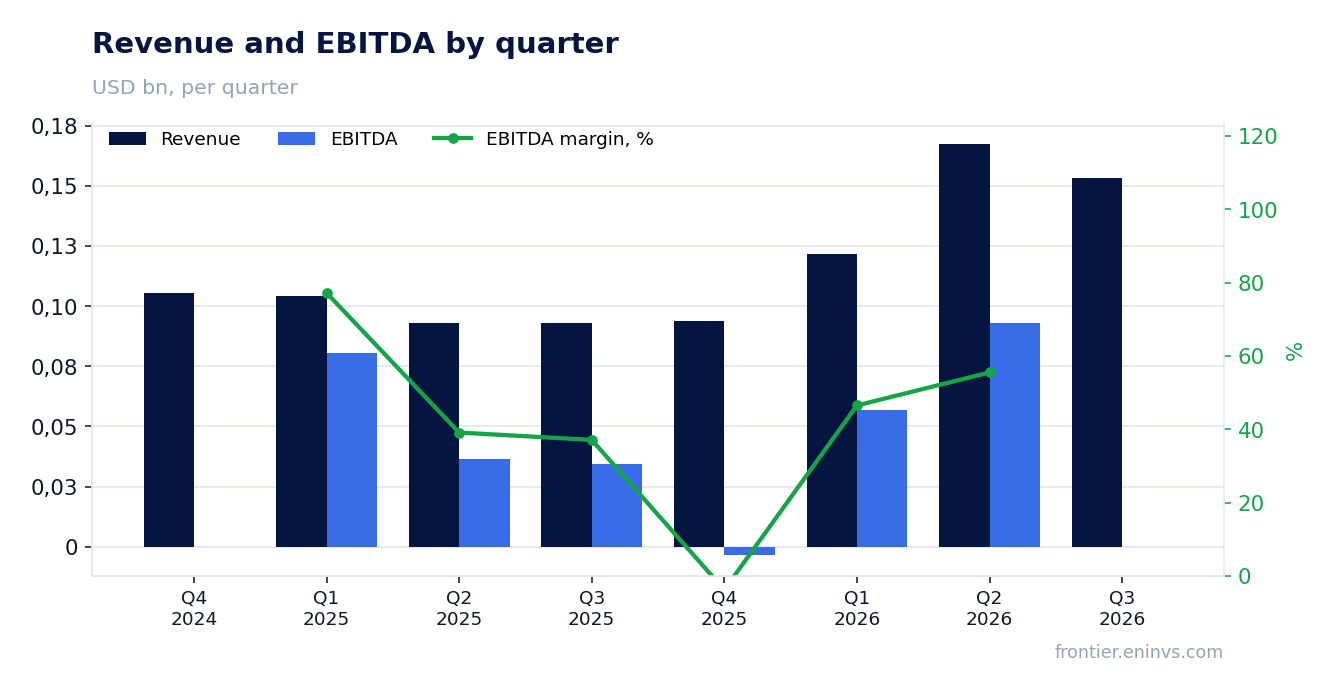
Revenue grew 65.0% year on year, but the pace decelerated from 80.3% in the second quarter
Third-quarter revenue of USD 153.5m is 65.0% above USD 93.0m a year earlier. That is strong growth, but in the second quarter it was 80.3% – the pace decelerated because the oil price fell 7.9% quarter on quarter.
The quarterly path is uneven: after USD 121.9m in the first quarter and USD 167.6m in the second, third-quarter revenue was USD 153.5m – below the second but above the first. Year on year growth accelerated from 17.1% in the first quarter to 80.3% in the second and decelerated to 65.0% in the third.
For a holder what matters is not the growth number itself but its source: year on year revenue was pulled up by price, and the quarterly deceleration by its pullback. If spot at USD 91.8 holds, next quarter's base will be higher than the reported one.
Net margin rose to 27.1% from 10.8%, and the USD 41.5m quarterly profit is a price result, not a one-off
Third-quarter net profit was USD 41.5m versus USD 10.0m a year earlier – growth of 314.7%. Net margin rose to 27.1% from 10.8%: on revenue of USD 153.5m each percentage point of margin is worth about USD 1.5m of profit.
Profit grew faster than revenue because costs do not keep pace with the oil price: non-commodity expenses are relatively stable, and the more expensive oil flows almost entirely into margin. The facts contain no one-off items that would explain the jump – the quarterly profit reflects price.
Over the last twelve months net profit was USD 77.0m on revenue of USD 536.9m and EBITDA of USD 194.4m. Return on equity is 24.0% – high for the sector, but it is earned on profits made at high prices.
Operating cash flow of USD 70.5m covers capex of USD 43.0m almost twice over
Third-quarter operating cash flow was USD 70.5m against capex of USD 43.0m – free cash flow of about USD 27.5m. Capex rose from USD 19.4m a year earlier: the company is reinvesting to sustain production.
Over the last twelve months operating cash flow was USD 217.5m, with capex of USD 43.0m in the third quarter alone. Such a flow at a price of USD 85.4 is the main argument for the dividend.
Net debt was USD 6.6m on 30 September 2026 versus USD 0.1bn on 30 September 2025 – a reduction of USD 0.1bn over twelve months. Leverage is 0.03x LTM EBITDA: debt is practically absent, and the entire post-capex cash flow is available to shareholders.
Net debt fell from USD 0.1bn on 30 September 2025 to USD 0.0bn on 30 September 2026, with leverage at 0.03x LTM EBITDA
Net debt on 30 September 2026 was USD 6.6m – 0.03x EBITDA for the last twelve months (USD 194.4m). The company has practically no leverage, and interest expense does not eat into profit.
The reduction from USD 0.1bn on 30 September 2025 to USD 0.0bn on 30 September 2026 was financed by cash flow at high oil prices. At USD 85.4 and quarterly cash flow of USD 70.5m the company can both pay dividends and keep debt near zero.
Reserves last 18.5 years at the current production rate – a long horizon that reduces the risk of production decline and supports the dividend base.
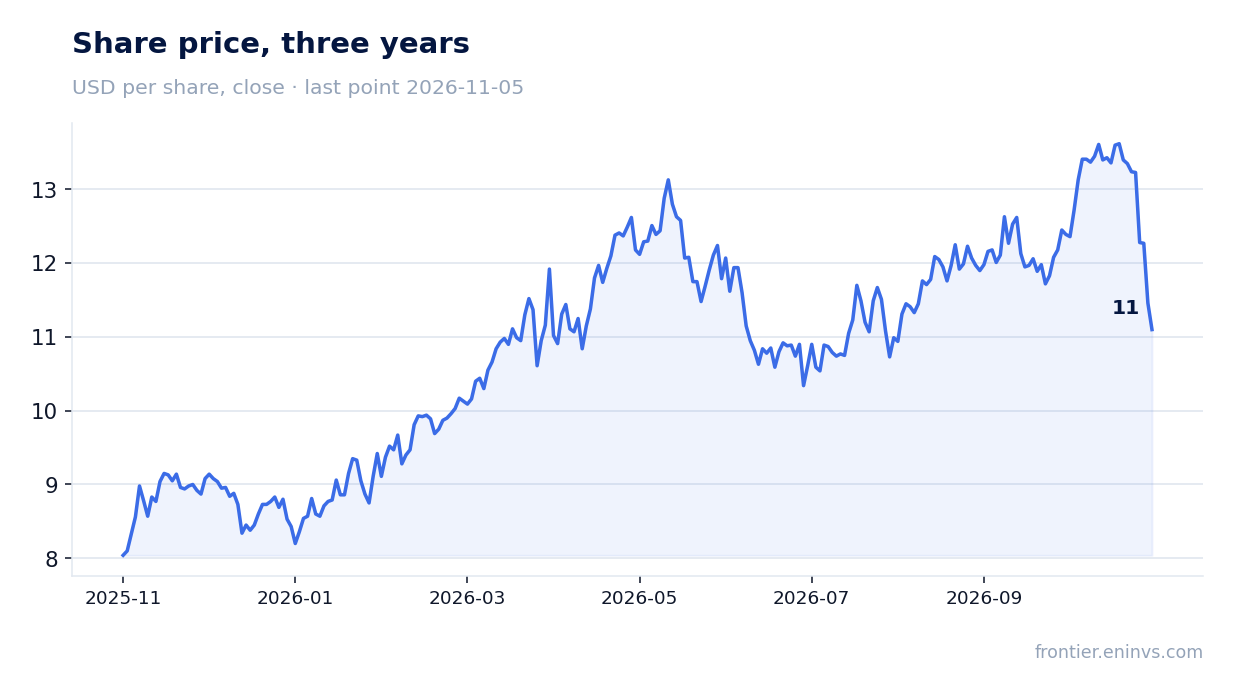
A 6.5% dividend yield against EV/EBITDA of 7.7 versus its own 5.6 average – the yield is there, but investors pay a premium to history for it
The trailing twelve-month dividend yield is 6.5% – higher than most oil producers carry at such low leverage. With LTM net profit of USD 77.0m and a market cap of USD 1.39bn the payout is covered by profit, and LTM cash flow of USD 217.5m covers it with a wide margin.
Our estimate of the current-year dividend is based on LTM profit and the payout ratio the company has maintained in past periods; it hinges on the oil price: at spot of USD 91.8 next quarter's base is higher than the reported one, at a pullback to USD 85.4 it is lower. The dividend is more sensitive to price than to production.
EV/EBITDA LTM is 7.7 against its own three-year average of 5.6 – 39% above history. P/E LTM is 18.0. The market has already priced in high oil and a stable dividend, so for the 6.5% yield the investor pays a premium to the company's own historical level.
On the portal's model, re-pricing EBITDA to current prices at the target EV/EBITDA puts the share at -1% to fair value – the market values the stock almost exactly at fair value. What could cut the payout is oil below USD 85 or capex above USD 43.0m a quarter.
Valuation on the latest reported figures
| Metric | Value |
|---|---|
| Market cap | 1.39 bn USD |
| P/E (LTM) | 18.0 |
| EV/EBITDA (LTM) | 7.7 |
| P/B | 2.27 |
| Net debt / EBITDA (LTM) | 0.03 |
| Operating cash flow (LTM) | 0.22 bn |
| ROE | 24.0% |
| Dividend yield (12m) | 6.5% |
| EV/EBITDA, 3-year average | 5.6 |
Bottom line
What was genuinely strong in the report was everything tied to price: revenue +65.0%, net profit +314.7%, margin 27.1%, cash flow of USD 70.5m against capex of USD 43.0m and almost no debt. But at last year's volumes our calculation shows the price implied USD 120.1m of revenue – the company earned USD 33.4m more through volumes and realisations, not through price, and that source needs confirmation next quarter. The real question for a holder is valuation: EV/EBITDA of 7.7 against its own 5.6 average and -1% upside on the portal's model mean the market has already paid for both high oil and the 6.5% dividend. The verdict is neutral: the yield and the balance sheet are good, but the share price leaves no cushion for an error in the oil price.
Open the company's financial profile CJ →
See also: market overview · valuation map · stock screeners