Calumet: net income fell 18% while the EBITDA jump came from one-offs in the base
Contents
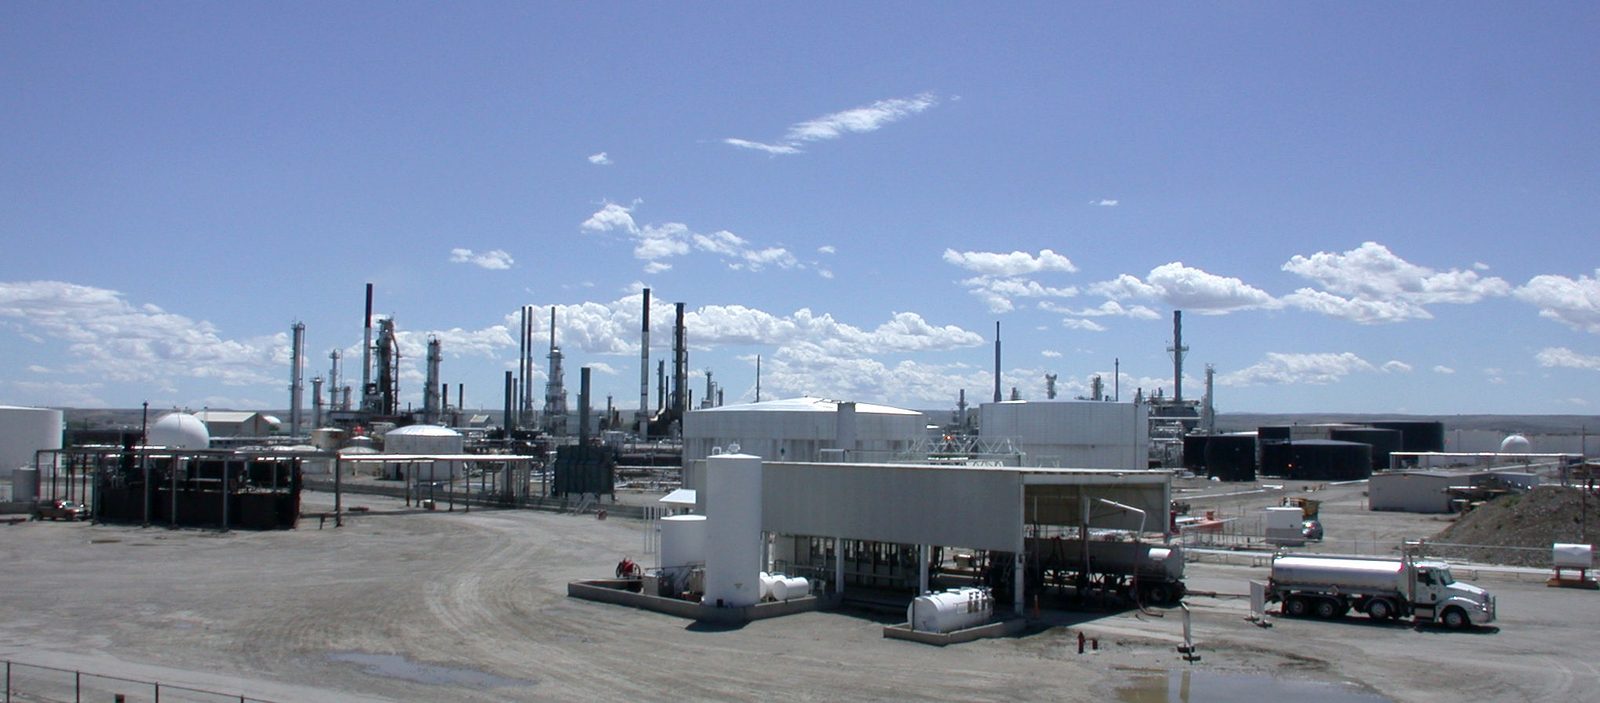
On 6 November Calumet reported results for the third quarter of 2026. Revenue rose 56.1% year on year to USD 1,682.9 million, EBITDA grew 31.2% to 490.3 million, while net income fell 18.2% to 256.4 million. The EBITDA margin narrowed from 34.7% to 29.1%, the net margin from 29.1% to 15.2%. Our conclusion: rather unattractive – an EV/EBITDA of 16.1 with net debt at 6.08 EBITDA leaves no margin of safety. Our view: the share is rather unattractive at the current price.
Our view: is there upside
Our view in numbers
| Metric | Our read |
|---|---|
| Verdict | Rather unattractive |
| Upside on the portal model | no portal model for this share |
| Net debt / EBITDA | 6.08 – high leverage |
| Strongest case for | Specialty products generated 248.1 million of adjusted EBITDA, and operating cash flow of 218.5 million against capex of 11.8 million provides cash for further debt reduction. |
| Strongest case against | An EV/EBITDA of 16.1 with net debt at 6.08 EBITDA and an 18.2% fall in net income leaves no margin of safety. |
| What would change the view | The verdict would improve if trailing twelve-month EBITDA exceeds 500 million with net debt below 2 bn, and would worsen if quarterly specialty products EBITDA falls below 150 million. |
Key takeaways
— Revenue accelerated to +56.1% year on year, and almost all of the gain came from the specialty products segment
— The EBITDA margin narrowed from 34.7% to 29.1% because one-off items inflated the year-ago base
— Net income of USD 256.4 million was held up only by non-cash adjustments of 290.5 million
— Net debt fell from 2.1 bn on 31 December 2025 to 1.9 bn on 30 September 2026
— Operating cash flow of 218.5 million against capex of 11.8 million leaves money for debt repayment
— EV/EBITDA of 16.1 and debt at 6.08 EBITDA mean the price already discounts a strong quarter
Key figures, USD bn
| Metric | Q3 2025 | Q3 2026 | Change |
|---|---|---|---|
| Revenue | 1.08 | 1.68 | +56.1% |
| EBITDA | 0.37 | 0.49 | +31.2% |
| Operating profit | 0.32 | 0.45 | +40.5% |
| Net profit | 0.31 | 0.26 | -18.2% |
| Operating cash flow | 0.10 | 0.22 | +117.6% |
| Capex | 0.01 | 0.01 | +40.5% |
| EBITDA margin | 34.7% | 29.1% | -5.6 pp |
| Net margin | 29.1% | 15.2% | -13.9 pp |
Revenue accelerated to +56.1% year on year, and almost all of the gain came from the specialty products segment
Revenue for the third quarter of 2026 was USD 1,682.9 million against 1,078.0 million a year earlier. Growth of 56.1% is clearly faster than 40.8% in the second quarter – an acceleration. The specialty products segment did most of the work: its sales rose from 679.1 million to 1,071.2 million, a gain of 392.1 million, or roughly 58%.
Performance Brands stayed small: adjusted EBITDA of 9.1 million against 13.2 million a year earlier. Montana/Renewables delivered 110.6 million of adjusted EBITDA with tax attributes against 17.1 million. Specialty products, with 248.1 million of adjusted EBITDA, set the tone for the quarter.
Management attributes the specialty products strength to a continuing global shortage, high utilisation and commercial execution. This is not a one-off demand spike but the result of disrupted supply chains, which is exactly why the comparison base will be hard to beat.
Revenue and EBITDA by quarter
| Period | Measure | bn USD |
|---|---|---|
| Q4 2024 | Revenue | 0.9495 |
| Q1 2025 | Revenue | 0.9939 |
| Q2 2025 | Revenue | 1.0266 |
| Q3 2025 | Revenue | 1.078 |
| Q4 2025 | Revenue | 1.0386 |
| Q1 2026 | Revenue | 1.0297 |
| Q2 2026 | Revenue | 1.4450999999999998 |
| Q3 2026 | Revenue | 1.6829 |
| Q4 2024 | EBITDA | 0.0731 |
| Q1 2025 | EBITDA | −0.011700000000000002 |
| Q2 2025 | EBITDA | −0.0531 |
| Q3 2025 | EBITDA | 0.3736 |
| Q4 2025 | EBITDA | −0.018600000000000002 |
| Q1 2026 | EBITDA | −0.1383 |
| Q2 2026 | EBITDA | −0.0053999999999999986 |
| Q3 2026 | EBITDA | 0.4903 |
EBITDA margin
| Period | Measure | % |
|---|---|---|
| Q4 2024 | EBITDA margin | 7.7 |
| Q1 2025 | EBITDA margin | −1.2 |
| Q2 2025 | EBITDA margin | −5.2 |
| Q3 2025 | EBITDA margin | 34.7 |
| Q4 2025 | EBITDA margin | −1.8 |
| Q1 2026 | EBITDA margin | −13.4 |
| Q2 2026 | EBITDA margin | −0.4 |
| Q3 2026 | EBITDA margin | 29.1 |
The EBITDA margin narrowed from 34.7% to 29.1% because one-off items inflated the year-ago base
EBITDA for the reported quarter was USD 490.3 million, a margin of 29.1% against 34.7% a year earlier. A 5.6 percentage point squeeze on 56.1% revenue growth means costs rose faster than sales. Cost of sales climbed from 704.3 million to 1,139.7 million, and general and administrative expenses from 31.4 million to 70.1 million.
Part of that pressure comes from one-off items in last year's base. In the third quarter of 2025 the company booked a RINs expense benefit of 303.1 million, which flattered that period's profit. In the reported quarter the same line produced a gain of 106.8 million, roughly 196 million weaker.
The company's own adjusted EBITDA was USD 322.0 million against 69.6 million a year earlier. That is a different measure and it rose several-fold, but comparing it with our EBITDA figure is not valid because the methodologies differ.
Net profit by quarter
| Period | Measure | bn USD |
|---|---|---|
| Q4 2024 | Net profit | −0.04230000000000001 |
| Q1 2025 | Net profit | −0.162 |
| Q2 2025 | Net profit | −0.1479 |
| Q3 2025 | Net profit | 0.31339999999999996 |
| Q4 2025 | Net profit | −0.0373 |
| Q1 2026 | Net profit | −0.317 |
| Q2 2026 | Net profit | −0.0959 |
| Q3 2026 | Net profit | 0.25639999999999996 |
Net income of USD 256.4 million was held up only by non-cash adjustments of 290.5 million
Net income attributable to shareholders was USD 256.4 million against 313.4 million a year earlier, a fall of 18.2%. Operating profit, by contrast, rose from 322.9 million to 453.7 million. The gap is explained by financial lines: the loss on derivatives was 153.2 million against 1.5 million a year earlier.
The company explicitly names two non-cash items that hit profit: an unrealised derivative loss of 113.8 million and non-cash RINs items of 176.7 million. Together that is 290.5 million – more than the entire quarter's net income. Without them the result would have been materially higher, but the quality of earnings also looks different.
The tax line helped too: the company booked a tax benefit of 28.0 million on pre-tax profit of 245.3 million. That lowered the effective rate and supported the bottom line.
Net debt fell from 2.1 bn on 31 December 2025 to 1.9 bn on 30 September 2026
Net debt on 30 September 2026 was USD 1.9 bn against 2.1 bn on 31 December 2025, a reduction of 0.2 bn. The company redeemed 100 million of the 9.75% mirror notes in July and another 150 million of the 2028 notes in October, after the reporting date. That cuts interest expense, which was 50.8 million in the quarter.
Net debt to trailing twelve-month EBITDA stands at 6.08. That is a high level for a company with a market capitalisation of USD 3.05 bn. Trailing twelve-month EBITDA was 320.3 million, and that denominator drives the leverage figure.
A 0.2 bn reduction against quarterly EBITDA of 490.3 million looks modest, but the company promises to keep paying down debt. For now leverage remains the main constraint on the equity story.
Operating cash flow of 218.5 million against capex of 11.8 million leaves money for debt repayment
Operating cash flow for the quarter was USD 218.5 million, while capital expenditure was only 11.8 million. Free cash flow was therefore around 206.7 million, comfortably covering interest expense of 50.8 million. This is the strongest argument for the company's ability to cut debt without new borrowing.
For the nine months, capex was 63.3 million and operating cash flow 224.6 million. The quarter was exceptionally strong on cash, but the year as a whole is more modest: most of the flow came in the third quarter.
The company is pushing its MaxSAF sustainable aviation fuel expansion and targets around 200 million gallons a year by the end of 2028. That will require capital spending, and the current low level is unlikely to persist.
Share price, three years
close, last point 2026-11-10
| Period | Measure | USD per share |
|---|---|---|
| 2025-11-10 | Closing price | 19.149999618530273 |
| 2025-11-11 | Closing price | 19.280000686645508 |
| 2025-11-12 | Closing price | 18.93000030517578 |
| 2025-11-13 | Closing price | 18.309999465942383 |
| 2025-11-14 | Closing price | 18.670000076293945 |
| 2025-11-17 | Closing price | 18.56999969482422 |
| 2025-11-18 | Closing price | 19.079999923706055 |
| 2025-11-19 | Closing price | 18.700000762939453 |
| 2025-11-20 | Closing price | 18.219999313354492 |
| 2025-11-21 | Closing price | 18.649999618530273 |
| 2025-11-24 | Closing price | 18.559999465942383 |
| 2025-11-25 | Closing price | 19.040000915527344 |
| 2025-11-26 | Closing price | 19.030000686645508 |
| 2025-11-28 | Closing price | 19.299999237060547 |
| 2025-12-01 | Closing price | 19.329999923706055 |
| 2025-12-02 | Closing price | 19.520000457763672 |
| 2025-12-03 | Closing price | 19.6299991607666 |
| 2025-12-04 | Closing price | 19.450000762939453 |
| 2025-12-05 | Closing price | 19.34000015258789 |
| 2025-12-08 | Closing price | 19.389999389648438 |
| 2025-12-09 | Closing price | 19.799999237060547 |
| 2025-12-10 | Closing price | 19.959999084472656 |
| 2025-12-11 | Closing price | 20.239999771118164 |
| 2025-12-12 | Closing price | 20.459999084472656 |
| 2025-12-15 | Closing price | 20.420000076293945 |
| 2025-12-16 | Closing price | 19.600000381469727 |
| 2025-12-17 | Closing price | 19.389999389648438 |
| 2025-12-18 | Closing price | 19.510000228881836 |
| 2025-12-19 | Closing price | 20.260000228881836 |
| 2025-12-22 | Closing price | 19.950000762939453 |
| 2025-12-23 | Closing price | 20.0 |
| 2025-12-24 | Closing price | 19.709999084472656 |
| 2025-12-26 | Closing price | 19.690000534057617 |
| 2025-12-29 | Closing price | 19.780000686645508 |
| 2025-12-30 | Closing price | 19.729999542236328 |
| 2025-12-31 | Closing price | 19.8700008392334 |
| 2026-01-02 | Closing price | 19.549999237060547 |
| 2026-01-05 | Closing price | 19.520000457763672 |
| 2026-01-06 | Closing price | 19.59000015258789 |
| 2026-01-07 | Closing price | 19.770000457763672 |
| 2026-01-08 | Closing price | 20.1299991607666 |
| 2026-01-09 | Closing price | 19.8700008392334 |
| 2026-01-12 | Closing price | 19.979999542236328 |
| 2026-01-13 | Closing price | 19.889999389648438 |
| 2026-01-14 | Closing price | 20.100000381469727 |
| 2026-01-15 | Closing price | 20.559999465942383 |
| 2026-01-16 | Closing price | 20.329999923706055 |
| 2026-01-20 | Closing price | 20.579999923706055 |
| 2026-01-21 | Closing price | 20.739999771118164 |
| 2026-01-22 | Closing price | 20.850000381469727 |
| 2026-01-23 | Closing price | 21.1299991607666 |
| 2026-01-26 | Closing price | 21.469999313354492 |
| 2026-01-27 | Closing price | 22.1299991607666 |
| 2026-01-28 | Closing price | 21.59000015258789 |
| 2026-01-29 | Closing price | 22.389999389648438 |
| 2026-01-30 | Closing price | 22.40999984741211 |
| 2026-02-02 | Closing price | 22.729999542236328 |
| 2026-02-03 | Closing price | 23.989999771118164 |
| 2026-02-04 | Closing price | 24.510000228881836 |
| 2026-02-05 | Closing price | 24.540000915527344 |
| 2026-02-06 | Closing price | 25.190000534057617 |
| 2026-02-09 | Closing price | 25.760000228881836 |
| 2026-02-10 | Closing price | 25.170000076293945 |
| 2026-02-11 | Closing price | 25.690000534057617 |
| 2026-02-12 | Closing price | 25.979999542236328 |
| 2026-02-13 | Closing price | 28.610000610351562 |
| 2026-02-17 | Closing price | 28.729999542236328 |
| 2026-02-18 | Closing price | 29.5 |
| 2026-02-19 | Closing price | 29.389999389648438 |
| 2026-02-20 | Closing price | 28.139999389648438 |
| 2026-02-23 | Closing price | 29.0 |
| 2026-02-24 | Closing price | 29.25 |
| 2026-02-25 | Closing price | 29.59000015258789 |
| 2026-02-26 | Closing price | 30.219999313354492 |
| 2026-02-27 | Closing price | 26.959999084472656 |
| 2026-03-02 | Closing price | 27.40999984741211 |
| 2026-03-03 | Closing price | 27.889999389648438 |
| 2026-03-04 | Closing price | 29.31999969482422 |
| 2026-03-05 | Closing price | 30.290000915527344 |
| 2026-03-06 | Closing price | 30.399999618530273 |
| 2026-03-09 | Closing price | 29.34000015258789 |
| 2026-03-10 | Closing price | 28.850000381469727 |
| 2026-03-11 | Closing price | 29.079999923706055 |
| 2026-03-12 | Closing price | 28.739999771118164 |
| 2026-03-13 | Closing price | 28.59000015258789 |
| 2026-03-16 | Closing price | 28.280000686645508 |
| 2026-03-17 | Closing price | 28.6299991607666 |
| 2026-03-18 | Closing price | 29.110000610351562 |
| 2026-03-19 | Closing price | 28.719999313354492 |
| 2026-03-20 | Closing price | 28.040000915527344 |
| 2026-03-23 | Closing price | 28.059999465942383 |
| 2026-03-24 | Closing price | 29.25 |
| 2026-03-25 | Closing price | 29.989999771118164 |
| 2026-03-26 | Closing price | 30.790000915527344 |
| 2026-03-27 | Closing price | 32.060001373291016 |
| 2026-03-30 | Closing price | 35.040000915527344 |
| 2026-03-31 | Closing price | 35.900001525878906 |
| 2026-04-01 | Closing price | 34.59000015258789 |
| 2026-04-02 | Closing price | 35.060001373291016 |
| 2026-04-06 | Closing price | 35.720001220703125 |
| 2026-04-07 | Closing price | 34.72999954223633 |
| 2026-04-08 | Closing price | 34.5 |
| 2026-04-09 | Closing price | 33.45000076293945 |
| 2026-04-10 | Closing price | 33.650001525878906 |
| 2026-04-13 | Closing price | 32.900001525878906 |
| 2026-04-14 | Closing price | 32.2400016784668 |
| 2026-04-15 | Closing price | 32.0 |
| 2026-04-16 | Closing price | 32.540000915527344 |
| 2026-04-17 | Closing price | 32.209999084472656 |
| 2026-04-20 | Closing price | 32.06999969482422 |
| 2026-04-21 | Closing price | 32.529998779296875 |
| 2026-04-22 | Closing price | 32.47999954223633 |
| 2026-04-23 | Closing price | 32.779998779296875 |
| 2026-04-24 | Closing price | 30.59000015258789 |
| 2026-04-27 | Closing price | 30.75 |
| 2026-04-28 | Closing price | 30.510000228881836 |
| 2026-04-29 | Closing price | 32.529998779296875 |
| 2026-04-30 | Closing price | 32.720001220703125 |
| 2026-05-01 | Closing price | 33.68000030517578 |
| 2026-05-04 | Closing price | 34.150001525878906 |
| 2026-05-05 | Closing price | 36.02000045776367 |
| 2026-05-06 | Closing price | 34.5 |
| 2026-05-07 | Closing price | 34.61000061035156 |
| 2026-05-08 | Closing price | 32.08000183105469 |
| 2026-05-11 | Closing price | 32.31999969482422 |
| 2026-05-12 | Closing price | 32.119998931884766 |
| 2026-05-13 | Closing price | 31.43000030517578 |
| 2026-05-14 | Closing price | 31.329999923706055 |
| 2026-05-15 | Closing price | 31.3799991607666 |
| 2026-05-18 | Closing price | 32.349998474121094 |
| 2026-05-19 | Closing price | 32.22999954223633 |
| 2026-05-20 | Closing price | 31.920000076293945 |
| 2026-05-21 | Closing price | 32.869998931884766 |
| 2026-05-22 | Closing price | 34.220001220703125 |
| 2026-05-26 | Closing price | 33.970001220703125 |
| 2026-05-27 | Closing price | 34.08000183105469 |
| 2026-05-28 | Closing price | 35.5 |
| 2026-05-29 | Closing price | 35.470001220703125 |
| 2026-06-01 | Closing price | 35.81999969482422 |
| 2026-06-02 | Closing price | 36.11000061035156 |
| 2026-06-03 | Closing price | 37.369998931884766 |
| 2026-06-04 | Closing price | 37.40999984741211 |
| 2026-06-05 | Closing price | 35.16999816894531 |
| 2026-06-08 | Closing price | 35.5 |
| 2026-06-09 | Closing price | 34.04999923706055 |
| 2026-06-10 | Closing price | 34.650001525878906 |
| 2026-06-11 | Closing price | 34.91999816894531 |
| 2026-06-12 | Closing price | 34.41999816894531 |
| 2026-06-15 | Closing price | 33.40999984741211 |
| 2026-06-16 | Closing price | 32.689998626708984 |
| 2026-06-17 | Closing price | 33.150001525878906 |
| 2026-06-18 | Closing price | 32.63999938964844 |
| 2026-06-22 | Closing price | 33.25 |
| 2026-06-23 | Closing price | 32.83000183105469 |
| 2026-06-24 | Closing price | 32.7400016784668 |
| 2026-06-25 | Closing price | 34.27000045776367 |
| 2026-06-26 | Closing price | 35.08000183105469 |
| 2026-06-29 | Closing price | 35.83000183105469 |
| 2026-06-30 | Closing price | 36.02000045776367 |
| 2026-07-01 | Closing price | 36.43000030517578 |
| 2026-07-02 | Closing price | 36.41999816894531 |
| 2026-07-06 | Closing price | 36.869998931884766 |
| 2026-07-07 | Closing price | 37.16999816894531 |
| 2026-07-08 | Closing price | 38.790000915527344 |
| 2026-07-09 | Closing price | 39.0 |
| 2026-07-10 | Closing price | 39.470001220703125 |
| 2026-07-13 | Closing price | 39.58000183105469 |
| 2026-07-14 | Closing price | 39.56999969482422 |
| 2026-07-15 | Closing price | 40.0099983215332 |
| 2026-07-16 | Closing price | 41.08000183105469 |
| 2026-07-17 | Closing price | 42.83000183105469 |
| 2026-07-20 | Closing price | 43.439998626708984 |
| 2026-07-21 | Closing price | 44.16999816894531 |
| 2026-07-22 | Closing price | 44.13999938964844 |
| 2026-07-23 | Closing price | 42.81999969482422 |
| 2026-07-24 | Closing price | 41.689998626708984 |
| 2026-07-27 | Closing price | 41.279998779296875 |
| 2026-07-28 | Closing price | 41.47999954223633 |
| 2026-07-29 | Closing price | 42.400001525878906 |
| 2026-07-30 | Closing price | 43.75 |
| 2026-07-31 | Closing price | 44.189998626708984 |
| 2026-08-03 | Closing price | 42.369998931884766 |
| 2026-08-04 | Closing price | 41.560001373291016 |
| 2026-08-05 | Closing price | 40.2599983215332 |
| 2026-08-06 | Closing price | 41.880001068115234 |
| 2026-08-07 | Closing price | 39.47999954223633 |
| 2026-08-10 | Closing price | 45.470001220703125 |
| 2026-08-11 | Closing price | 46.040000915527344 |
| 2026-08-12 | Closing price | 47.189998626708984 |
| 2026-08-13 | Closing price | 48.790000915527344 |
| 2026-08-14 | Closing price | 47.720001220703125 |
| 2026-08-17 | Closing price | 48.349998474121094 |
| 2026-08-18 | Closing price | 50.810001373291016 |
| 2026-08-19 | Closing price | 49.189998626708984 |
| 2026-08-20 | Closing price | 48.290000915527344 |
| 2026-08-21 | Closing price | 49.0099983215332 |
| 2026-08-24 | Closing price | 47.31999969482422 |
| 2026-08-25 | Closing price | 47.029998779296875 |
| 2026-08-26 | Closing price | 47.790000915527344 |
| 2026-08-27 | Closing price | 45.77000045776367 |
| 2026-08-28 | Closing price | 47.75 |
| 2026-08-31 | Closing price | 49.72999954223633 |
| 2026-09-01 | Closing price | 51.52000045776367 |
| 2026-09-02 | Closing price | 53.06999969482422 |
| 2026-09-03 | Closing price | 53.5 |
| 2026-09-04 | Closing price | 53.130001068115234 |
| 2026-09-08 | Closing price | 53.90999984741211 |
| 2026-09-09 | Closing price | 55.689998626708984 |
| 2026-09-10 | Closing price | 56.439998626708984 |
| 2026-09-11 | Closing price | 56.79999923706055 |
| 2026-09-14 | Closing price | 56.54999923706055 |
| 2026-09-15 | Closing price | 57.54999923706055 |
| 2026-09-16 | Closing price | 58.0099983215332 |
| 2026-09-17 | Closing price | 59.04999923706055 |
| 2026-09-18 | Closing price | 59.0 |
| 2026-09-21 | Closing price | 58.119998931884766 |
| 2026-09-22 | Closing price | 56.41999816894531 |
| 2026-09-23 | Closing price | 54.380001068115234 |
| 2026-09-24 | Closing price | 53.849998474121094 |
| 2026-09-25 | Closing price | 53.650001525878906 |
| 2026-09-28 | Closing price | 52.61000061035156 |
| 2026-09-29 | Closing price | 53.22999954223633 |
| 2026-09-30 | Closing price | 52.380001068115234 |
| 2026-10-01 | Closing price | 53.720001220703125 |
| 2026-10-02 | Closing price | 55.279998779296875 |
| 2026-10-05 | Closing price | 56.029998779296875 |
| 2026-10-06 | Closing price | 56.209999084472656 |
| 2026-10-07 | Closing price | 56.290000915527344 |
| 2026-10-08 | Closing price | 57.75 |
| 2026-10-09 | Closing price | 56.41999816894531 |
| 2026-10-12 | Closing price | 57.16999816894531 |
| 2026-10-13 | Closing price | 58.59000015258789 |
| 2026-10-14 | Closing price | 57.529998779296875 |
| 2026-10-15 | Closing price | 58.2400016784668 |
| 2026-10-16 | Closing price | 57.75 |
| 2026-10-19 | Closing price | 55.540000915527344 |
| 2026-10-20 | Closing price | 56.04999923706055 |
| 2026-10-21 | Closing price | 52.59000015258789 |
| 2026-10-22 | Closing price | 49.31999969482422 |
| 2026-10-23 | Closing price | 49.310001373291016 |
| 2026-10-26 | Closing price | 52.16999816894531 |
| 2026-10-27 | Closing price | 49.88999938964844 |
| 2026-10-28 | Closing price | 49.88999938964844 |
| 2026-10-29 | Closing price | 48.529998779296875 |
| 2026-10-30 | Closing price | 49.650001525878906 |
| 2026-11-02 | Closing price | 46.72999954223633 |
| 2026-11-03 | Closing price | 47.33000183105469 |
| 2026-11-04 | Closing price | 43.599998474121094 |
| 2026-11-05 | Closing price | 43.349998474121094 |
| 2026-11-06 | Closing price | 39.63999938964844 |
| 2026-11-09 | Closing price | 36.060001373291016 |
| 2026-11-10 | Closing price | 34.630001068115234 |
EV/EBITDA of 16.1 and debt at 6.08 EBITDA mean the price already discounts a strong quarter
The trailing twelve-month EV/EBITDA multiple is 16.1 on a market capitalisation of USD 3.05 bn and net debt of 1.9 bn. For a company with trailing EBITDA of 320.3 million that is a rich valuation. The market has already priced in an earnings recovery that is visible in only one quarter so far.
The share price reaction confirms the caution: the stock fell 8.6% on the reporting day and 20.1% from the release to 10 November. Investors are looking at earnings quality and leverage, not at the strong top line.
Return on equity is negative at -102.2% because of an accumulated deficit of 1,729.9 million. That limits any comparison with profitable peers on a P/E basis.
Valuation on the latest reported figures
| Metric | Value |
|---|---|
| Market cap | 3.05 bn USD |
| EV/EBITDA (LTM) | 16.1 |
| Net debt / EBITDA (LTM) | 6.08 |
| Operating cash flow (LTM) | 0.34 bn |
| ROE | -102.2% |
Bottom line
The quarter was strong on revenue and operating profit: sales rose 56.1%, operating profit from 322.9 million to 453.7 million. But net income fell 18.2% because one-off items inflated the year-ago base, while non-cash adjustments of 290.5 million propped up the reported quarter. Debt is coming down but remains high at 6.08 EBITDA, and the 16.1 multiple already discounts a recovery. Our conclusion: rather unattractive – an EV/EBITDA of 16.1 with debt at 6.08 EBITDA leaves no margin of safety. Our view: the share is rather unattractive at the current price.