CMOC Group: $1.17bn quarterly profit, but net debt rose $7.9bn in three months

CMOC Group's Q3 2026 results showed revenue of $10,679.2m, operating profit of $1,929.7m and net profit of $1,167.4m at a 10.9% net margin. Net debt stood at $6,956.9m on 30 September 2026 versus minus $0.9bn on 30 June – a $7.9bn increase in the quarter. At EV/EBITDA of 9.3 the stock trades above its own three-year average of 8.7, while the portal model implies +34% upside to fair value; with a 3.5% dividend yield and 1.54x LTM EBITDA leverage the share looks rather attractive, though the debt build warrants monitoring.
Key takeaways
— Revenue of $10,679.2m in the quarter with net profit of $1,167.4m – a 10.9% net margin
— Operating profit of $1,929.7m nearly matched EBITDA, so depreciation in the quarter was minor
— Net debt rose from minus $0.9bn on 30 June to $7.0bn on 30 September – up $7.9bn in three months
— Leverage at 1.54x LTM EBITDA is moderate, but net debt itself multiplied over the quarter
— EV/EBITDA of 9.3 is 7% above its own three-year average of 8.7 – the stock is pricier than its history
— Trailing 12-month dividend yield of 3.5% against a 28.2% return on equity
— The portal model puts the share's upside to fair value at +34%
Attractiveness
Key figures, USD bn
| Metric | — | Q3 2026 | Change |
|---|---|---|---|
| Revenue | — | 10.7 | — |
| Operating profit | — | 1.93 | — |
| Net profit | — | 1.17 | — |
| Net margin | — | 10.9% | — |
Revenue of $10,679.2m in the quarter with net profit of $1,167.4m – a 10.9% net margin
In Q3 2026 CMOC Group generated revenue of $10,679.2m and net profit of $1,167.4m. The net margin was 10.9% – a level at which the company remains profitable but shows no margin expansion.
Operating profit for the quarter was $1,929.7m, corresponding to roughly 18% of revenue. The gap between operating and net profit reflects tax and financial expenses, as well as possible one-off items not detailed in the provided data.
For comparison, over the trailing twelve months revenue was $28,800.0m and net profit $2,837.2m. The quarterly result equals about 37% of annual revenue and 41% of annual profit, pointing to even dynamics without a pronounced seasonal spike.
Operating profit of $1,929.7m nearly matched EBITDA, so depreciation in the quarter was minor
Operating profit and EBITDA for Q3 2026 were identical at $1,929.7m. This means depreciation charges in the quarter were close to zero or not broken out as a separate line in the reporting.
For a mining company this is atypical: depreciation of fixed assets usually accounts for a noticeable share of operating costs. The match may reflect accounting policy or reporting structure, but without additional data the cause cannot be established.
In practice this means EBITDA adds no information about cash flow beyond operating profit. When valuing the company through EV/EBITDA, the investor is effectively working with the same number as through EV/EBIT.
Net debt rose from minus $0.9bn on 30 June to $7.0bn on 30 September – up $7.9bn in three months
On 30 June 2026 the company's net debt was negative – minus $0.9bn, meaning cash exceeded debt obligations. By 30 September 2026 net debt stood at $6,956.9m, an increase of $7.9bn over the quarter.
Over a longer period, from 31 December 2025, net debt rose from minus $0.0bn to $7.0bn – a change of $7.0bn over roughly 12 months. Thus the shift from a net cash position to a debt position occurred during 2026.
The reason for this movement is not disclosed in the provided data. It could relate to funding capital expenditure, asset acquisitions or dividend payments, but without a cash flow statement nothing specific can be asserted. What matters is that the debt level is now material relative to profit.
Leverage at 1.54x LTM EBITDA is moderate, but net debt itself multiplied over the quarter
The ratio of net debt to trailing twelve-month EBITDA is 1.54x. This is a moderate level for a mining company: debt is covered by about one and a half annual EBITDA volumes, leaving a margin of safety if commodity prices fall.
However, net debt itself – $6,956.9m – rose by $7.9bn over the quarter, whereas in mid-year the company had a net cash position. The direction of change in the leverage ratio is not provided in the facts, so it cannot be stated that leverage rose or fell.
For the investor it matters that with LTM EBITDA of $4,521.2m debt servicing remains manageable. If quarterly profit of $1,167.4m is sustained, annual cash flow should allow gradual debt reduction without harming dividends.
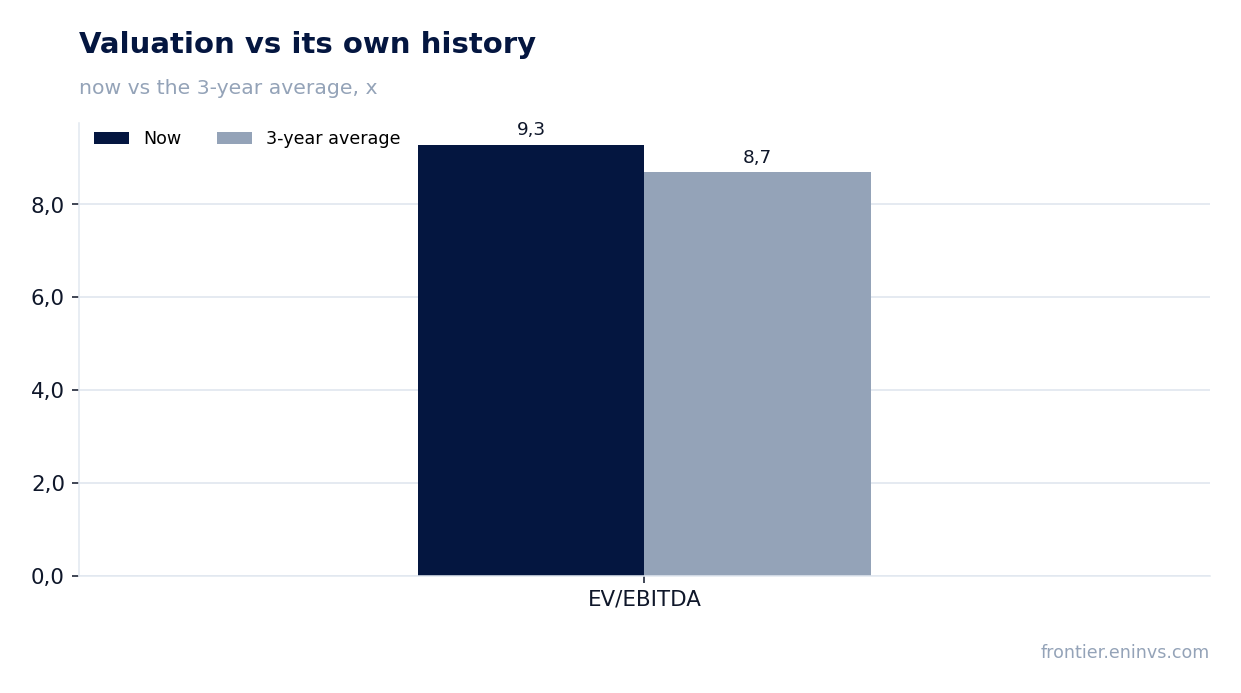
EV/EBITDA of 9.3 is 7% above its own three-year average of 8.7 – the stock is pricier than its history
On the trailing twelve-month EV/EBITDA multiple the company trades at 9.3x. The three-year average for this multiple is 8.7x, meaning the current valuation is 7% above its own history.
This means the market values CMOC Group more expensively than on average over the past three years. At the same time P/E LTM is 14.8x and market capitalisation is $41,985.4m. For a company with a 28.2% return on equity, this P/E level does not look stretched.
The portal model, which reprices EBITDA at current commodity prices at the target EV/EBITDA, implies upside to fair value of +34%. This is the portal's own estimate, not a market consensus.
Trailing 12-month dividend yield of 3.5% against a 28.2% return on equity
The trailing 12-month dividend yield is 3.5%. With market capitalisation of $41,985.4m this corresponds to payouts of roughly $1.5bn a year, although the exact amount is not disclosed in the provided data.
A return on equity of 28.2% indicates the company uses shareholder capital efficiently. The combination of such a return with a 3.5% dividend yield suggests part of profit is reinvested in growth and part returned to shareholders.
The 3.5% yield is comparable to current deposit rates but does not materially exceed them. For a dividend-oriented investor this is a moderate level that could be sensitive to a decline in profit or an increase in debt.
The portal model puts the share's upside to fair value at +34%
The portal's own model, which reprices EBITDA at current commodity prices at the target EV/EBITDA, estimates upside to fair value of +34%. This means that at current commodity prices and the target multiple the stock trades below its calculated value.
The estimate relies on LTM EBITDA of $4,521.2m and market capitalisation of $41,985.4m. At the current EV/EBITDA of 9.3x and the target level embedded in the model, fair value comes out above the market price.
It should be noted that the model is sensitive to commodity prices: a decline would reduce EBITDA and, accordingly, fair value. The +34% upside is an estimate under current conditions, not a guaranteed outcome.
Valuation on the latest reported figures
| Metric | Value |
|---|---|
| Market cap | 42.0 bn USD |
| P/E (LTM) | 14.8 |
| EV/EBITDA (LTM) | 9.3 |
| P/B | 3.57 |
| Net debt / EBITDA (LTM) | 1.54 |
| ROE | 28.2% |
| Dividend yield (12m) | 3.5% |
| EV/EBITDA, 3-year average | 8.7 |
Bottom line
CMOC Group's quarterly results showed net profit of $1,167.4m at a 10.9% margin – the company remains profitable but without margin expansion. Its strengths remain a 28.2% return on equity and moderate leverage of 1.54x LTM EBITDA. However, net debt rose from minus $0.9bn to $7.0bn over the quarter, and EV/EBITDA of 9.3x is above its own three-year average of 8.7x. The portal model implies +34% upside, which, combined with a 3.5% dividend yield, outweighs the debt build risk. Verdict – rather attractive.
Open the company's financial profile CMCLF →
See also: market overview · valuation map · stock screeners