Core Natural Resources: coal prices rose a quarter, yet EBITDA came in at half of what last year's costs and volumes implied
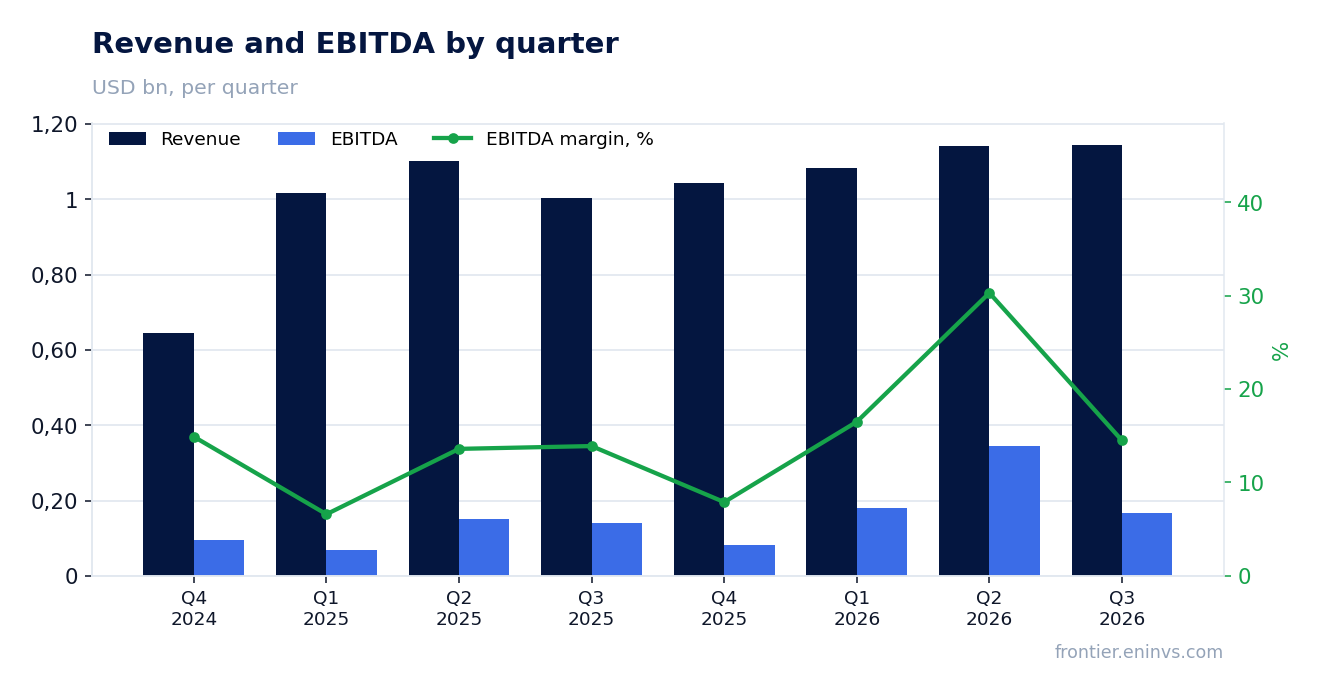
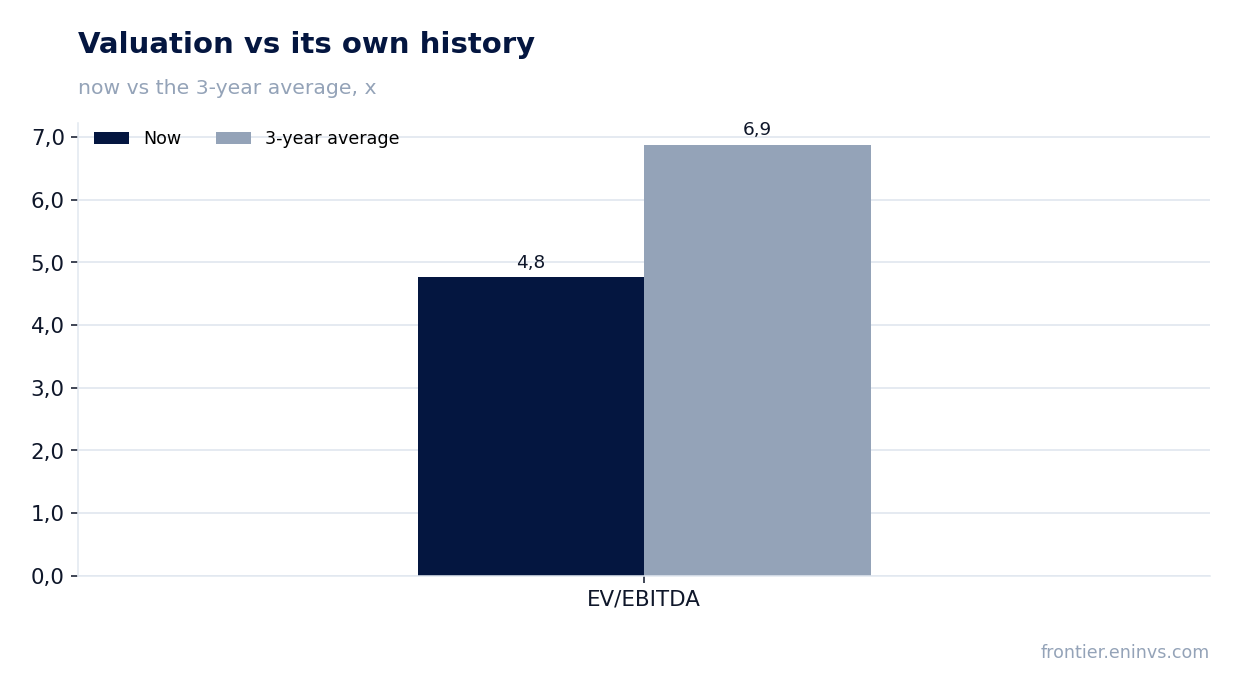
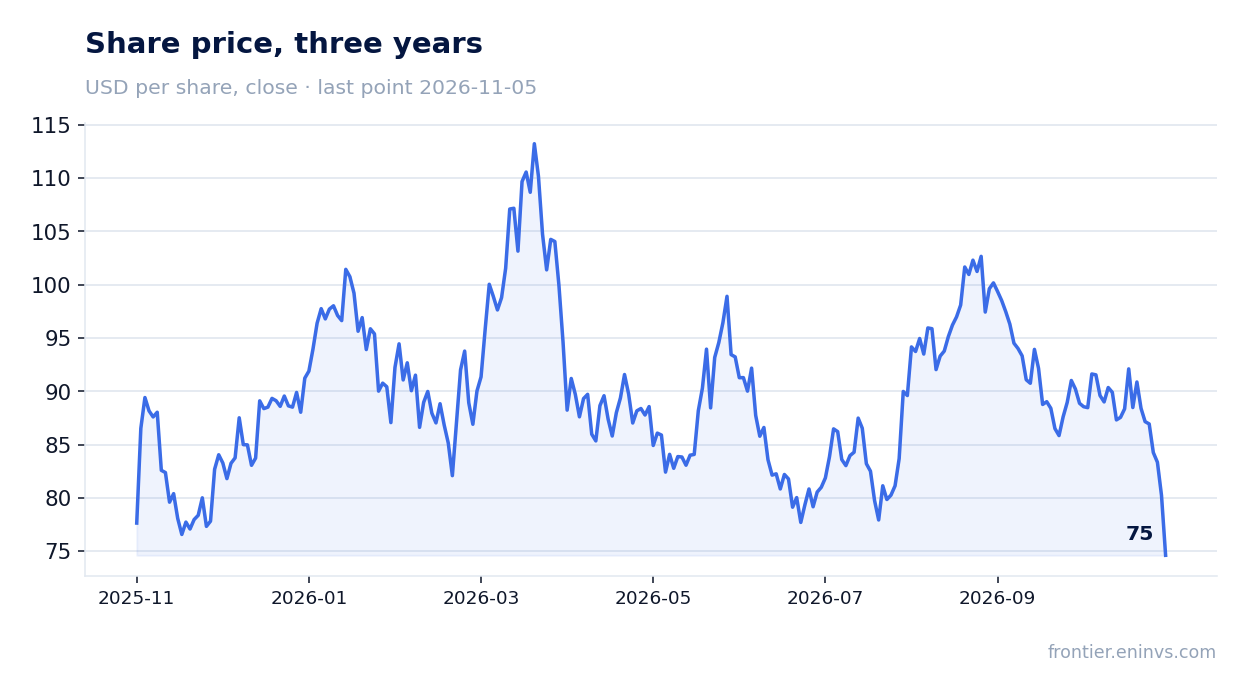
On 5 November Core Natural Resources released third-quarter 2026 results. The average thermal coal price in the period was 137.1 dollars per tonne against 110.8 a year earlier (+23.7%), coking coal 242.8 against 190.1 (+27.7%). Revenue rose 14.2% to 1,145.1 million dollars, EBITDA 19.2% to 166.0 million, while net profit fell 71.5% to 9.0 million. On our calculation, at year-ago volumes and costs and with only prices moving, EBITDA should have been 395.0 million – the company earned 229.0 million less. The share fell 7.0% after the release, and at an EV/EBITDA of 4.8 against its own three-year average of 6.9 it looks cheap, but the gap between the coal price and the earnings makes that valuation conditional.
Key takeaways
— Coal prices rose a quarter, yet revenue added only 14.2% – volumes and the discount to the benchmark ate the price
— On our calculation, at this quarter's prices and year-ago costs EBITDA should have been 395.0 million; it came in at 166.0 million
— Output grew in every segment, but the realised thermal coal price fell 5.4%
— Cost per tonne rose only for high CV thermal and Powder River Basin; metallurgical cost fell
— One-offs – 19.8 million of non-active mining costs and 17.2 million of incentive compensation – explain part of the profit drop, but not the EBITDA gap
— Free cash flow of 80.3 million went into 84.7 million of buybacks, while the dividend stayed symbolic
— EV/EBITDA of 4.8 against its own three-year average of 6.9 – the share is cheaper than its history, but LTM earnings were earned at old prices
Attractiveness
Key figures, USD bn
| Metric | Q3 2025 | Q3 2026 | Change |
|---|---|---|---|
| Revenue | 1.00 | 1.15 | +14.2% |
| EBITDA | 0.14 | 0.17 | +19.2% |
| Operating profit | -0.01 | 0.01 | to profit |
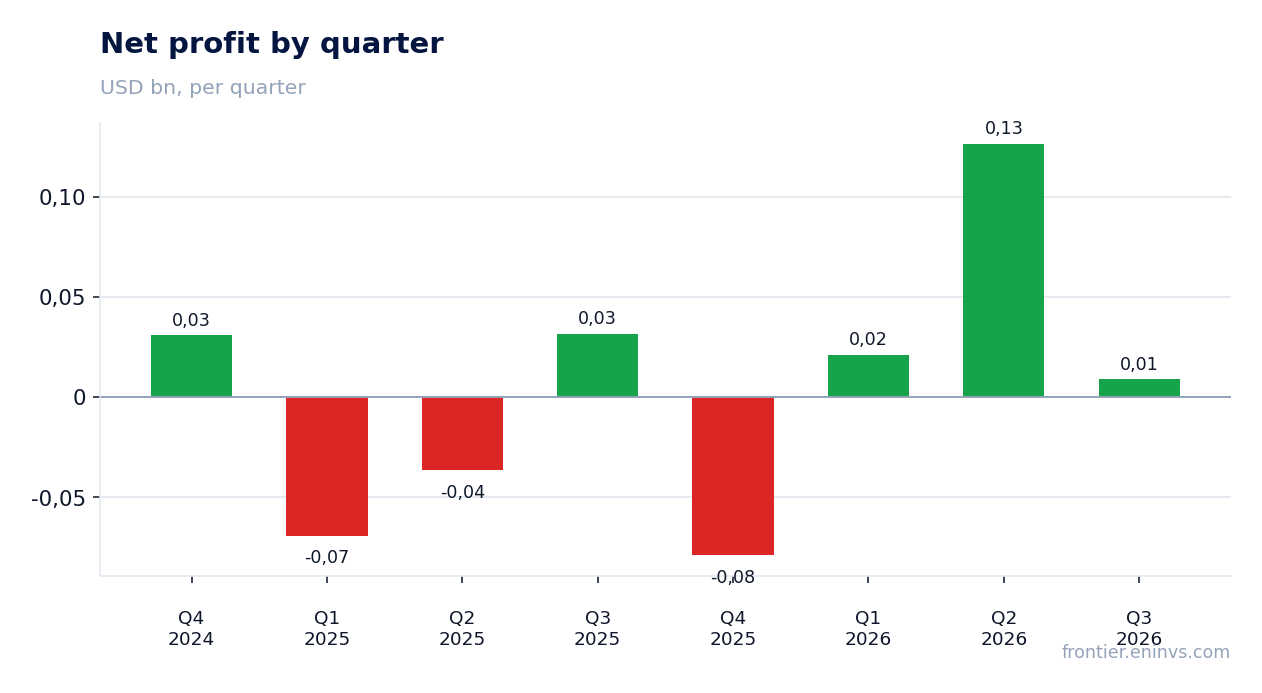
| Net profit | 0.03 | 0.01 | -71.5% |
| Operating cash flow | 0.09 | 0.17 | +98.5% |
| Capex | 0.05 | 0.09 | +91.6% |
| EBITDA margin | 13.9% | 14.5% | +0.6 pp |
| Net margin | 3.2% | 0.8% | -2.4 pp |
Coal prices rose a quarter, yet revenue added only 14.2% – volumes and the discount to the benchmark ate the price
The average thermal coal price in the third quarter of 2026 was 137.1 dollars per tonne against 110.8 a year earlier, coking coal 242.8 against 190.1. Against the previous quarter both benchmarks were almost flat: +0.7% and +2.0%. Spot on 6 November is higher – 144.7 and 258.9 dollars – so the market keeps strengthening.
Revenue rose 14.2% in the quarter to 1,145.1 million dollars, an acceleration from 3.5% in the second quarter. But the growth is smaller than the coal price move: the realised thermal price fell 5.4% to 56.6 dollars per tonne, and the ratio of realised price to benchmark dropped to 0.41 from 0.54 a year earlier. The company sells its coal at a deeper discount to the market than a year ago.
The metallurgical segment did better: realised price rose 18.3% to 120.2 dollars per tonne, coking coal 9.8% to 124.1. Powder River Basin added 1.4% to 14.3 dollars. But thermal coal is 55% of revenue in the portal model, and its price dynamics drag the overall result down.
Commodity prices: period average and now
| Benchmark | Year ago | Q3 2026 | YoY | Spot 2026-11-06 |
|---|---|---|---|---|
| Steam coal AU, USD | 110,8 | 137,1 | +23,7% | 144,7 |
| Coking coal, USD | 190,1 | 242,8 | +27,7% | 258,9 |
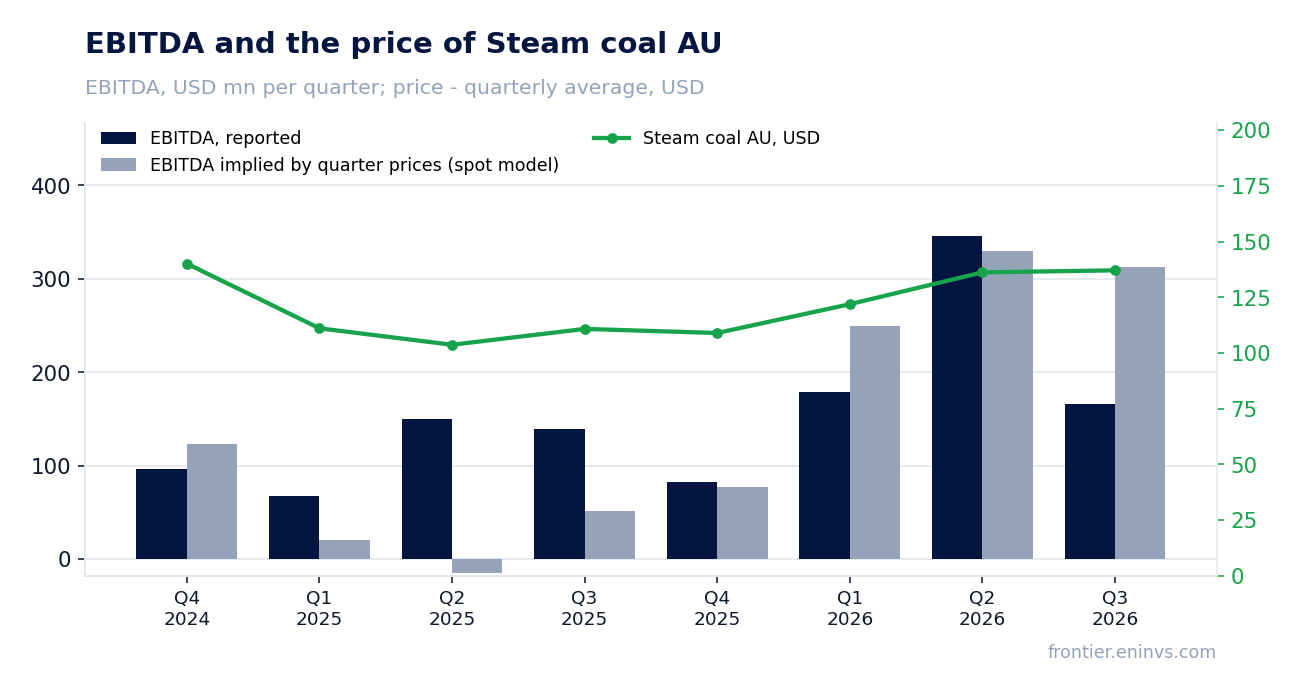
On our calculation, at this quarter's prices and year-ago costs EBITDA should have been 395.0 million; it came in at 166.0 million
Taking the volumes and costs of the third quarter of 2025 and moving only benchmark prices, revenue would have been 1,258.3 million dollars and EBITDA 395.0 million. In fact the company reported 1,145.1 million of revenue and 166.0 million of EBITDA. The EBITDA gap is 229.0 million, or 58.0%.
Part of the gap is volumes: output grew, but the realised thermal price fell and the discount to the benchmark widened. Another part is the rise in cost per tonne – 2.2% for high CV thermal and 3.5% for Powder River Basin. Metallurgical cost fell 1.3%.
The portal's spot model, repriced from the average of the previous four quarters, expected EBITDA of 312.6 million and revenue of 1,215.8 million. The actual result is 46.9% below on EBITDA and 5.8% below on revenue. The deviation of actual from the model in the four preceding periods was +170.1%, +6.3%, -28.2% and +4.7%, so the model has erred in both directions before.
What the prices implied and what the company earned
| Base (Q3 2025) | Implied at period prices | Reported | Reported vs implied | |
|---|---|---|---|---|
| Revenue, USD mn | 1 002 | 1 258 | 1 145 | -9,0% |
| EBITDA, USD mn | 139,2 | 395,0 | 166,0 | -58,0% |
| EBITDA, portal spot model, USD mn | — | 312,6 | 166,0 | -46,9% |
Output grew in every segment, but the realised thermal coal price fell 5.4%
High CV Thermal sold 8.2 million tonnes against 7.2 a year earlier (+13.9%), but 2.4% less than in the second quarter. The metallurgical segment sold 2.5 million tonnes against 2.2 (+13.6%), coking coal 2.3 million against 1.9 (+21.1%). Powder River Basin sold 13.5 million tonnes against 13.0 (+3.8%), and 32.4% more than in the previous quarter on seasonal demand.
The volume growth did not save revenue because the realised thermal price fell 5.4% to 56.6 dollars per tonne. The company attributes this to sales mix. Volume times price for High CV Thermal gives +7.7% year on year – growth, but half as fast as the benchmark price rise.
Guidance for 2026 is confirmed: coking coal 9.0–9.5 million tonnes, High CV Thermal 31.5–32.5 million, Powder River Basin 47.5–49.5 million, total 88.0–91.5 million tonnes. That is close to current run rates, so no sharp volume growth is assumed in the second half.
Production, realised price and unit cost (company release)
| Metric | Year ago | Reported period | YoY |
|---|---|---|---|
| High CV Thermal, million tons | 7,20 | 8,20 | +13,9% |
| Metallurgical segment, total, million tons | 2,20 | 2,50 | +13,6% |
| High CV Thermal, $ per ton | 59,78 | 56,58 | -5,4% |
| Metallurgical segment, total, $ per ton | 101,60 | 120,18 | +18,3% |
| Coking coal, $ per ton | 112,94 | 124,06 | +9,8% |
| Cash cost of coal sold per ton, High CV Thermal, $ per ton | 40,53 | 41,44 | +2,2% |
| Cash cost of coal sold per ton, Metallurgical, $ per ton | 94,18 | 92,92 | -1,3% |
| Cash cost of coal sold per ton, Powder River Basin, $ per ton | 13,04 | 13,49 | +3,5% |
Cost per tonne rose only for high CV thermal and Powder River Basin; metallurgical cost fell
Cash cost per tonne for High CV Thermal rose 2.2% to 41.4 dollars, which the company attributes to normal geologic variability at its Pennsylvania Mining Complex. Powder River Basin cost rose 3.5% to 13.5 dollars. Metallurgical cost fell 1.3% to 92.9 dollars, though it was up 8% quarter on quarter on a short-term increase in contract labour.
Cash margin per tonne for High CV Thermal fell to 15.1 dollars from 19.3 a year earlier, metallurgical rose to 27.3 from 7.4, Powder River Basin was 0.8 against 1.1. The metallurgical segment has become the main profit source, while thermal and Powder River Basin run close to break-even.
Cost guidance for 2026: metallurgical 88–90 dollars per tonne, High CV Thermal 40–41, Powder River Basin 13.75–14.00. Current levels are above or at the top of these ranges, leaving little room for improvement.
One-offs – 19.8 million of non-active mining costs and 17.2 million of incentive compensation – explain part of the profit drop, but not the EBITDA gap
Net profit fell 71.5% to 9.0 million dollars, a margin of 0.8% against 3.2% a year earlier. The release names one-offs: 19.8 million of other non-active mining costs, 4.0 million of cost of sales from idled operations, 1.3 million of commodity derivative settlements and 17.2 million of nine months of discretionary employee incentive compensation.
These items sit in cost of sales and operating expenses, i.e. inside EBITDA. But EBITDA would have fallen significantly anyway: even without them the gap to the calculated 395.0 million remains large. Derivative settlements in Powder River Basin are excluded from segment cash cost, and no separate hedging line appears in the income statement.
EBITDA in our data is operating profit of 6.7 million plus depreciation of 159.3 million. Other income and expense, interest and taxes sit below operating profit and explain net profit, not EBITDA. So the weak net profit reflects both operating weakness and items below the operating line.
Free cash flow of 80.3 million went into 84.7 million of buybacks, while the dividend stayed symbolic
Operating cash flow in the quarter was 174.6 million dollars, capital expenditure 94.4 million, free cash flow 80.3 million. The company repurchased 930,611 shares for 84.7 million at an average price of 90.96 dollars – more than it earned. Since the programme began it has bought 5.2 million shares for 413.9 million at an average of 79.53 dollars, with 586.1 million of authorisation remaining.
A dividend of 0.10 dollars per share was declared, payable on 15 December 2026. At a price of 80.22 dollars that is about 0.5% a year – a symbolic yield that does not compensate for coal price volatility. The company targets returning about 75% of free cash flow to shareholders, and almost all of it goes into buybacks.
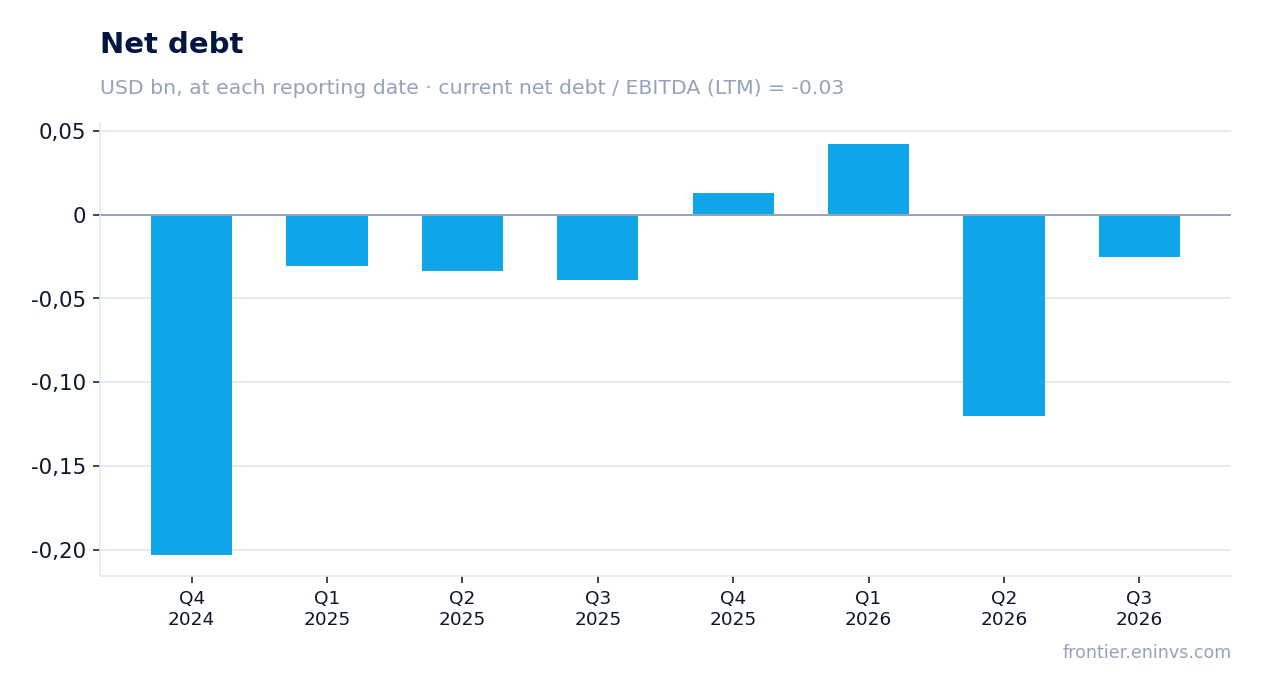
Net debt at 30 September 2026 was negative – minus 25.0 million dollars, i.e. more cash than debt. Net debt to LTM EBITDA is minus 0.03. Liquidity is 1.0 billion dollars, including 443.9 million of cash and short-term investments. Leverage is not a problem, but free cash flow is not growing either.
EV/EBITDA of 4.8 against its own three-year average of 6.9 – the share is cheaper than its history, but LTM earnings were earned at old prices
The LTM EV/EBITDA multiple is 4.8 against its own three-year average of 6.9, i.e. 31% below. LTM P/E is 47.8, reflecting weak net profit over the last twelve months (77.5 million dollars). Return on equity is 0.98%, trailing twelve-month dividend yield 0.53%.
On the portal's spot model, at today's coal prices annual EBITDA would be 1,258.1 million dollars against LTM 772.7 million (+62.8%). EV/EBITDA at current prices is 2.9, net debt to EBITDA minus 0.02. This is a floor valuation, because LTM reflects past prices and spot reflects current ones.
The portal's model puts the share's fair value 10% below the current price. So even with a cheap multiple the share does not look undervalued on our model. The key factor is the thermal coal price: if it holds above 140 dollars, EBITDA at current prices will be confirmed and the 2.9 multiple will become reality.
Valuation on the latest reported figures
| Metric | Value |
|---|---|
| Market cap | 3.70 bn USD |
| P/E (LTM) | 47.8 |
| EV/EBITDA (LTM) | 4.8 |
| P/B | 1.01 |
| Net debt / EBITDA (LTM) | -0.03 |
| Operating cash flow (LTM) | 0.86 bn |
| ROE | 1.0% |
| Dividend yield (12m) | 0.5% |
| EV/EBITDA, 3-year average | 6.9 |
Bottom line
The strong point of the quarter remains the metallurgical segment: realised price rose 18.3%, cash margin per tonne to 27.3 dollars from 7.4. But thermal coal, 55% of revenue, rose 23.7% in the market, while the company delivered only 14.2% revenue growth and 19.2% EBITDA growth. The 229.0 million gap between calculated and actual EBITDA reflects volumes, the discount to the benchmark and one-offs. The share is cheaper than its history on EV/EBITDA, but the portal model sees no upside and the 0.53% dividend yield does not attract. The verdict is neutral: the cheap multiple is balanced by weak earnings and no dividend support.
Open the company's financial profile CNR →
See also: market overview · valuation map · stock screeners