ConocoPhillips: profit more than doubled, but half the gain came from oil prices, not volumes
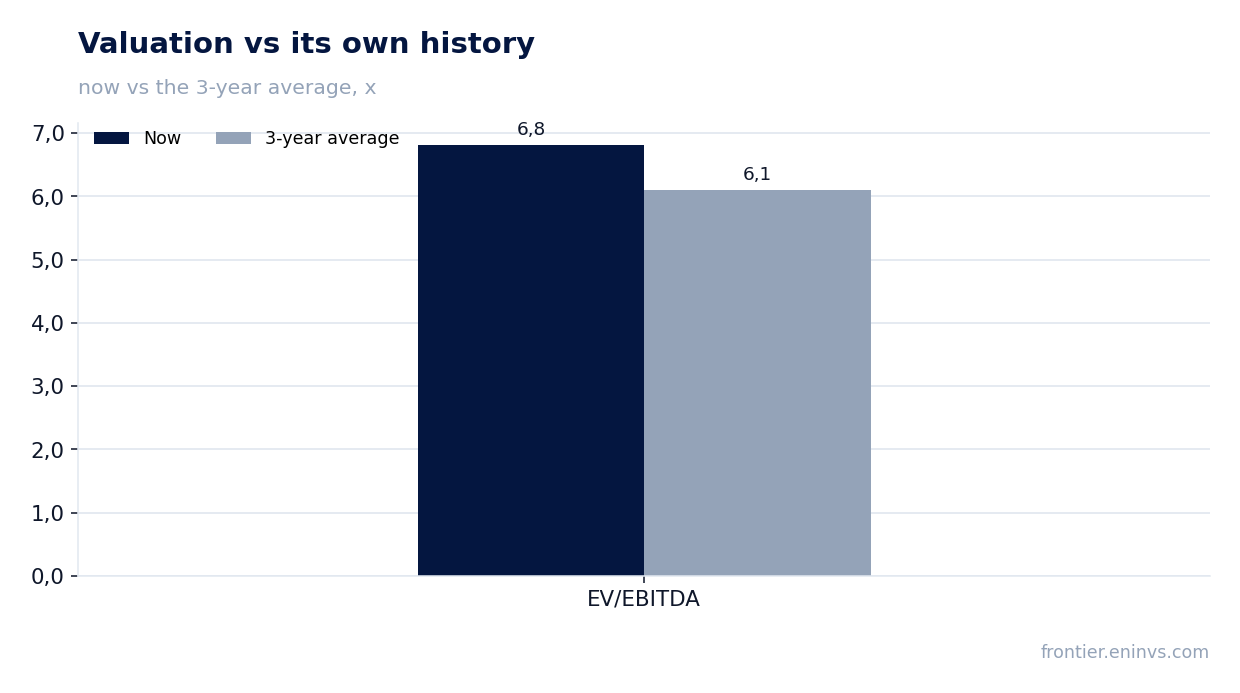
On 5 November ConocoPhillips reported third-quarter 2026 results: revenue of $17.2 bn (+14.4% year on year), net profit of $4.0 bn (+131.8%) and operating cash flow of $7.2 bn. The profit jump rests on a realised price of $61.40 per barrel of oil equivalent (+32% year on year), while production fell by 97 MBOED, and the profit includes a one-off reversal of a tax reserve. At an EV/EBITDA of 6.8 against its own three-year average of 6.1 the share looks neutral: strong cash flow and the dividend are balanced by a multiple above its own history and dependence on oil prices.
Key takeaways
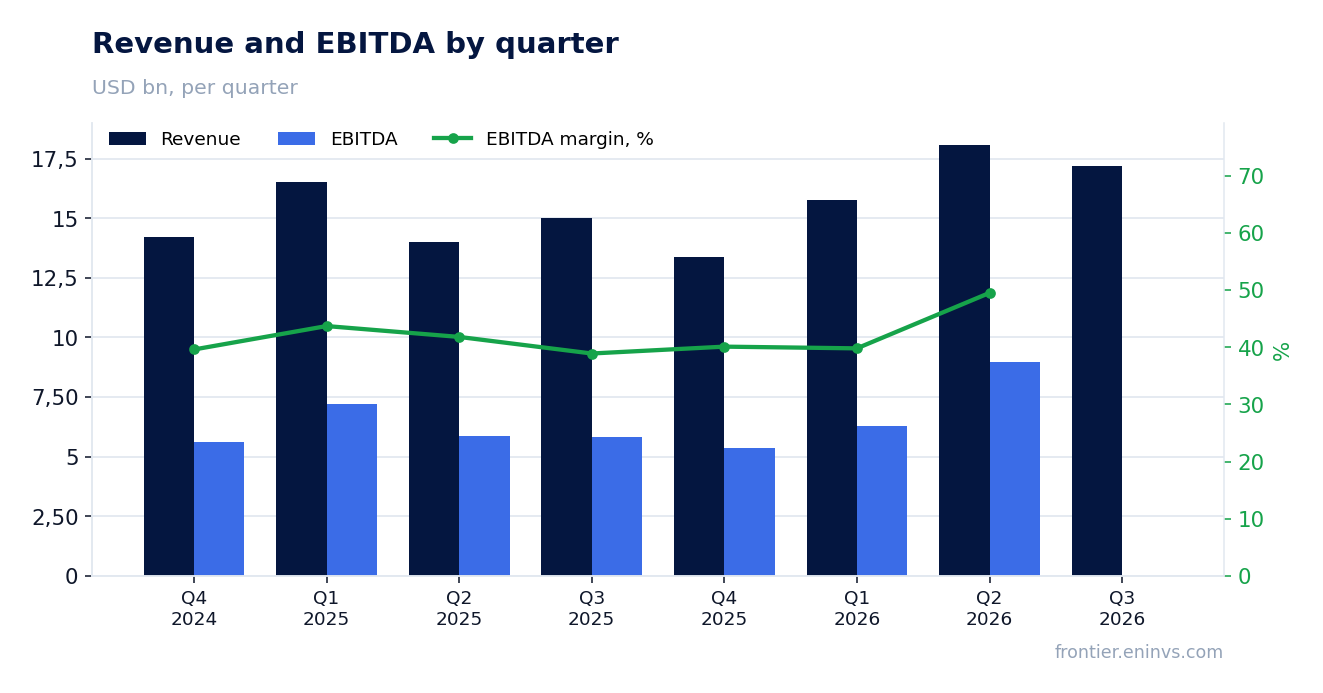
— Revenue added 14.4%, but price carried it, not volume: production fell by 97 MBOED
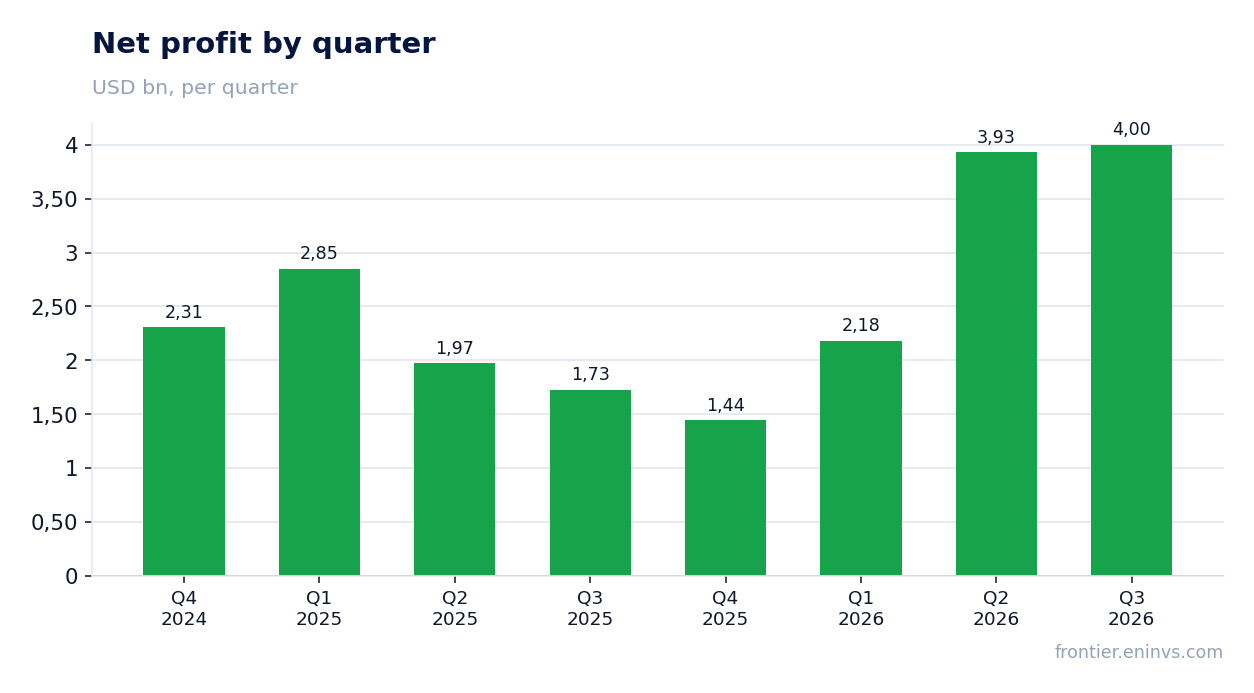
— Profit more than doubled, and part of that gain is a one-off reversal of a tax reserve
— Net margin rose to 23.3% from 11.5% a year earlier
— Free cash flow of $4.0 bn covered both the dividend and $2.4 bn of buybacks
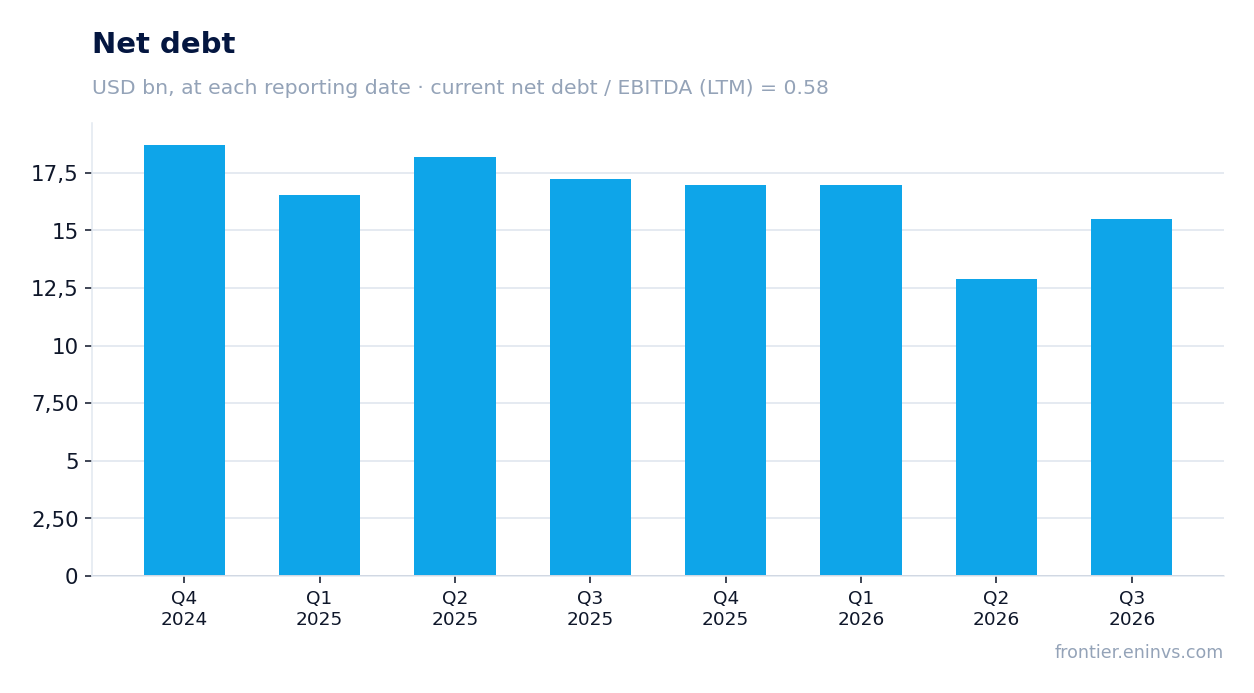
— Net debt rose to $15.5 bn over the quarter but fell by $1.7 bn over the year
— The dividend was raised 11% to $0.93 per share, a 2.5% yield – modest against the key rate
— EV/EBITDA of 6.8 is 12% above its own three-year average of 6.1
Attractiveness
Key figures, USD bn
| Metric | Q3 2025 | Q3 2026 | Change |
|---|---|---|---|
| Revenue | 15.0 | 17.2 | +14.4% |
| EBITDA | 5.84 | — | — |
| Operating profit | 2.93 | — | — |
| Net profit | 1.73 | 4.00 | +131.8% |
| Operating cash flow | 5.88 | 7.20 | +22.4% |
| Capex | 2.87 | — | — |
| EBITDA margin | 38.9% | — | — |
| Net margin | 11.5% | 23.3% | +11.8 pp |
Revenue added 14.4%, but price carried it, not volume: production fell by 97 MBOED
Third-quarter revenue was $17.2 bn against $15.0 bn a year earlier. The 14.4% gain is almost entirely price: the average realised price rose to $61.40 per barrel of oil equivalent from $46.44 a year earlier, up 32%.
Production over the same period fell to 2,302 MBOED from 2,399 MBOED a year earlier. The company attributes this to the impact of the Middle East conflict on Qatar and higher Surmont royalties; adjusted for closed transactions the decline was 40 MBOED, or 2%.
Top-line growth decelerated: +29.2% in the second quarter against +14.4% in the third. The reason is the comparison base and the fact that the price surge was not repeated quarter on quarter. For further growth, volume recovery matters more than price: fourth-quarter guidance is 2.32–2.36 million barrels of oil equivalent per day.
Profit more than doubled, and part of that gain is a one-off reversal of a tax reserve
Net profit for the quarter was $4.0 bn against $1.7 bn a year earlier, up 131.8%. Adjusted earnings, excluding special items, were $3.9 bn, or $3.27 per share against $1.61 a year earlier.
The gap between the two measures is small but matters: reported profit includes a reversal of a tax reserve worth $126 m after tax, along with $23 m of transaction and integration expenses and other items. The bulk of the increase therefore came from realised prices, not from a one-off.
The company says plainly that earnings rose primarily on higher prices, partly offset by lower volumes. That is the key vulnerability: quarterly profit rests on oil market conditions rather than on business expansion.
Net margin rose to 23.3% from 11.5% a year earlier
Net margin for the quarter was 23.3% against 11.5% in the third quarter of 2025. A near-doubling of margin on 14.4% revenue growth means costs per barrel rose more slowly than price.
Operating profit and EBITDA for the reported quarter are not disclosed, so the margin cannot be broken down by cost line. Only the result is visible: at $61.40 per barrel the company keeps almost a quarter of revenue.
For a holder this means profit is highly price-sensitive. If oil retreats, margin compresses faster than revenue, and the quarterly result could return to last year's levels without any change in the production programme.
Free cash flow of $4.0 bn covered both the dividend and $2.4 bn of buybacks
Operating cash flow for the quarter was $7.2 bn, capital expenditure and investments $3.1 bn, and free cash flow $4.0 bn. That covered $2.4 bn of buybacks and $1.0 bn of dividends, or $3.4 bn of shareholder distributions.
In addition the company received $1.6 bn of proceeds from noncore asset sales. Without those, free cash flow would still have covered distributions, but the cushion would be thinner.
The company reaffirms its target of returning 45% of operating cash flow in 2026. At the current flow and price that is achievable, but delivery rests on the same oil price as profit.
Net debt rose to $15.5 bn over the quarter but fell by $1.7 bn over the year
Net debt at 30 September 2026 was $15.5 bn against $12.9 bn at 30 June 2026, up $2.6 bn over the quarter. Over the year the picture reverses: from $17.2 bn at 30 September 2025 net debt fell by $1.7 bn.
Net debt to trailing-twelve-month EBITDA is 0.58. That is a moderate level for an upstream company: debt is roughly half of annual EBITDA.
The quarterly rise in debt alongside strong cash flow reflects shareholder distributions and capital spending that together exceeded the flow. The company also holds $10.4 bn of cash and short-term investments, so liquidity is not in question.
The dividend was raised 11% to $0.93 per share, a 2.5% yield – modest against the key rate
The company raised its quarterly ordinary dividend by 11% to $0.93 per share, payable on 1 December 2026 to holders of record on 16 November. Over the last twelve months $1.0 bn of dividends was paid, a yield of 2.5% at the current price.
Our estimate: if the quarterly dividend stays at $0.93, the annual payment will be about $3.72 per share. That is less than half of the quarterly adjusted profit annualised, so the payout ratio remains low and dividend growth rests on earnings rather than borrowing.
A 2.5% yield is modest for a market with a high key rate. Most of the capital return comes through buybacks – $2.4 bn in the quarter against $1.0 bn of dividends. For a holder this means return depends more on the share price than on the payout.
The payout would shrink if oil prices fall: dividend and buybacks together are tied to the target of returning 45% of operating cash flow, and that flow is sensitive to realised prices.
EV/EBITDA of 6.8 is 12% above its own three-year average of 6.1
On a trailing-twelve-month basis EV/EBITDA is 6.8 against its own three-year average of 6.1, so the share is 12% more expensive than its own history. P/E over the same period is 14.2 and market capitalisation is $164.0 bn.
Return on equity over twelve months is 24.4%, high for an upstream company and reflecting both the oil price and a low capital base after past write-downs.
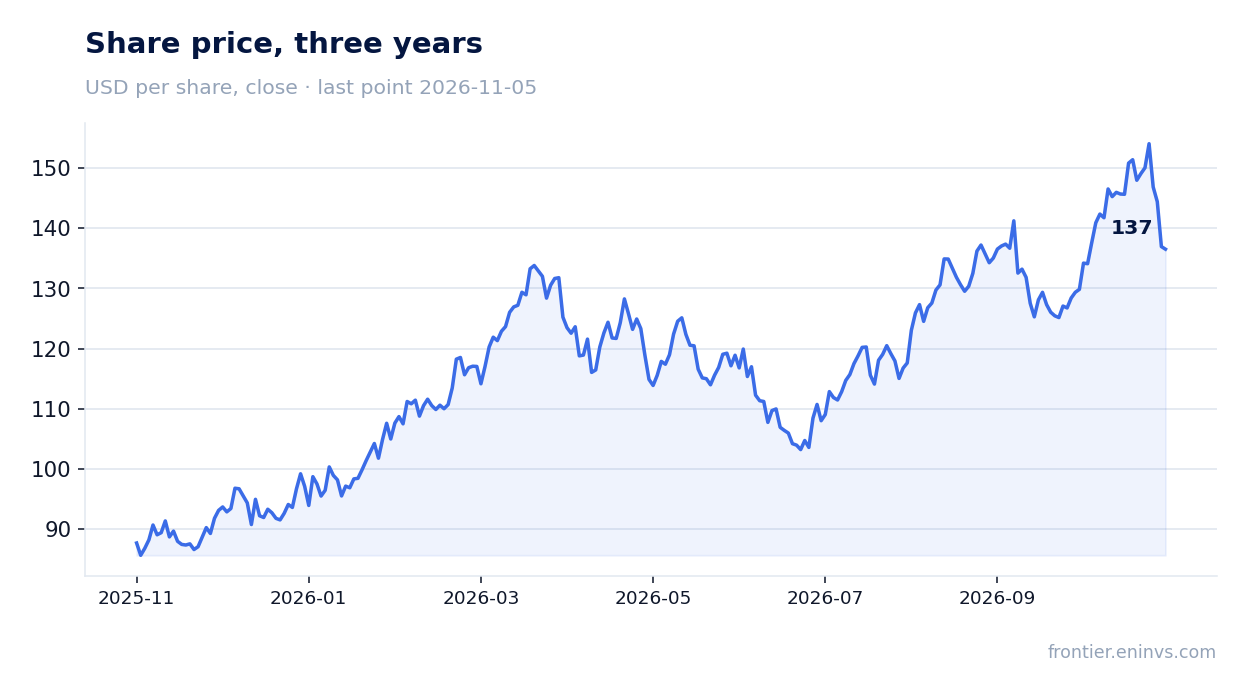
A multiple above history alongside profit that more than doubled means the market has already priced in part of the price gain. The reaction to the report was neutral: the share lost 0.3% on the publication day and a further 0.3% from then to 5 November.
Valuation on the latest reported figures
| Metric | Value |
|---|---|
| Market cap | 164 bn USD |
| P/E (LTM) | 14.2 |
| EV/EBITDA (LTM) | 6.8 |
| P/B | 2.54 |
| Net debt / EBITDA (LTM) | 0.58 |
| Operating cash flow (LTM) | 23.2 bn |
| ROE | 24.4% |
| Dividend yield (12m) | 2.5% |
| EV/EBITDA, 3-year average | 6.1 |
Bottom line
The strong side of the report remains cash flow: $7.2 bn from operations and $4.0 bn of free cash flow covered $3.4 bn of shareholder distributions, and the dividend was raised 11%. But the 2.3-fold profit increase is primarily the oil price plus a one-off tax reserve reversal, not business expansion: production fell by 97 MBOED. Debt rose over the quarter to $15.5 bn, though it fell by $1.7 bn over the year, and net debt to EBITDA of 0.58 remains moderate. The key question for a holder is whether the company can hold profit and distributions at a lower oil price, given that the 6.8 multiple is already above its own three-year average of 6.1. The verdict is neutral: strong cash flow and the dividend are balanced by a price above history and dependence on market conditions.
Open the company's financial profile COP →
See also: market overview · valuation map · stock screeners