Capital Power: revenue fell 32.8% but EBITDA rose 23.3% – the 48.9% margin rests on cost structure, not volume
Capital Power reported results for the third quarter of 2026. Revenue came in at USD 591.6 mn, down 32.8% year on year, while EBITDA rose 23.3% to USD 289.0 mn and net profit climbed 68.6% to USD 47.7 mn. The EBITDA margin widened to 48.9% from 26.6% a year earlier. With an EV/EBITDA of 13.4 against its own three-year average of 11.0 and a negative fair-value reading from the portal's model, the share looks unattractive at the current price despite a 4.4% dividend yield.
Key takeaways
— Revenue fell 32.8% year on year in the third quarter, a deceleration after 66.9% growth in the second quarter
— EBITDA rose 23.3% to USD 289.0 mn and its margin widened to 48.9% from 26.6% – profit growth on falling revenue
— Net profit increased 68.6% to USD 47.7 mn, but over the last twelve months it totals only USD 103.5 mn
— Leverage stands at 4.84x EBITDA – a level, not a trend – while net debt fell from USD 4.8 bn to 4.4 bn over the quarter
— Operating cash flow of USD 645.7 mn against capex of USD 457.0 mn leaves free cash flow positive but thin
— The 4.4% dividend yield rests on LTM profit of USD 103.5 mn
— EV/EBITDA of 13.4 is 22% above its own three-year average of 11.0 – the share is more expensive than its history
Attractiveness
Key figures, USD bn
| Metric | Q3 2025 | Q3 2026 | Change |
|---|---|---|---|
| Revenue | 0.88 | 0.59 | -32.8% |
| EBITDA | 0.23 | 0.29 | +23.3% |
| Operating profit | 0.12 | 0.14 | +17.6% |
| Net profit | 0.03 | 0.05 | +68.6% |
| Operating cash flow | 0.55 | 0.65 | +17.6% |
| EBITDA margin | 26.6% | 48.9% | +22.3 pp |
| Net margin | 3.2% | 8.1% | +4.9 pp |
Revenue fell 32.8% year on year in the third quarter, a deceleration after 66.9% growth in the second quarter
Revenue for the third quarter of 2026 was USD 591.6 mn, 32.8% below the same quarter a year earlier. In the second quarter revenue grew 66.9%, so the quarterly dynamic decelerated sharply. The reversal happened between two adjacent quarters: revenue was USD 532.2 mn in the second quarter and USD 591.6 mn in the third, so sequentially it actually rose, but the year-on-year base of the third quarter of 2025 was too high.
A year earlier the third quarter delivered USD 880.1 mn of revenue – the highest of any quarter in the table. That is the high base against which the decline was measured. The sequential rise from USD 532.2 mn in the second quarter to USD 591.6 mn in the third suggests the business is not contracting, and the year-on-year comparison is distorted by calendar and revenue mix.
For an investor the decline itself matters less than the fact that it was not accompanied by a fall in profit. Revenue fell 32.8% while EBITDA rose 23.3% – so a shift in the revenue and cost structure offset the loss of volume. What exactly changed in the revenue mix does not follow from the facts, and we do not claim it.
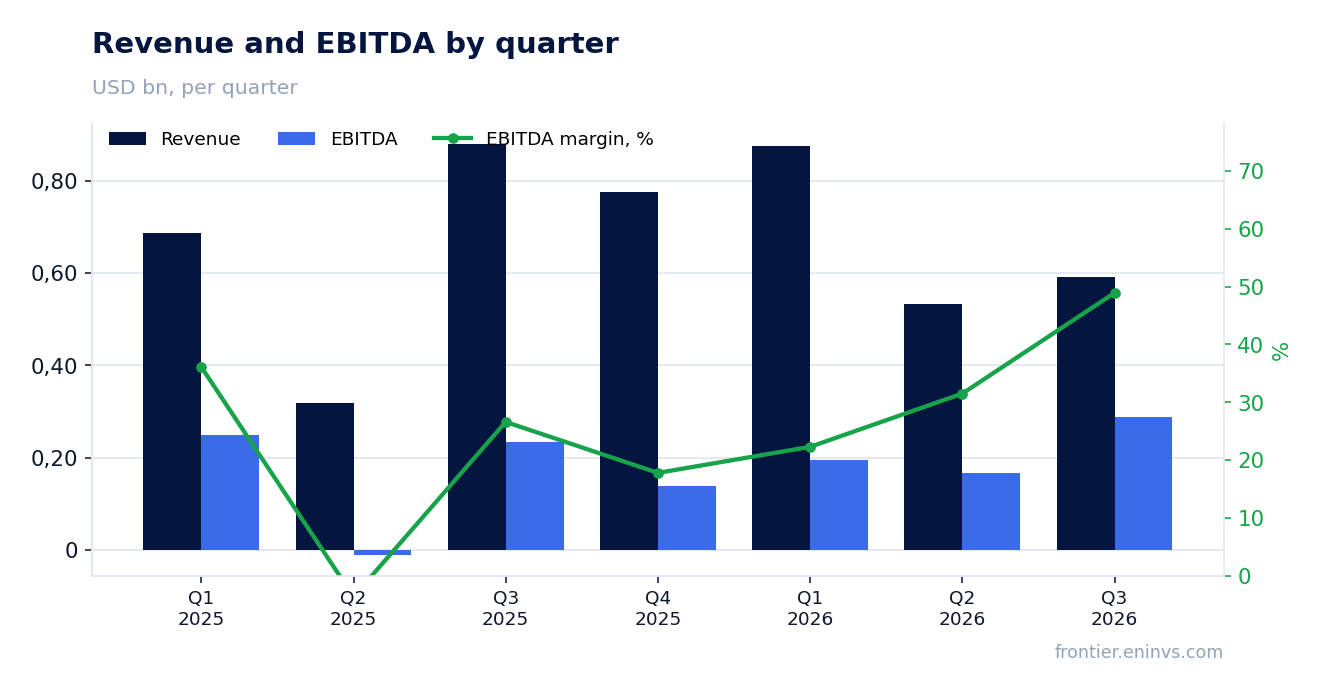
EBITDA rose 23.3% to USD 289.0 mn and its margin widened to 48.9% from 26.6% – profit growth on falling revenue
EBITDA for the third quarter was USD 289.0 mn, 23.3% more than a year earlier. On revenue of USD 591.6 mn the EBITDA margin reached 48.9% against 26.6% in the third quarter of 2025. This is a rare combination: revenue falls while profitability rises.
Operating profit was USD 141.7 mn on revenue of USD 591.6 mn, an operating margin of about 24%. The gap between EBITDA and operating profit is depreciation, which in the third quarter was around USD 147 mn. A high EBITDA margin alongside a more modest operating margin is typical of a capital-intensive business with a large fixed-asset base.
Margin growth on falling revenue means either variable costs fell faster than revenue or the share of more profitable items in revenue rose. The facts do not show which cost line produced the effect, so we record the result rather than name the cause. The sustainability of the 48.9% margin is the main question for the next report.
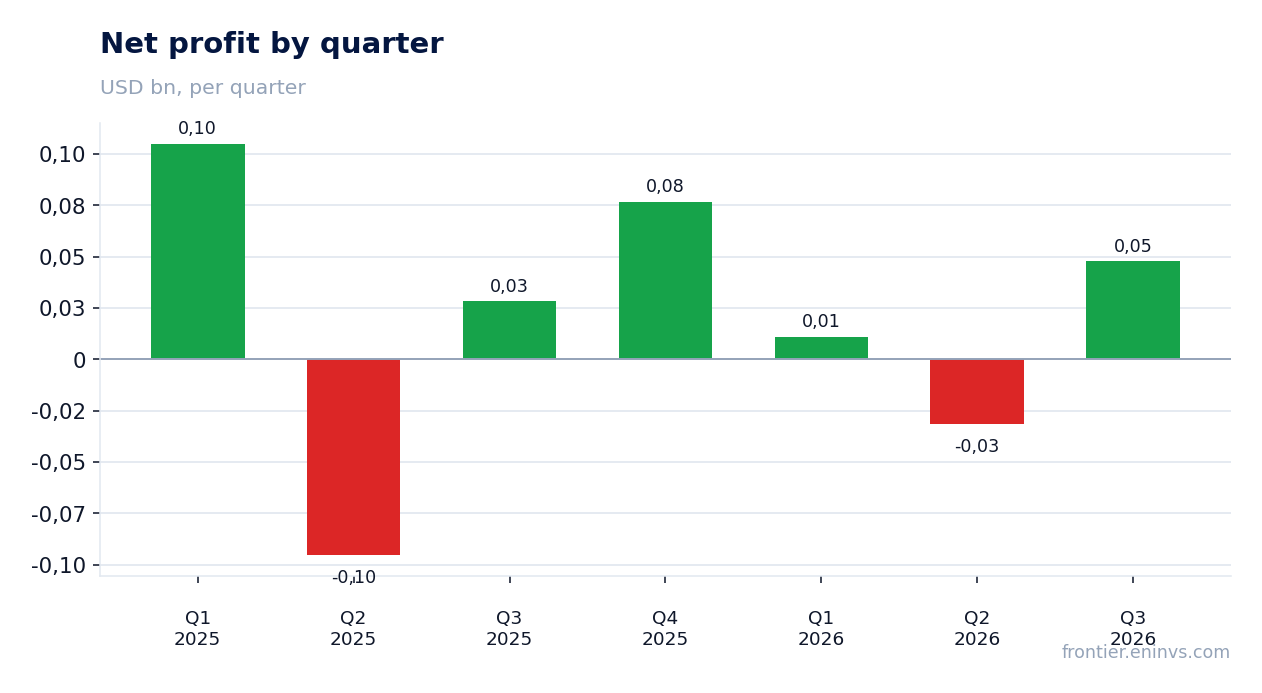
Net profit increased 68.6% to USD 47.7 mn, but over the last twelve months it totals only USD 103.5 mn
Net profit for the third quarter was USD 47.7 mn, 68.6% more than a year earlier. The net margin rose to 8.1% from 3.2%. Profit growth outpaced EBITDA growth, which means either a lower relative burden of interest and taxes or a one-off effect below the operating line.
Over the last twelve months net profit was USD 103.5 mn on revenue of USD 2,800.0 mn and EBITDA of USD 899.4 mn. The gap between quarterly and annual profit is explained by weak earlier quarters: the second quarter of 2026 posted a loss of USD 31.6 mn, and the first quarter delivered only USD 10.9 mn. The annual result rests on a strong third quarter.
With a market capitalisation of USD 7,181.6 mn and LTM profit of USD 103.5 mn, the price-to-earnings ratio is 69.4. That is a high multiple, which requires either a multiple increase in profit or a reduction through a lower price. Third-quarter profit annualised would give about USD 190 mn, but carrying a quarterly result over a full year without grounds is not valid.
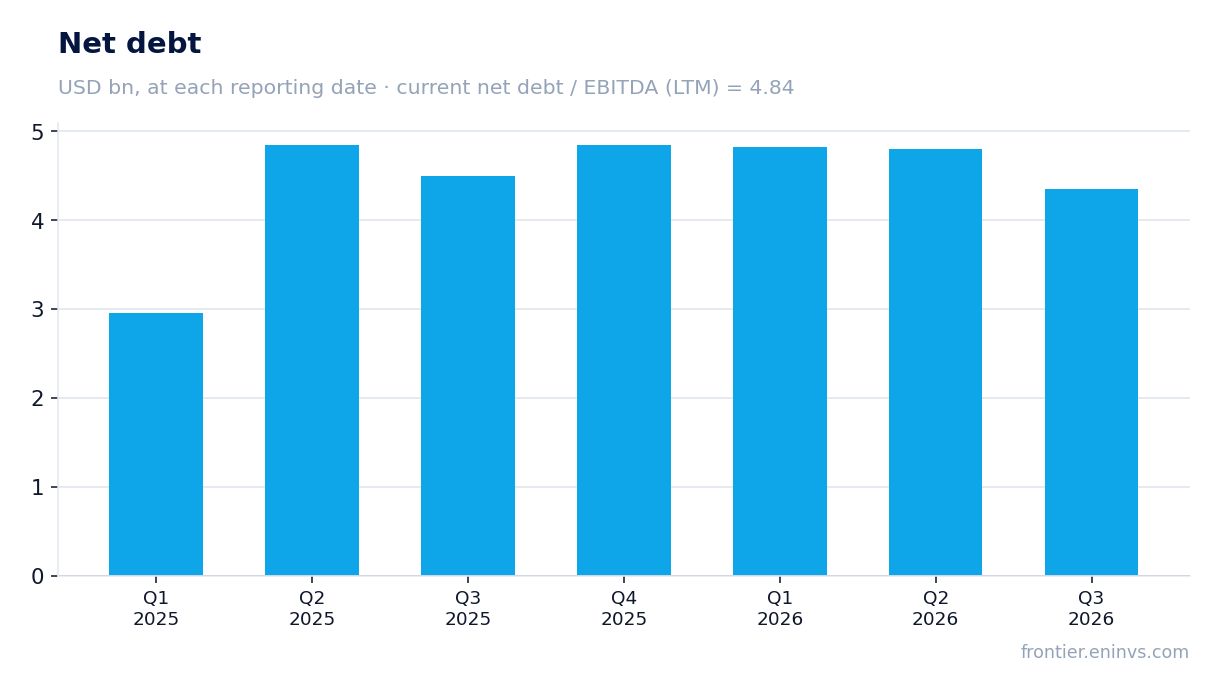
Leverage stands at 4.84x EBITDA – a level, not a trend – while net debt fell from USD 4.8 bn to 4.4 bn over the quarter
Net debt at 30 September 2026 was USD 4,352.4 mn, or USD 4.4 bn. Against 30 June 2026 it fell from USD 4.8 bn to USD 4.4 bn, a reduction of USD 0.4 bn over the quarter. Against 30 September 2025 the reduction was USD 0.1 bn – from USD 4.5 bn to USD 4.4 bn over roughly 12 months.
The ratio of net debt to LTM EBITDA is 4.84. That is a level, not a direction: the earlier value of this ratio is not in the facts, so we do not claim leverage rose or fell. Absolute debt declined over the quarter, but the ratio also depends on the denominator.
With LTM EBITDA of USD 899.4 mn, servicing USD 4.4 bn of debt requires a stable cash flow. Operating cash flow in the third quarter was strong at USD 645.7 mn, and that is what allowed debt to fall over the quarter. A level of 4.84x EBITDA remains high for a capital-intensive business and limits room on dividends and capex.
Operating cash flow of USD 645.7 mn against capex of USD 457.0 mn leaves free cash flow positive but thin
Operating cash flow for the third quarter was USD 645.7 mn, capex was USD 457.0 mn. The difference, about USD 188.7 mn, is free cash flow before dividends and interest. It is positive but thin relative to USD 4.4 bn of debt and a market capitalisation of USD 7.2 bn.
Capex in the third quarter was high: USD 457.0 mn against USD 151.8 mn in the second quarter and USD 191.9 mn in the first. Capex rising 2.4 times against the first quarter consumes a significant part of operating cash flow. Over the last twelve months operating cash flow was USD 1,019.7 mn – the resource that funds capex, dividends and debt service.
Free cash flow of USD 188.7 mn for the quarter would annualise to about USD 755 mn, but capex swings sharply quarter to quarter, so carrying the quarterly result over a year is not valid. The key question is whether operating cash flow stays above USD 600 mn with capex around USD 450 mn. If so, dividends and debt are serviced with a cushion.
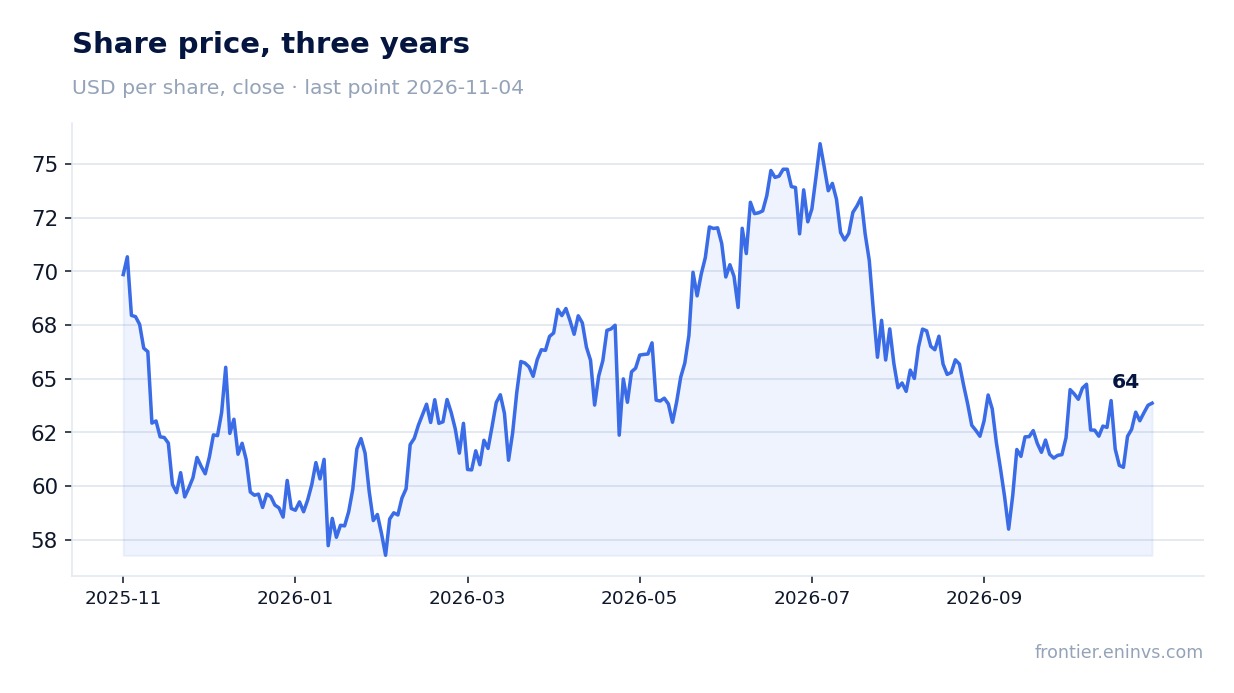
The 4.4% dividend yield rests on LTM profit of USD 103.5 mn
The trailing twelve-month dividend yield is 4.36%. On a market capitalisation of USD 7,181.6 mn that corresponds to payouts of about USD 313 mn a year. LTM profit is USD 103.5 mn, so payouts are roughly three times profit. Dividends are funded not only from profit but from operating cash flow, which over twelve months was USD 1,019.7 mn.
Our estimate for the current year's dividend assumes payouts stay at the level of the last twelve months – about USD 313 mn – provided operating cash flow stays above USD 1,000 mn and capex does not exceed USD 500 mn a quarter. The payout rests on cash flow rather than accounting profit, and that is the key condition.
A yield of 4.36% is comparable to the risk-free rate but offers no premium for risk given debt of 4.84x EBITDA and a price-to-earnings multiple of 69.4. If operating cash flow falls or capex rises, the payout may be cut. For a holder the dividend is the main argument in favour of the share, but it does not offset the richness on multiples.
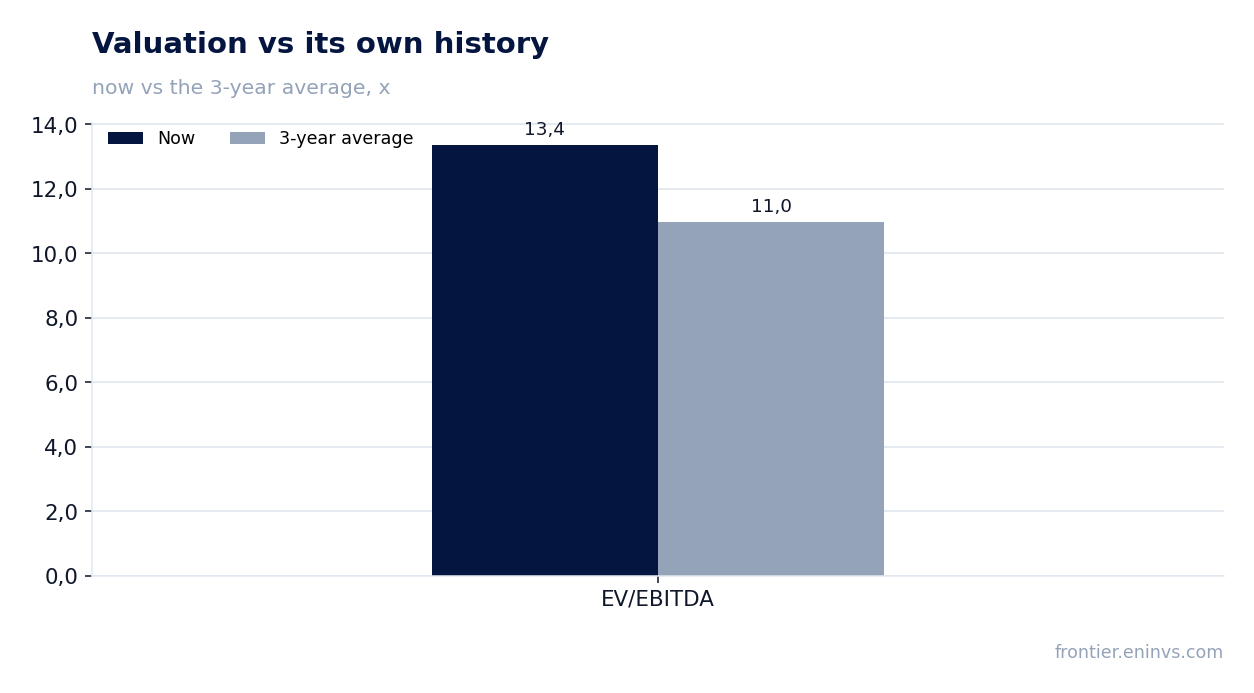
EV/EBITDA of 13.4 is 22% above its own three-year average of 11.0 – the share is more expensive than its history
LTM EV/EBITDA is 13.4 against its own three-year average of 11.0. The share trades 22% above its history on this multiple. This is not a comparison with a sector or peers – only with its own three-year average.
On the portal's model, where EBITDA is re-priced to current commodity prices at the target EV/EBITDA, the share's upside to fair value is minus 82%. This is our own estimate, not a market consensus and not a target price. It indicates that at current commodity prices profit does not justify the USD 7,181.6 mn market capitalisation.
The LTM price-to-earnings ratio is 69.4. With profit of USD 103.5 mn and a market capitalisation of USD 7.2 bn, the market is paying for profit that was largely shaped by one strong quarter. If third-quarter profit is sustainable, the multiple will normalise over time; if not, the current valuation has no support.
Valuation on the latest reported figures
| Metric | Value |
|---|---|
| Market cap | 7.18 bn USD |
| P/E (LTM) | 69.4 |
| EV/EBITDA (LTM) | 13.4 |
| P/B | 2.02 |
| Net debt / EBITDA (LTM) | 4.84 |
| Operating cash flow (LTM) | 1.02 bn |
| ROE | 5.7% |
| Dividend yield (12m) | 4.4% |
| EV/EBITDA, 3-year average | 11.0 |
Bottom line
The strong side of the report was EBITDA growth of 23.3% and net profit growth of 68.6% on a 32.8% revenue decline – the business showed it can earn on lower volume. However, the 48.9% margin rests on a cost structure the facts do not reveal, and its sustainability is the main question. Debt of 4.84x EBITDA and quarterly capex of USD 457.0 mn constrain free cash flow, while the 4.4% dividend yield rests on payouts three times LTM profit. With EV/EBITDA of 13.4 against its own average of 11.0 and minus 82% upside on the portal's model, the share looks unattractive at the current price.
Open the company's financial profile CPX →
See also: market overview · valuation map · stock screeners