Cresco Labs: cannabis price slipped while electricity jumped 1.6x – EBITDA collapsed 70.3%
Contents
On 11 November Cresco Labs reported third-quarter 2026 results. The average cannabis price in the period was 1064 USD against 1094 USD a year earlier (–2.8%), while electricity, which the company buys, rose to 102.8 USD from 62.9 USD (+63.3%). At those prices and costs revenue should have been 160.4 mln USD and EBITDA 25.1 mln USD; in fact revenue reached 172.8 mln USD, but EBITDA was only 10.35 mln USD at a 6.0% margin versus 21.2% a year earlier. Our conclusion: rather attractive – the portal model puts the upside to fair value at +71%, although weak reported EBITDA and net debt of 3.59 EBITDA noticeably limit that headroom. Our view: the share is rather attractive at the current price; upside on the portal model +71%.
Our view: is there upside
Our view in numbers
| Metric | Our read |
|---|---|
| Verdict | Rather attractive |
| Upside on the portal model | +71% |
| How the model works | spot model: EBITDA re-priced to current commodity prices at the target EV/EBITDA, against market cap |
| Net debt / EBITDA | 3.59 – high leverage |
| Strongest case for | At today's prices the portal model gives annual EBITDA of 156.4 mln USD against 115.9 mln USD LTM and an upside of +71%. |
| Strongest case against | Reported EBITDA fell 70.3% to 10.35 mln USD at a 6.0% margin, and net debt of 420.5 mln USD equals 3.59 LTM EBITDA. |
| What would change the view | If the cannabis spot price holds above 1153 USD while electricity stays near 63.9 USD, the verdict would move one step up toward attractive. |
Key takeaways
— The cannabis price fell 2.8% over the year to 1064 USD, while spot is now 1153 USD – 8.3% above the reported-period average
— At year-ago prices our calculation puts EBITDA at 25.1 mln USD against 10.35 mln USD reported, and the 14.8 mln USD gap is not explained by price alone
— Revenue of 172.8 mln USD came in 12.4 mln USD above the price-implied level, so volumes or sales mix outweighed the price decline
— Electricity rose 63.3% year on year to 102.8 USD, and at a 5% share of revenue that consumed about 5.2 mln USD of EBITDA
— The EBITDA margin compressed to 6.0% from 21.2%, while the net margin stayed negative at –7.2%
— Net debt of 420.5 mln USD equals 3.59 LTM EBITDA, and at current prices the ratio falls to 2.69
— On the portal model, annual EBITDA at today's prices is 156.4 mln USD against 115.9 mln USD LTM, with EV/EBITDA at 4.0
Key figures, USD bn
| Metric | Q3 2025 | Q3 2026 | Change |
|---|---|---|---|
| Revenue | 0.16 | 0.17 | +4.8% |
| EBITDA | 0.03 | 0.01 | -70.3% |
| Operating profit | 0.02 | 0.01 | -47.2% |
| Net profit | -0.02 | -0.01 | — |
| Operating cash flow | 0.01 | — | — |
| Capex | 0.01 | — | — |
| EBITDA margin | 21.2% | 6.0% | -15.2 pp |
| Net margin | -10.3% | -7.2% | +3.1 pp |
The cannabis price fell 2.8% over the year to 1064 USD, while spot is now 1153 USD – 8.3% above the reported-period average
The average cannabis price in the third quarter of 2026 was 1064 USD against 1094 USD a year earlier – a decline of 2.8%. Against the previous quarter the price rose 2.3%: it was 1040 USD in the second quarter.
Spot on 11 November is 1153 USD, 8.3% above the reported-period average. For a producer this is the key reference point: next quarter's revenue and margin will be calculated from a higher price if it holds.
Commodity prices: period average and now
| Benchmark | Year ago | Q3 2026 | YoY | Spot 2026-11-11 |
|---|---|---|---|---|
| Cannabis Spot Index, USD | 1 094 | 1 064 | -2,8% | 1 153 |
| Electricity Spot (input cost), USD | 62,9 | 102,8 | +63,3% | 63,9 |
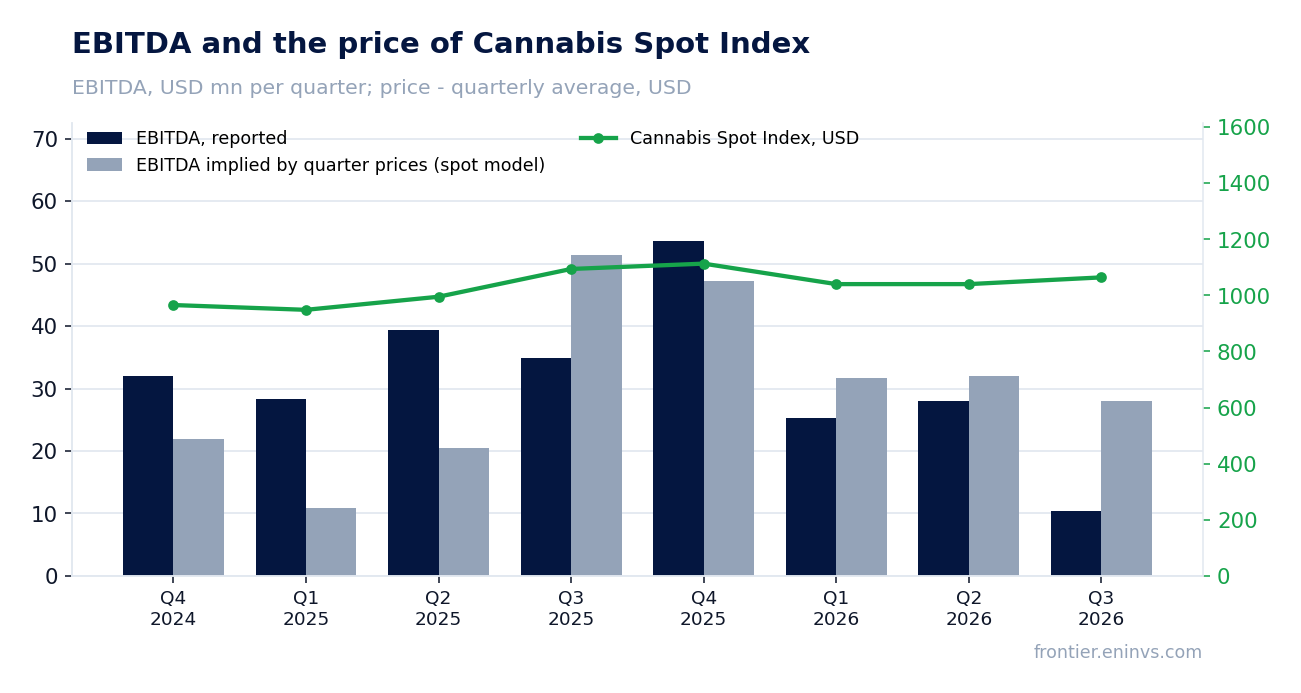
At year-ago prices our calculation puts EBITDA at 25.1 mln USD against 10.35 mln USD reported, and the 14.8 mln USD gap is not explained by price alone
Holding third-quarter 2025 volumes and non-commodity costs and moving only prices, revenue would have been 160.4 mln USD and EBITDA 25.1 mln USD. In fact revenue reached 172.8 mln USD, 12.4 mln USD above the reference, while EBITDA was only 10.35 mln USD, 14.8 mln USD below.
The cannabis price effect subtracts 4.5 mln USD from revenue, while costlier electricity adds 5.2 mln USD to costs. Together they explain about 9.7 mln USD of the 14.8 mln USD EBITDA gap. The rest comes from volumes and sales mix: revenue is above the reference but earns less profit per unit.
The portal's spot model, built from the average prices of the previous four quarters, expected EBITDA of 28 mln USD and revenue of 161.1 mln USD. Reported EBITDA is 63.1% below the model, and this is already the fourth consecutive quarter in which actuals diverge from the model: deviations in the prior periods were –32.1%, +13.7%, –20.2% and –17.0%.
What the prices implied and what the company earned
| Base (Q3 2025) | Implied at period prices | Reported | Reported vs implied | |
|---|---|---|---|---|
| Revenue, USD mn | 164,9 | 160,4 | 172,8 | +7,7% |
| EBITDA, USD mn | 34,9 | 25,1 | 10,3 | -58,8% |
| EBITDA, portal spot model, USD mn | — | 28,0 | 10,3 | -63,1% |
Revenue and EBITDA by quarter
| Period | Measure | bn USD |
|---|---|---|
| Q4 2024 | Revenue | 0.17991200000000002 |
| Q1 2025 | Revenue | 0.16575700000000002 |
| Q2 2025 | Revenue | 0.163624 |
| Q3 2025 | Revenue | 0.164913 |
| Q4 2025 | Revenue | 0.161553 |
| Q1 2026 | Revenue | 0.151325 |
| Q2 2026 | Revenue | 0.173341 |
| Q3 2026 | Revenue | 0.17278200000000002 |
| Q4 2024 | EBITDA | 0.03208 |
| Q1 2025 | EBITDA | 0.028287 |
| Q2 2025 | EBITDA | 0.039445 |
| Q3 2025 | EBITDA | 0.034899 |
| Q4 2025 | EBITDA | 0.053704 |
| Q1 2026 | EBITDA | 0.025277 |
| Q2 2026 | EBITDA | 0.027982 |
| Q3 2026 | EBITDA | 0.01035 |
EBITDA margin
| Period | Measure | % |
|---|---|---|
| Q4 2024 | EBITDA margin | 17.8 |
| Q1 2025 | EBITDA margin | 17.1 |
| Q2 2025 | EBITDA margin | 24.1 |
| Q3 2025 | EBITDA margin | 21.2 |
| Q4 2025 | EBITDA margin | 33.2 |
| Q1 2026 | EBITDA margin | 16.7 |
| Q2 2026 | EBITDA margin | 16.1 |
| Q3 2026 | EBITDA margin | 6.0 |
Revenue of 172.8 mln USD came in 12.4 mln USD above the price-implied level, so volumes or sales mix outweighed the price decline
Third-quarter 2026 revenue was 172.8 mln USD, up 4.8% year on year. That is a deceleration from the second quarter, when growth was 5.9%.
The 12.4 mln USD excess over the price-implied level means the company sold more volume or shifted sales toward higher-priced products. That is what kept revenue in positive territory while the cannabis price fell.
Against the previous quarter revenue barely moved: 172.8 mln USD versus 173.3 mln USD. The price-implied level from second-quarter volumes was 177.4 mln USD, so actuals are 4.6 mln USD below it.
Electricity rose 63.3% year on year to 102.8 USD, and at a 5% share of revenue that consumed about 5.2 mln USD of EBITDA
Electricity is a key purchased input for a cannabis producer: in the portal model its share of revenue is 5%. The average price in the reported period was 102.8 USD against 62.9 USD a year earlier, up 63.3%. Against the previous quarter the increase is even sharper: 102.8 USD versus 73.2 USD, up 40.5%.
Our calculation puts the cost increase at 5.2 mln USD, directly reducing EBITDA. Spot on 27 October is 63.9 USD, 37.8% below the reported-period average, so next quarter's electricity costs should fall if the price holds.
The EBITDA margin compressed to 6.0% from 21.2%, while the net margin stayed negative at –7.2%
Reported-period EBITDA was 10.35 mln USD, down 70.3% year on year. The margin fell to 6.0% from 21.2%. Operating profit remained positive at 10.662 mln USD, so the pressure on EBITDA comes from costs rather than operating write-offs.
The net loss was 12.441 mln USD at a net margin of –7.2% versus –10.3% a year earlier. The loss is smaller than a year ago but still significant: interest on debt and depreciation absorb the positive operating profit.
Net debt of 420.5 mln USD equals 3.59 LTM EBITDA, and at current prices the ratio falls to 2.69
Net debt at 30 September 2026 was 420.5 mln USD. The ratio to LTM EBITDA is 3.59. This is a level without a direction: the facts contain no earlier value for comparison.
At today's cannabis and electricity prices the portal model gives annual EBITDA of 156.4 mln USD against 115.9 mln USD LTM. On that base net debt to EBITDA is 2.69 and EV/EBITDA is 4.0. That base matters more for valuation: LTM was earned at past prices, while spot is now higher.
Share price, three years
close, last point 2026-11-10
| Period | Measure | USD per share |
|---|---|---|
| 2025-11-10 | Closing price | 1.2300000190734863 |
| 2025-11-11 | Closing price | 1.2100000381469727 |
| 2025-11-12 | Closing price | 1.159999966621399 |
| 2025-11-13 | Closing price | 1.0700000524520874 |
| 2025-11-14 | Closing price | 0.9660000205039978 |
| 2025-11-17 | Closing price | 0.8949999809265137 |
| 2025-11-18 | Closing price | 0.8029999732971191 |
| 2025-11-19 | Closing price | 0.7099999785423279 |
| 2025-11-20 | Closing price | 0.6899999976158142 |
| 2025-11-21 | Closing price | 0.7929999828338623 |
| 2025-11-24 | Closing price | 0.7760000228881836 |
| 2025-11-25 | Closing price | 0.7649999856948853 |
| 2025-11-26 | Closing price | 0.7680000066757202 |
| 2025-11-28 | Closing price | 0.7649999856948853 |
| 2025-12-01 | Closing price | 0.8629999756813049 |
| 2025-12-02 | Closing price | 0.8360000252723694 |
| 2025-12-03 | Closing price | 0.8159999847412109 |
| 2025-12-04 | Closing price | 0.8700000047683716 |
| 2025-12-05 | Closing price | 0.8040000200271606 |
| 2025-12-08 | Closing price | 0.7599999904632568 |
| 2025-12-09 | Closing price | 0.7860000133514404 |
| 2025-12-10 | Closing price | 0.7599999904632568 |
| 2025-12-11 | Closing price | 0.7789999842643738 |
| 2025-12-12 | Closing price | 1.4299999475479126 |
| 2025-12-15 | Closing price | 1.2999999523162842 |
| 2025-12-16 | Closing price | 1.753999948501587 |
| 2025-12-17 | Closing price | 1.9160000085830688 |
| 2025-12-18 | Closing price | 1.2000000476837158 |
| 2025-12-19 | Closing price | 1.2999999523162842 |
| 2025-12-22 | Closing price | 1.1729999780654907 |
| 2025-12-23 | Closing price | 1.25 |
| 2025-12-24 | Closing price | 1.2799999713897705 |
| 2025-12-26 | Closing price | 1.25 |
| 2025-12-29 | Closing price | 1.1699999570846558 |
| 2025-12-30 | Closing price | 1.2200000286102295 |
| 2025-12-31 | Closing price | 1.2300000190734863 |
| 2026-01-02 | Closing price | 1.2599999904632568 |
| 2026-01-05 | Closing price | 1.2039999961853027 |
| 2026-01-06 | Closing price | 1.190000057220459 |
| 2026-01-07 | Closing price | 1.2000000476837158 |
| 2026-01-08 | Closing price | 1.2799999713897705 |
| 2026-01-09 | Closing price | 1.2400000095367432 |
| 2026-01-12 | Closing price | 1.3899999856948853 |
| 2026-01-13 | Closing price | 1.3200000524520874 |
| 2026-01-14 | Closing price | 1.3600000143051147 |
| 2026-01-15 | Closing price | 1.3600000143051147 |
| 2026-01-16 | Closing price | 1.2799999713897705 |
| 2026-01-20 | Closing price | 1.2000000476837158 |
| 2026-01-21 | Closing price | 1.1799999475479126 |
| 2026-01-22 | Closing price | 1.190000057220459 |
| 2026-01-23 | Closing price | 1.25 |
| 2026-01-26 | Closing price | 1.190000057220459 |
| 2026-01-27 | Closing price | 1.1299999952316284 |
| 2026-01-28 | Closing price | 1.090000033378601 |
| 2026-01-29 | Closing price | 1.0499999523162842 |
| 2026-01-30 | Closing price | 1.0399999618530273 |
| 2026-02-02 | Closing price | 1.0399999618530273 |
| 2026-02-03 | Closing price | 1.059999942779541 |
| 2026-02-04 | Closing price | 1.090000033378601 |
| 2026-02-05 | Closing price | 1.0099999904632568 |
| 2026-02-06 | Closing price | 1.0549999475479126 |
| 2026-02-09 | Closing price | 1.0820000171661377 |
| 2026-02-10 | Closing price | 1.0299999713897705 |
| 2026-02-11 | Closing price | 1.0099999904632568 |
| 2026-02-12 | Closing price | 0.9700000286102295 |
| 2026-02-13 | Closing price | 1.0099999904632568 |
| 2026-02-17 | Closing price | 1.0099999904632568 |
| 2026-02-18 | Closing price | 0.9700000286102295 |
| 2026-02-19 | Closing price | 1.1100000143051147 |
| 2026-02-20 | Closing price | 0.9599999785423279 |
| 2026-02-23 | Closing price | 0.949999988079071 |
| 2026-02-24 | Closing price | 1.0199999809265137 |
| 2026-02-25 | Closing price | 1.0290000438690186 |
| 2026-02-26 | Closing price | 1.0399999618530273 |
| 2026-02-27 | Closing price | 0.9900000095367432 |
| 2026-03-02 | Closing price | 0.9120000004768372 |
| 2026-03-03 | Closing price | 0.9350000023841858 |
| 2026-03-04 | Closing price | 0.9750000238418579 |
| 2026-03-05 | Closing price | 0.9300000071525574 |
| 2026-03-06 | Closing price | 1.0499999523162842 |
| 2026-03-09 | Closing price | 1.0199999809265137 |
| 2026-03-10 | Closing price | 0.9399999976158142 |
| 2026-03-11 | Closing price | 0.9919999837875366 |
| 2026-03-12 | Closing price | 0.9520000219345093 |
| 2026-03-13 | Closing price | 0.9750000238418579 |
| 2026-03-16 | Closing price | 0.9700000286102295 |
| 2026-03-17 | Closing price | 0.9700000286102295 |
| 2026-03-18 | Closing price | 0.9639999866485596 |
| 2026-03-19 | Closing price | 1.0099999904632568 |
| 2026-03-20 | Closing price | 0.9100000262260437 |
| 2026-03-23 | Closing price | 0.9990000128746033 |
| 2026-03-24 | Closing price | 0.9779999852180481 |
| 2026-03-25 | Closing price | 0.9639999866485596 |
| 2026-03-26 | Closing price | 0.8999999761581421 |
| 2026-03-27 | Closing price | 0.8360000252723694 |
| 2026-03-30 | Closing price | 0.7799999713897705 |
| 2026-03-31 | Closing price | 0.8700000047683716 |
| 2026-04-01 | Closing price | 0.9190000295639038 |
| 2026-04-02 | Closing price | 0.9649999737739563 |
| 2026-04-06 | Closing price | 1.0 |
| 2026-04-07 | Closing price | 0.9010000228881836 |
| 2026-04-08 | Closing price | 0.9620000123977661 |
| 2026-04-09 | Closing price | 0.949999988079071 |
| 2026-04-10 | Closing price | 0.9110000133514404 |
| 2026-04-13 | Closing price | 0.9200000166893005 |
| 2026-04-14 | Closing price | 0.9240000247955322 |
| 2026-04-15 | Closing price | 0.9750000238418579 |
| 2026-04-16 | Closing price | 0.9350000023841858 |
| 2026-04-17 | Closing price | 0.9369999766349792 |
| 2026-04-20 | Closing price | 0.9900000095367432 |
| 2026-04-21 | Closing price | 0.949999988079071 |
| 2026-04-22 | Closing price | 1.1799999475479126 |
| 2026-04-23 | Closing price | 0.9300000071525574 |
| 2026-04-24 | Closing price | 1.0 |
| 2026-04-27 | Closing price | 1.190000057220459 |
| 2026-04-28 | Closing price | 1.0800000429153442 |
| 2026-04-29 | Closing price | 1.0099999904632568 |
| 2026-04-30 | Closing price | 1.090000033378601 |
| 2026-05-01 | Closing price | 1.090000033378601 |
| 2026-05-04 | Closing price | 1.0199999809265137 |
| 2026-05-05 | Closing price | 1.093999981880188 |
| 2026-05-06 | Closing price | 1.100000023841858 |
| 2026-05-07 | Closing price | 1.100000023841858 |
| 2026-05-08 | Closing price | 1.0299999713897705 |
| 2026-05-11 | Closing price | 1.0069999694824219 |
| 2026-05-12 | Closing price | 0.949999988079071 |
| 2026-05-13 | Closing price | 0.9399999976158142 |
| 2026-05-14 | Closing price | 0.9390000104904175 |
| 2026-05-15 | Closing price | 0.8460000157356262 |
| 2026-05-18 | Closing price | 0.8949999809265137 |
| 2026-05-19 | Closing price | 0.8209999799728394 |
| 2026-05-20 | Closing price | 0.8799999952316284 |
| 2026-05-21 | Closing price | 0.9079999923706055 |
| 2026-05-22 | Closing price | 0.8600000143051147 |
| 2026-05-26 | Closing price | 0.9100000262260437 |
| 2026-05-27 | Closing price | 0.8980000019073486 |
| 2026-05-28 | Closing price | 0.9599999785423279 |
| 2026-05-29 | Closing price | 0.9169999957084656 |
| 2026-06-01 | Closing price | 0.949999988079071 |
| 2026-06-02 | Closing price | 0.9139999747276306 |
| 2026-06-03 | Closing price | 0.8690000176429749 |
| 2026-06-04 | Closing price | 0.906000018119812 |
| 2026-06-05 | Closing price | 0.9039999842643738 |
| 2026-06-08 | Closing price | 0.949999988079071 |
| 2026-06-09 | Closing price | 0.8999999761581421 |
| 2026-06-10 | Closing price | 0.8799999952316284 |
| 2026-06-11 | Closing price | 0.8500000238418579 |
| 2026-06-12 | Closing price | 0.8199999928474426 |
| 2026-06-15 | Closing price | 0.8240000009536743 |
| 2026-06-16 | Closing price | 0.8199999928474426 |
| 2026-06-17 | Closing price | 0.8009999990463257 |
| 2026-06-18 | Closing price | 0.8100000023841858 |
| 2026-06-22 | Closing price | 0.7699999809265137 |
| 2026-06-23 | Closing price | 0.7699999809265137 |
| 2026-06-24 | Closing price | 0.7730000019073486 |
| 2026-06-25 | Closing price | 0.824999988079071 |
| 2026-06-26 | Closing price | 0.8100000023841858 |
| 2026-06-29 | Closing price | 0.8109999895095825 |
| 2026-06-30 | Closing price | 0.8299999833106995 |
| 2026-07-01 | Closing price | 0.7799999713897705 |
| 2026-07-02 | Closing price | 0.8199999928474426 |
| 2026-07-06 | Closing price | 0.7699999809265137 |
| 2026-07-07 | Closing price | 0.7749999761581421 |
| 2026-07-08 | Closing price | 0.7910000085830688 |
| 2026-07-09 | Closing price | 0.7699999809265137 |
| 2026-07-10 | Closing price | 0.7599999904632568 |
| 2026-07-13 | Closing price | 0.800000011920929 |
| 2026-07-14 | Closing price | 0.7829999923706055 |
| 2026-07-15 | Closing price | 0.7699999809265137 |
| 2026-07-16 | Closing price | 0.7400000095367432 |
| 2026-07-17 | Closing price | 0.75 |
| 2026-07-20 | Closing price | 0.7170000076293945 |
| 2026-07-21 | Closing price | 0.7120000123977661 |
| 2026-07-22 | Closing price | 0.7120000123977661 |
| 2026-07-23 | Closing price | 0.7099999785423279 |
| 2026-07-24 | Closing price | 0.6809999942779541 |
| 2026-07-27 | Closing price | 0.6679999828338623 |
| 2026-07-28 | Closing price | 0.6380000114440918 |
| 2026-07-29 | Closing price | 0.6420000195503235 |
| 2026-07-30 | Closing price | 0.6729999780654907 |
| 2026-07-31 | Closing price | 0.6420000195503235 |
| 2026-08-03 | Closing price | 0.6800000071525574 |
| 2026-08-04 | Closing price | 0.699999988079071 |
| 2026-08-05 | Closing price | 0.6570000052452087 |
| 2026-08-06 | Closing price | 0.7200000286102295 |
| 2026-08-07 | Closing price | 0.7450000047683716 |
| 2026-08-10 | Closing price | 0.7279999852180481 |
| 2026-08-11 | Closing price | 0.7799999713897705 |
| 2026-08-12 | Closing price | 0.7699999809265137 |
| 2026-08-13 | Closing price | 0.7979999780654907 |
| 2026-08-14 | Closing price | 0.7710000276565552 |
| 2026-08-17 | Closing price | 0.7900000214576721 |
| 2026-08-18 | Closing price | 0.800000011920929 |
| 2026-08-19 | Closing price | 0.8159999847412109 |
| 2026-08-20 | Closing price | 0.7979999780654907 |
| 2026-08-21 | Closing price | 0.8199999928474426 |
| 2026-08-24 | Closing price | 0.7799999713897705 |
| 2026-08-25 | Closing price | 0.7649999856948853 |
| 2026-08-26 | Closing price | 0.7400000095367432 |
| 2026-08-27 | Closing price | 0.7350000143051147 |
| 2026-08-28 | Closing price | 0.7730000019073486 |
| 2026-08-31 | Closing price | 0.7799999713897705 |
| 2026-09-01 | Closing price | 0.75 |
| 2026-09-02 | Closing price | 0.7839999794960022 |
| 2026-09-03 | Closing price | 0.7409999966621399 |
| 2026-09-04 | Closing price | 0.7799999713897705 |
| 2026-09-08 | Closing price | 0.7599999904632568 |
| 2026-09-09 | Closing price | 0.7599999904632568 |
| 2026-09-10 | Closing price | 0.7279999852180481 |
| 2026-09-11 | Closing price | 0.7129999995231628 |
| 2026-09-14 | Closing price | 0.7419999837875366 |
| 2026-09-15 | Closing price | 0.7400000095367432 |
| 2026-09-16 | Closing price | 0.7300000190734863 |
| 2026-09-17 | Closing price | 0.7289999723434448 |
| 2026-09-18 | Closing price | 0.75 |
| 2026-09-21 | Closing price | 0.7400000095367432 |
| 2026-09-22 | Closing price | 0.7900000214576721 |
| 2026-09-23 | Closing price | 0.777999997138977 |
| 2026-09-24 | Closing price | 0.75 |
| 2026-09-25 | Closing price | 0.7639999985694885 |
| 2026-09-28 | Closing price | 0.7599999904632568 |
| 2026-09-29 | Closing price | 0.7300000190734863 |
| 2026-09-30 | Closing price | 0.6389999985694885 |
| 2026-10-01 | Closing price | 0.6600000262260437 |
| 2026-10-02 | Closing price | 0.6700000166893005 |
| 2026-10-05 | Closing price | 0.6299999952316284 |
| 2026-10-06 | Closing price | 0.6399999856948853 |
| 2026-10-07 | Closing price | 0.6449999809265137 |
| 2026-10-08 | Closing price | 0.6359999775886536 |
| 2026-10-09 | Closing price | 0.6439999938011169 |
| 2026-10-12 | Closing price | 0.6389999985694885 |
| 2026-10-13 | Closing price | 0.6259999871253967 |
| 2026-10-14 | Closing price | 0.6299999952316284 |
| 2026-10-15 | Closing price | 0.6200000047683716 |
| 2026-10-16 | Closing price | 0.5950000286102295 |
| 2026-10-19 | Closing price | 0.5759999752044678 |
| 2026-10-20 | Closing price | 0.6190000176429749 |
| 2026-10-21 | Closing price | 0.6600000262260437 |
| 2026-10-22 | Closing price | 0.6349999904632568 |
| 2026-10-23 | Closing price | 0.6000000238418579 |
| 2026-10-26 | Closing price | 0.6169999837875366 |
| 2026-10-27 | Closing price | 0.6129999756813049 |
| 2026-10-28 | Closing price | 0.6129999756813049 |
| 2026-10-29 | Closing price | 0.6299999952316284 |
| 2026-10-30 | Closing price | 0.5730000138282776 |
| 2026-11-02 | Closing price | 0.6000000238418579 |
| 2026-11-03 | Closing price | 0.625 |
| 2026-11-04 | Closing price | 0.5929999947547913 |
| 2026-11-05 | Closing price | 0.5690000057220459 |
| 2026-11-06 | Closing price | 0.5559999942779541 |
| 2026-11-09 | Closing price | 0.531000018119812 |
| 2026-11-10 | Closing price | 0.550000011920929 |
On the portal model, annual EBITDA at today's prices is 156.4 mln USD against 115.9 mln USD LTM, with EV/EBITDA at 4.0
LTM EV/EBITDA is 5.27 on a market capitalisation of 197.7 mln USD. At today's prices the multiple falls to 4.0 because the earnings base is higher. For a commodity producer this is the key reference: the market pays for future earnings at the current price, not for past ones.
The portal model re-prices EBITDA to current prices at the target multiple and gives an upside to fair value of +71%. This is our own estimate, not a market consensus.
Return on equity is negative at –14.0%. While the company is loss-making on net profit, valuation rests on operating EBITDA and on how sustainably current prices stay above the reported-period averages.
Valuation on the latest reported figures
| Metric | Value |
|---|---|
| Market cap | 0.20 bn USD |
| EV/EBITDA (LTM) | 5.3 |
| P/B | 0.57 |
| Net debt / EBITDA (LTM) | 3.59 |
| ROE | -14.0% |
Net profit by quarter
| Period | Measure | bn USD |
|---|---|---|
| Q4 2024 | Net profit | −0.004395 |
| Q1 2025 | Net profit | −0.014432 |
| Q2 2025 | Net profit | −0.016334 |
| Q3 2025 | Net profit | −0.017054 |
| Q4 2025 | Net profit | −0.087588 |
| Q1 2026 | Net profit | −0.013071999999999999 |
| Q2 2026 | Net profit | 0.016796 |
| Q3 2026 | Net profit | −0.012441 |
Bottom line
The strong side of the report remains revenue: 172.8 mln USD, 12.4 mln USD above the price-implied level, meaning volumes and sales mix outweighed the 2.8% decline in the cannabis price. The weakness is in costs and margin: electricity rose 63.3%, EBITDA fell to 10.35 mln USD and the margin to 6.0%. A net loss of 12.4 mln USD and net debt at 3.59 LTM EBITDA show that the margin of safety rests on price, not on profit. At today's prices the portal model gives EBITDA of 156.4 mln USD and EV/EBITDA of 4.0, with an upside of +71%. Our conclusion: rather attractive – the model's +71% upside outweighs weak reported EBITDA, but it materialises only if the cannabis spot price holds above 1064 USD and electricity costs come down. Our view: the share is rather attractive at the current price; upside on the portal model +71%.