Curaleaf Holdings: revenue accelerated to +10.1%, but EBITDA fell and net debt rose to $0.9bn
On 3 November Curaleaf Holdings reported results for the third quarter of 2026. Revenue came in at $352.65m, up 10.1% year on year, EBITDA at $54.48m, net profit at -$32.72m, and net debt at $882.14m at quarter-end. Revenue growth accelerated versus the second quarter, but EBITDA fell 6.7% year on year and the margin narrowed to 15.4%. With an EV/EBITDA LTM multiple of 14.9 and negative return on equity, the shares look unattractive at the current level.
Key takeaways
— Revenue grew 10.1% year on year, accelerating from 8.1% in the second quarter
— EBITDA fell 6.7% year on year and the margin dropped to 15.4% from 18.2%
— Net loss of $32.72m despite positive operating profit of $2.94m
— Operating cash flow of $21.10m was almost entirely absorbed by capex of $17.07m
— Net debt rose to $0.9bn from $0.5bn a year earlier, with net debt/EBITDA LTM at 3.66
— EV/EBITDA LTM of 14.9 alongside a negative return on equity of -15.3%
— On the portal's model, the upside to fair value is -75%
Attractiveness
Key figures, USD bn
| Metric | Q3 2025 | Q3 2026 | Change |
|---|---|---|---|
| Revenue | 0.32 | 0.35 | +10.1% |
| EBITDA | 0.06 | 0.05 | -6.7% |
| Operating profit | 0.00 | 0.00 | -27.0% |
| Net profit | -0.06 | -0.03 | — |
| Operating cash flow | 0.05 | 0.02 | -56.4% |
| Capex | 0.02 | 0.02 | +2.9% |
| EBITDA margin | 18.2% | 15.4% | -2.8 pp |
| Net margin | -17.8% | -9.3% | +8.5 pp |
Revenue grew 10.1% year on year, accelerating from 8.1% in the second quarter
Revenue for the third quarter of 2026 was $352.65m, up 10.1% from the third quarter of 2025. In the second quarter growth was slower at 8.1%, so the acceleration is confirmed by the numbers. This is the second consecutive quarter of acceleration: growth was 5.7% in the first quarter.
Over the trailing twelve months revenue reached $1,300.0m. The company is growing sales, but the pace does not yet signal a turnaround: a year ago in the third quarter revenue was falling 3.1%, so the current growth is a recovery from a low base.
Accelerating revenue is the main positive of the report. However, it is not accompanied by improving profitability, and that is the key contradiction of the quarter.
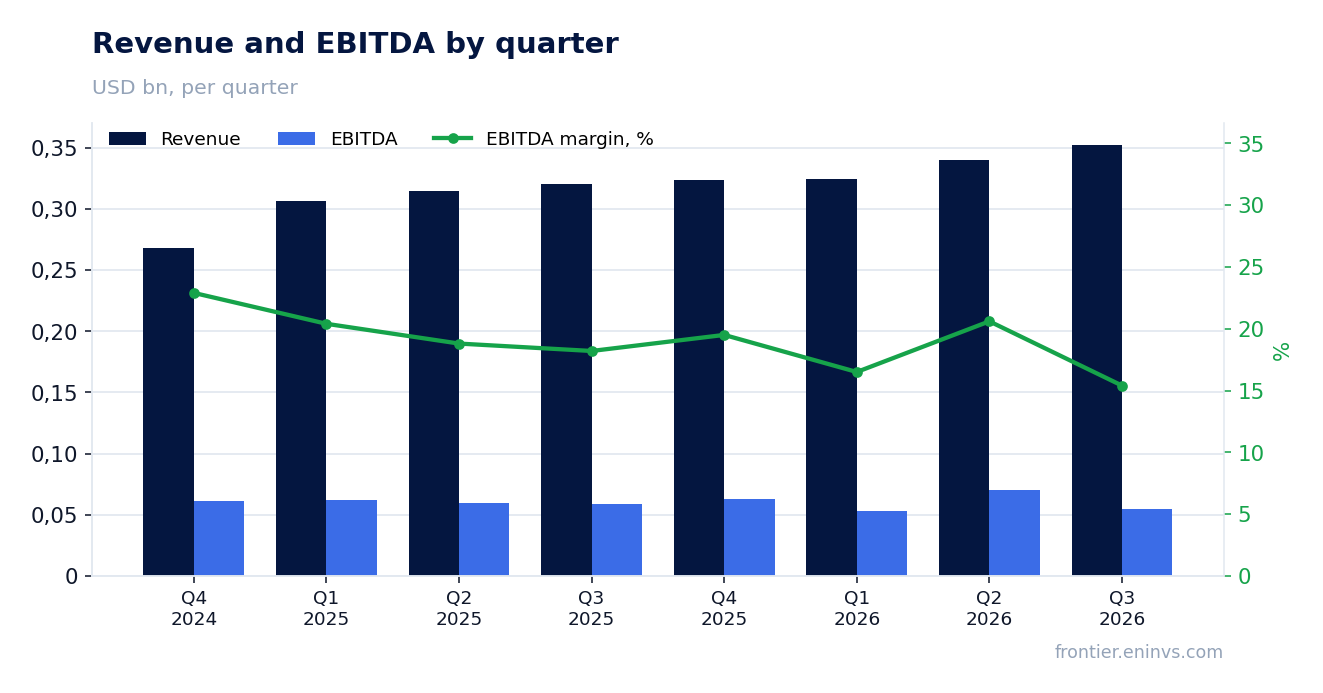
EBITDA fell 6.7% year on year and the margin dropped to 15.4% from 18.2%
EBITDA for the third quarter of 2026 was $54.48m, down 6.7% from a year earlier. The EBITDA margin fell to 15.4% from 18.2% a year earlier. Revenue is growing while EBITDA is falling, which means costs are rising faster than sales.
Operating profit was only $2.94m on revenue of $352.65m. This means that after depreciation and other operating expenses almost nothing is left of EBITDA. The gap between EBITDA and operating profit of $51.5m is primarily depreciation.
Falling margin on rising revenue is a warning signal. The company cannot convert sales growth into profit growth, and that limits its ability to service debt and invest.
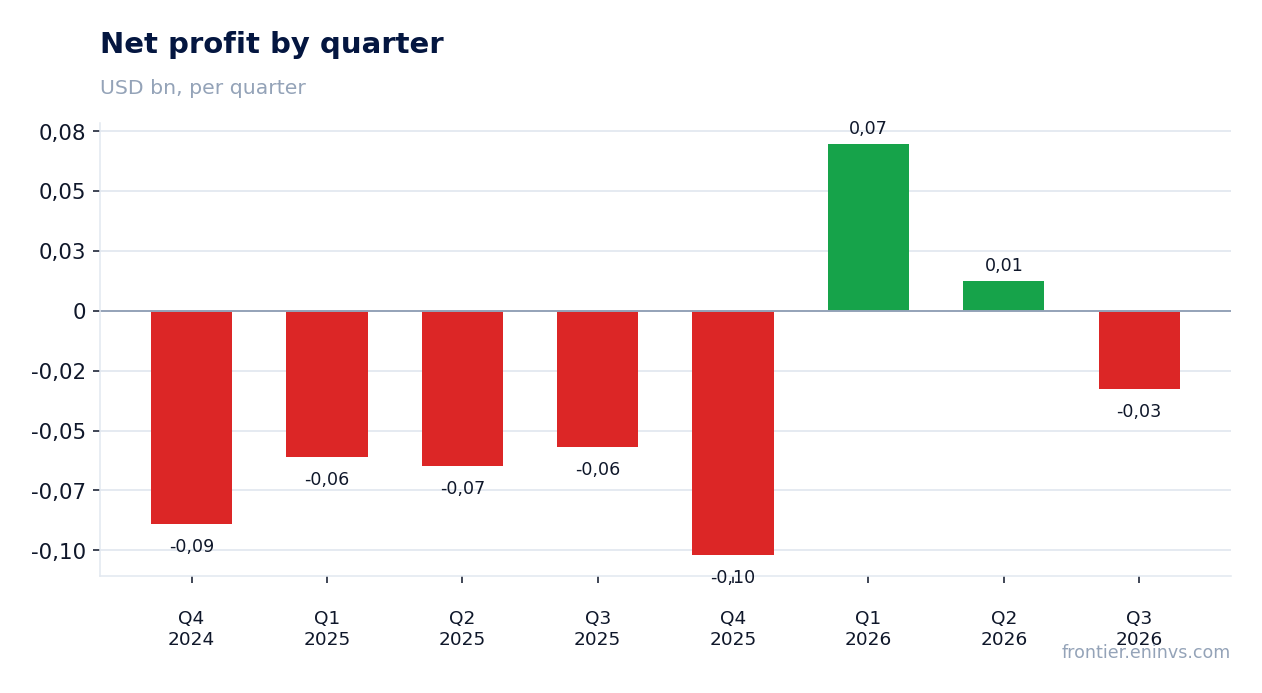
Net loss of $32.72m despite positive operating profit of $2.94m
Net loss for the third quarter of 2026 was $32.72m. Operating profit was positive at $2.94m. The difference between operating profit and the net result is interest on debt and other financial expenses.
The net margin was -9.3%, better than -17.8% a year earlier. The improvement is not due to higher profit but to the fact that the loss was deeper a year ago. In the first quarter of 2026 the company reported a profit of $69.80m, but that appears to be a one-off, since in the second quarter profit was only $12.51m and in the third quarter it returned to a loss.
A negative return on equity of -15.3% confirms that the company is not yet earning on invested capital. For shareholders this means the value of the business is not growing organically.
Operating cash flow of $21.10m was almost entirely absorbed by capex of $17.07m
Operating cash flow for the third quarter of 2026 was $21.10m. Capital expenditures were $17.07m. Free cash flow was therefore about $4.03m, insufficient to service debt and pay shareholders.
Over the trailing twelve months operating cash flow was $113.7m. The company generates cash from operations, but most of it goes to maintaining and expanding capacity. With net debt of $882.14m and interest expenses not disclosed in the facts, free flow remains vulnerable.
Weak free cash flow limits the company's ability to reduce debt. This is a key risk for shareholders.
Net debt rose to $0.9bn from $0.5bn a year earlier, with net debt/EBITDA LTM at 3.66
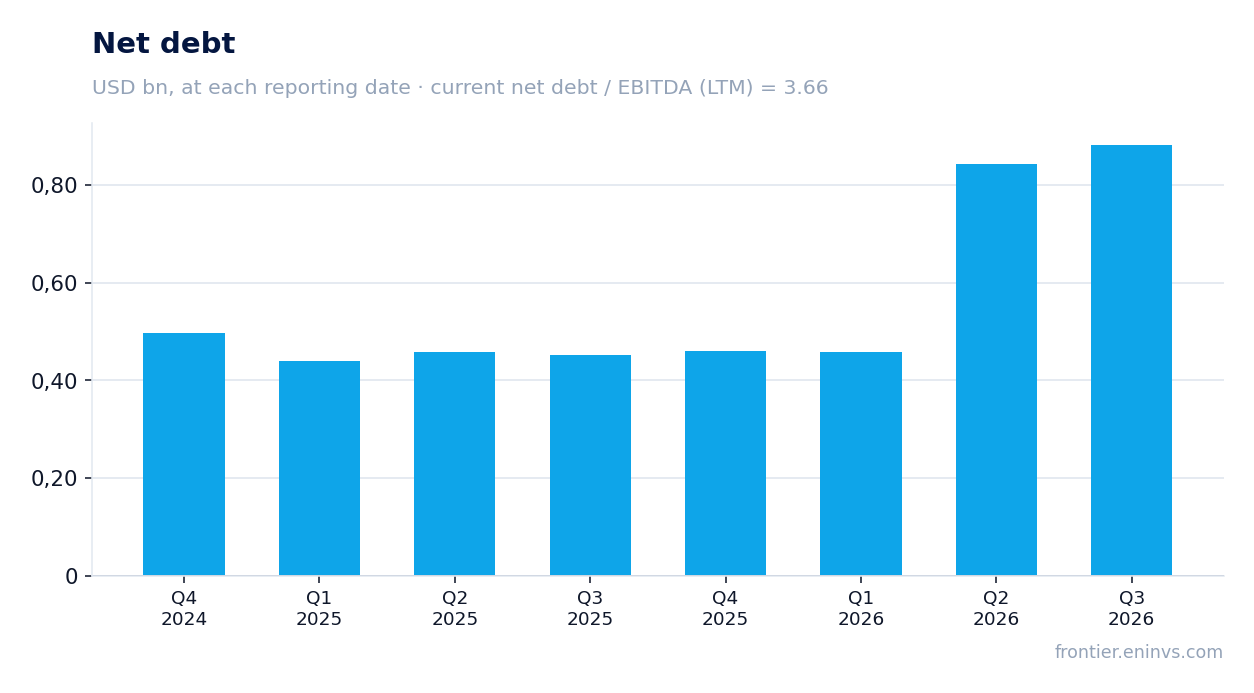
Net debt as of 30 September 2026 was $882.14m, or $0.9bn. A year earlier, on 30 September 2025, it was $0.5bn. The increase over twelve months was $0.4bn. Over the quarter debt rose slightly: from $0.8bn on 30 June 2026 to $0.9bn on 30 September.
The ratio of net debt to EBITDA over the trailing twelve months is 3.66. This is a level that requires attention: with EBITDA LTM of $241.0m, the debt burden remains significant. For comparison, EV/EBITDA LTM is 14.9, reflecting a high market valuation.
Rising debt alongside falling EBITDA is a dangerous combination. If EBITDA continues to decline, the ratio could rise, limiting financial flexibility.
EV/EBITDA LTM of 14.9 alongside a negative return on equity of -15.3%
EV/EBITDA LTM is 14.9. This is a high multiple for a company with falling EBITDA and a negative net profit. Market capitalisation is $2,700.3m, net debt is $882.1m, giving an enterprise value of about $3,582.4m.
Return on equity is negative at -15.3%. Investors are paying a high multiple for a business that is not yet profitable. This creates a risk of valuation correction if operating metrics do not improve.
On the portal's model, the fair value of the share implies a downside of -75% to the current price. This is the portal's own estimate, not a market consensus, but it points to a significant gap between price and fundamental value.
On the portal's model, the upside to fair value is -75%
Our model reprices EBITDA at current commodity prices and the target EV/EBITDA. At the current market capitalisation this implies a -75% upside to fair value. In other words, the share trades well above the model's estimate.
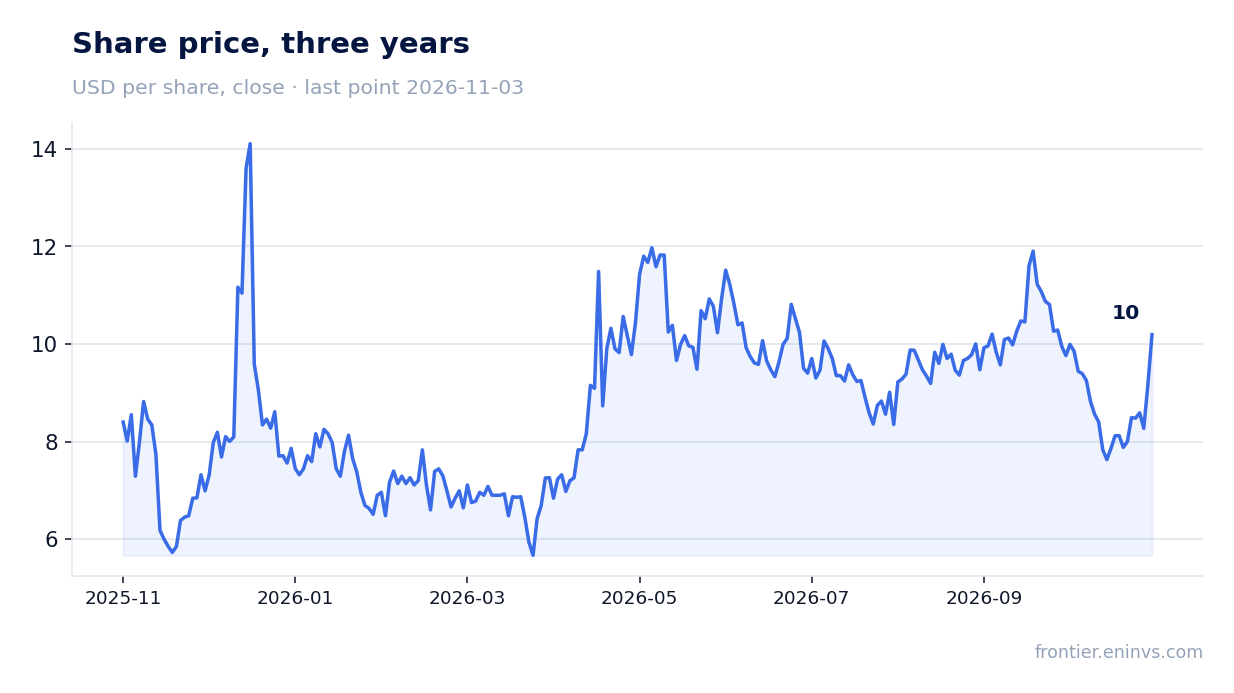
Since the report was published the share has risen 11.2%, and from the release to 3 November also 11.2%. The market reacted to accelerating revenue but ignored falling EBITDA and rising debt. Such a reaction may be short-lived.
The model is a benchmark, not a forecast. If EBITDA recovers, the estimate could change. But current facts do not support optimism.
Valuation on the latest reported figures
| Metric | Value |
|---|---|
| Market cap | 2.70 bn USD |
| EV/EBITDA (LTM) | 14.9 |
| P/B | 3.19 |
| Net debt / EBITDA (LTM) | 3.66 |
| Operating cash flow (LTM) | 0.11 bn |
| ROE | -15.3% |
Bottom line
The strong side of the report is revenue accelerating to 10.1% and operating cash flow rising to $21.10m. The weak side is EBITDA falling 6.7% and the margin dropping to 15.4%, as well as net debt rising to $0.9bn. A net loss of $32.72m despite positive operating profit shows that the main burden is interest expenses. An EV/EBITDA LTM multiple of 14.9 and negative return on equity make the share unattractive at the current level. The verdict is 'unattractive'.
Open the company's financial profile CURLF →
See also: market overview · valuation map · stock screeners