Cenovus Energy: profit up 2.6x, but net debt has added $2.2bn since June

Cenovus Energy reported third-quarter 2026 results: revenue reached $13,625.7m, operating profit $4,505.3m and net profit $2,391.8m. Year on year revenue grew 42.3% and net profit 156.4%, while the net margin rose to 17.6% from 9.7%. Net debt at end-September stood at $6,026.2m versus $3,784.8m at 30 June, and the valuation at 8.2x LTM P/E and 5.3x LTM EV/EBITDA looks modest, though the portal model implies a 15% discount to fair value. The share looks rather attractive, but the debt build and the absence of quarterly EBITDA data keep the picture from being clear-cut.
Key takeaways
— Third-quarter revenue grew 42.3% year on year, but the pace slowed from 46.7% in the second quarter
— Net profit added 156.4% year on year, lifting the net margin to 17.6% from 9.7%
— Net debt rose from $3.8bn at 30 June to $6.0bn, with the ratio to LTM EBITDA at 0.56
— Quarterly operating cash flow of $3,975.0m covered capital spending of $1,035.0m
— The trailing 12-month dividend yield is 1.63%, supported by LTM profit of $6,268.4m
— Valuation at 8.2x LTM P/E and 5.3x LTM EV/EBITDA is modest, but the portal model implies a 15% discount to fair value
Attractiveness
Key figures, USD bn
| Metric | Q3 2025 | Q3 2026 | Change |
|---|---|---|---|
| Revenue | 9.57 | 13.6 | +42.3% |
| EBITDA | 2.01 | — | — |
| Operating profit | 1.10 | 4.51 | +310.4% |
| Net profit | 0.93 | 2.39 | +156.4% |
| Operating cash flow | 1.55 | 3.98 | +157.1% |
| EBITDA margin | 21.0% | — | — |
| Net margin | 9.7% | 17.6% | +7.9 pp |
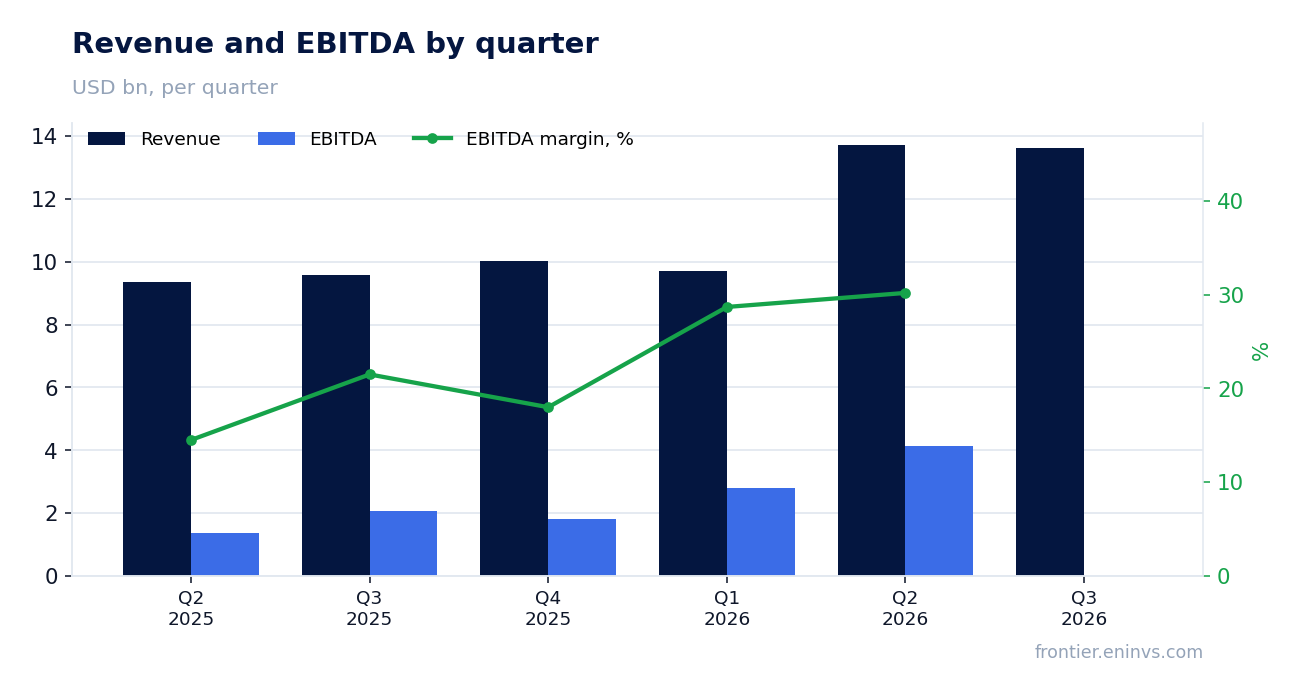
Third-quarter revenue grew 42.3% year on year, but the pace slowed from 46.7% in the second quarter
Third-quarter 2026 revenue was $13,625.7m versus $9,573.3m a year earlier. Growth of 42.3% looks strong, but it was 46.7% in the second quarter, so the pace has slowed. The 4.4 percentage-point deceleration is the first sign that the year-ago base is getting harder to beat.
Sequential growth has also nearly stalled: revenue was $13,728.8m in the second quarter and $13,625.7m in the third. Quarter on quarter the figure even slipped slightly, even though the year-on-year rate remains high. That means the annual growth came mainly from a weak third-quarter 2025 base rather than from a pick-up in the business over the past three months.
What matters for further growth is not the annual figure but the ability to keep revenue above $13bn in the next quarter. If the sequential trend stays flat, the annual rate will keep slowing.
Net profit added 156.4% year on year, lifting the net margin to 17.6% from 9.7%
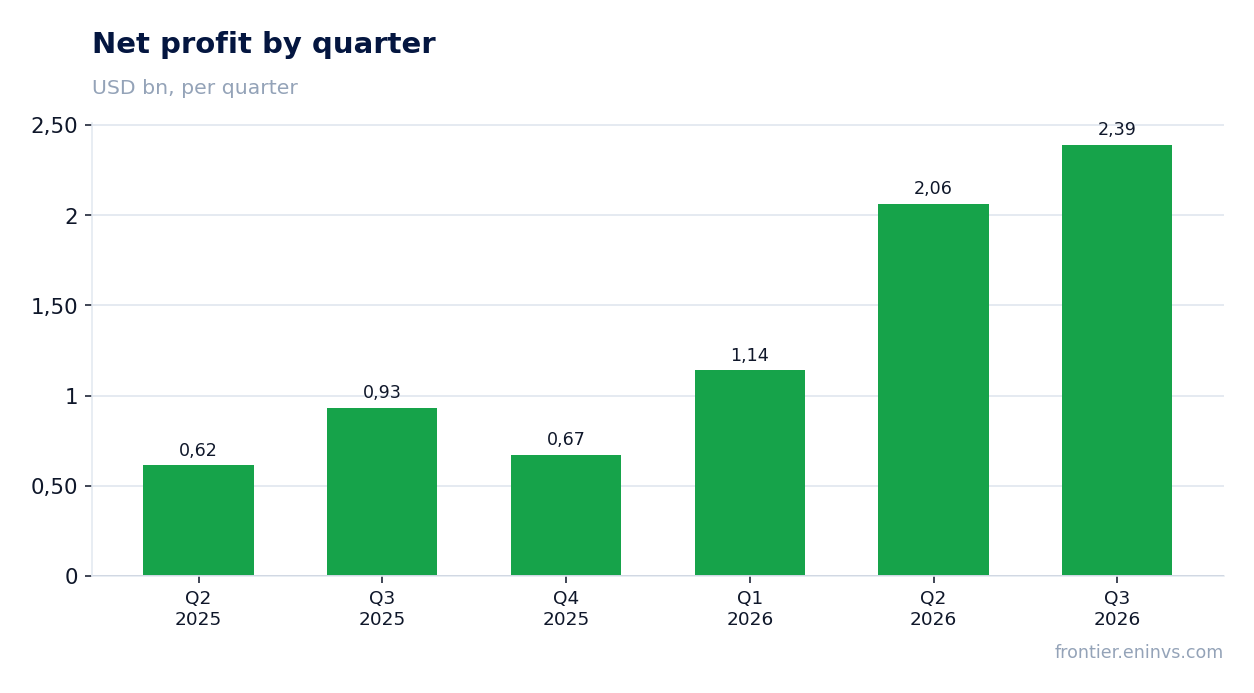
Third-quarter 2026 net profit was $2,391.8m versus $933.0m a year earlier. Growth of 156.4% against revenue growth of 42.3% means profit grew faster than revenue, and the net margin rose to 17.6% from 9.7%.
Operating profit for the quarter was $4,505.3m, and it grew markedly faster than revenue. That points to better operating economics: either costs fell, or realised prices rose, or both. The facts give no cost-line breakdown, so the specific source of the margin gain cannot be named.
LTM profit for the trailing 12 months is $6,268.4m. That base, not the quarterly one, matters for the dividend burden and for the P/E valuation. Quarterly profit is nearly double the average of the past four quarters, which signals a strong but not necessarily sustainable level.
Net debt rose from $3.8bn at 30 June to $6.0bn, with the ratio to LTM EBITDA at 0.56
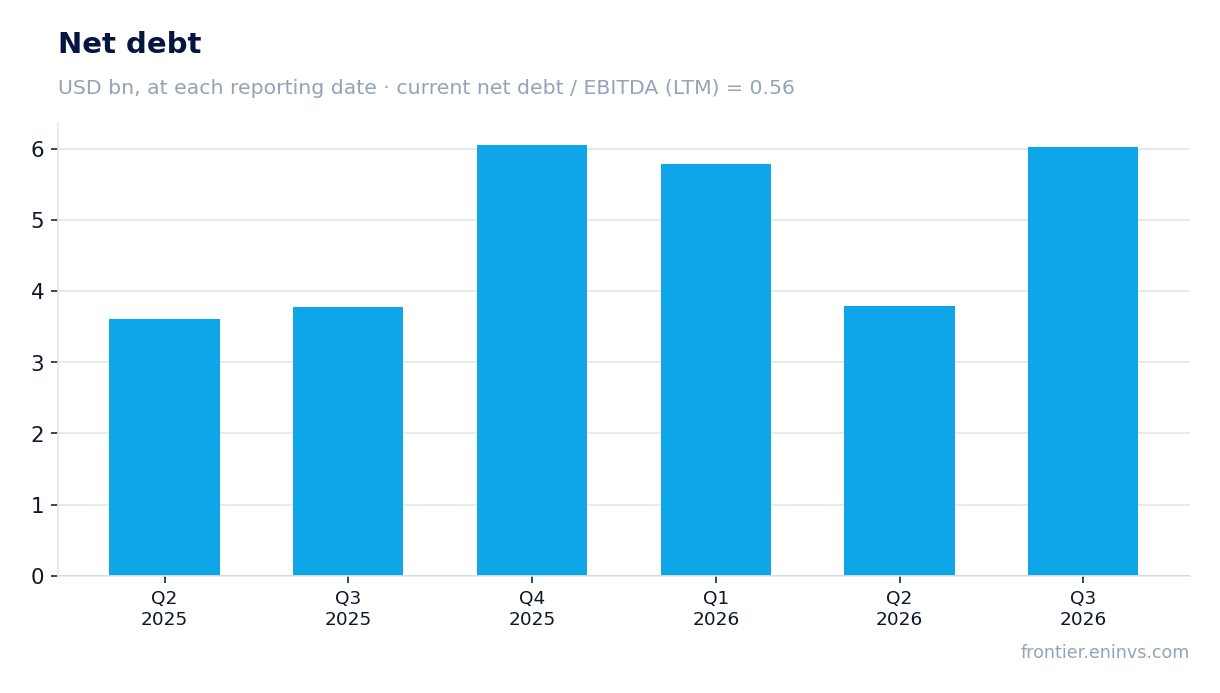
Net debt at 30 September 2026 was $6,026.2m. It was $3,784.8m at 30 June, so it rose by $2.2bn over the quarter. Over 12 months, from $3,774.6m at 30 September 2025, the increase was $2.3bn.
The ratio of net debt to LTM EBITDA is 0.56. That is a moderate level: LTM EBITDA of $10,806.2m is more than 1.7 times net debt. The facts do not disclose the direction of the ratio, so only the level can be stated, not whether leverage rose or fell.
A $2.2bn debt increase in a quarter with $3,975.0m of operating cash flow and $1,035.0m of capex means free cash flow covered investment but not everything else. What exactly absorbed the difference – shareholder returns, acquisitions or working-capital build – does not follow from the facts.
Quarterly operating cash flow of $3,975.0m covered capital spending of $1,035.0m
Third-quarter 2026 operating cash flow was $3,975.0m and capital spending $1,035.0m. Free cash flow before shareholder returns and other items is therefore about $2,940.0m, comfortably covering capex.
Over the trailing 12 months operating cash flow was $11,344.2m. That is a solid base: the quarterly figure of $3,975.0m is above the four-quarter average, confirming the strong operating result for the period.
Capex rose: $863.1m in the second quarter versus $1,035.0m in the third. A 20% quarterly increase in investment is normal for the sector, but it reduces free cash flow. If capex stays at this level and revenue stops growing, the free-cash-flow cushion will shrink.
The trailing 12-month dividend yield is 1.63%, supported by LTM profit of $6,268.4m
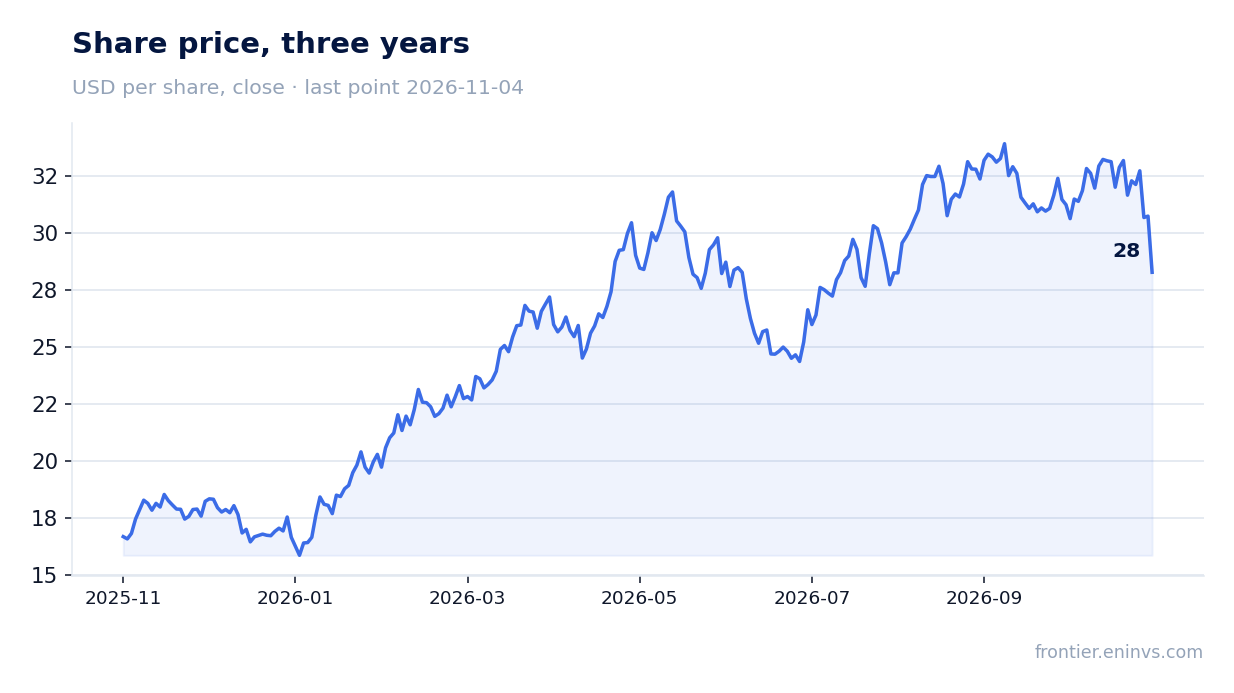
The trailing 12-month dividend yield is 1.63% on the current price. With a market cap of $51,175.0m that corresponds to about $833m of annual payments. LTM profit of $6,268.4m covers such payments more than seven times over, so the current dividend is protected with a large cushion.
Our estimate for the current year's dividend is a yield of about 1.6–1.7%, assuming payments stay at the trailing-12-month level. It rests on LTM profit and on the company's stable payment record; the key risk is not profit but a decision to direct free cash flow to debt reduction, with net debt up $2.2bn over the quarter.
A yield of 1.63% is modest in absolute terms, but for an oil and gas company with LTM profit of $6.3bn and a payout ratio below 15% it looks more like a conservative policy than weakness. A smaller payout could come from higher capex or a large debt-funded acquisition.
Valuation at 8.2x LTM P/E and 5.3x LTM EV/EBITDA is modest, but the portal model implies a 15% discount to fair value
The share trades at 8.2x LTM P/E and 5.3x LTM EV/EBITDA. For a company with a 17.6% net margin and 34.9% ROE these are modest multiples. However, the facts give no three-year history for these multiples, so the current level cannot be compared with its own past.
The portal model, which reprices EBITDA at current commodity prices at the target EV/EBITDA, implies a 15% discount to fair value. This is our own estimate, not a market consensus. The discount means that at current commodity prices the market values the company below the worth the model assigns.
Market cap is $51,175.0m and net debt $6,026.2m. A net debt to LTM EBITDA ratio of 0.56 puts no debt pressure on the valuation. The main question is profit sustainability: if the 17.6% quarterly margin proves to be a peak, the LTM multiples will look cheaper than they really are.
Valuation on the latest reported figures
| Metric | Value |
|---|---|
| Market cap | 51.2 bn USD |
| P/E (LTM) | 8.2 |
| EV/EBITDA (LTM) | 5.3 |
| P/B | 2.26 |
| Net debt / EBITDA (LTM) | 0.56 |
| Operating cash flow (LTM) | 11.3 bn |
| ROE | 34.9% |
| Dividend yield (12m) | 1.6% |
Bottom line
A strong quarter: revenue up 42.3%, net profit up 156.4%, a 17.6% margin, and free cash flow comfortably covering capex. But profit growth rests on a margin that may prove to be a peak, and net debt rose by $2.2bn over the quarter. Valuation at 8.2x P/E and 5.3x EV/EBITDA is modest, but the portal model implies a 15% discount rather than a premium. The key question for a holder is whether profit stays above $2bn a quarter and whether debt keeps rising.
Open the company's financial profile CVE →
See also: market overview · valuation map · stock screeners