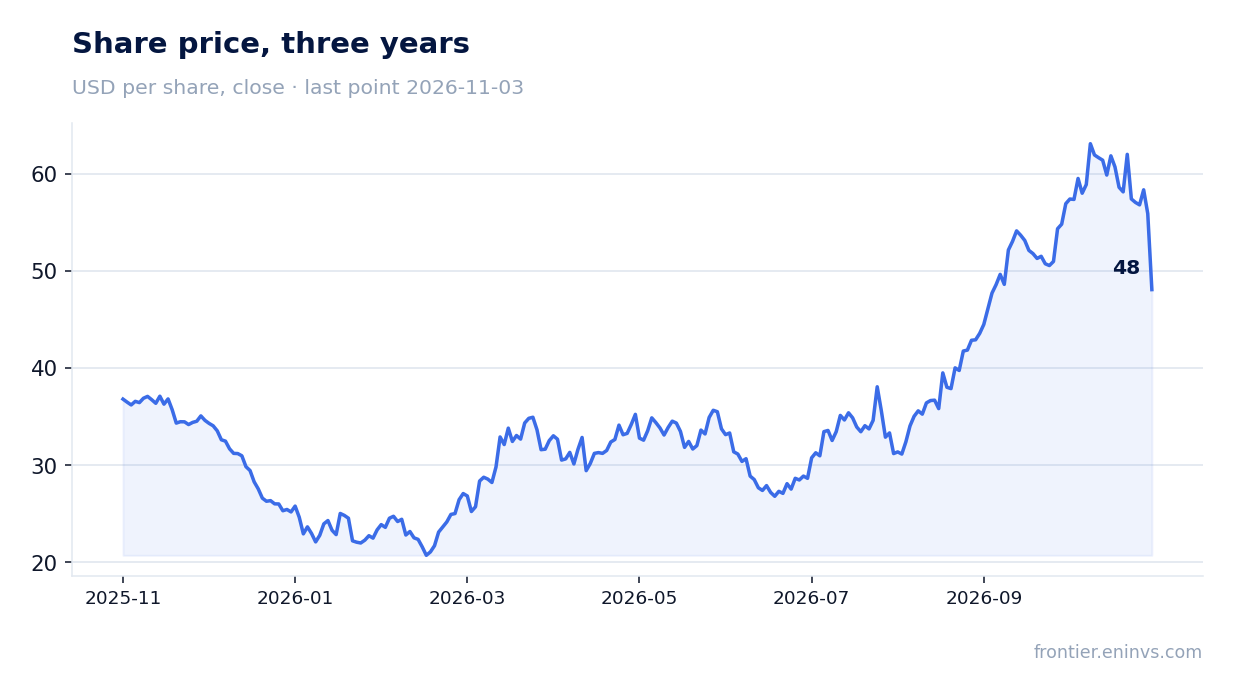
CVR Energy: profit up 52.4% but margin compressed from 32.0% to 24.4%, and the market dumped the shares by 14.0%

On 3 November CVR Energy reported third-quarter 2026 results. Revenue came in at USD 3,281.0 million (+68.8% year on year), EBITDA at 802.0 million, net profit at 570.0 million (+52.4%). Revenue growth accelerated versus the second quarter (+55.5%), but the EBITDA margin fell to 24.4% from 32.0% a year earlier, and the shares lost 14.0% on the release day. At an EV/EBITDA of 5.5 against its own three-year average of 6.2 the stock looks cheaper than its history, yet the margin compression and a thin 0.4% dividend yield keep the assessment neutral.
Key takeaways
— Revenue rose 68.8% year on year, and growth accelerated from 55.5% in the second quarter
— EBITDA added 28.7%, but the margin compressed to 24.4% from 32.0% – growth is getting more expensive
— Net profit rose 52.4% to USD 570.0 million at a 17.4% net margin
— Free cash flow of USD 593.0 million covers capital expenditure of 62.0 million with room to spare
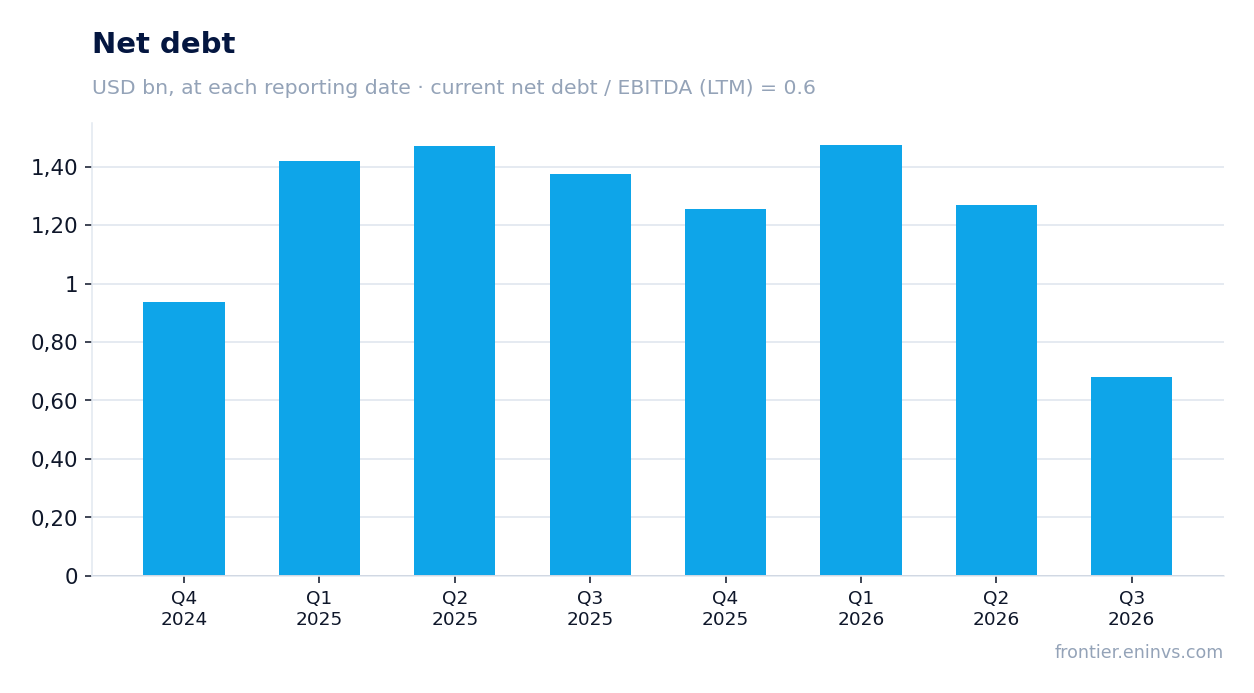
— Net debt fell from USD 1.3 billion on 30 June to 0.7 billion on 30 September
— A 0.4% dividend yield does not offset the margin-compression risk
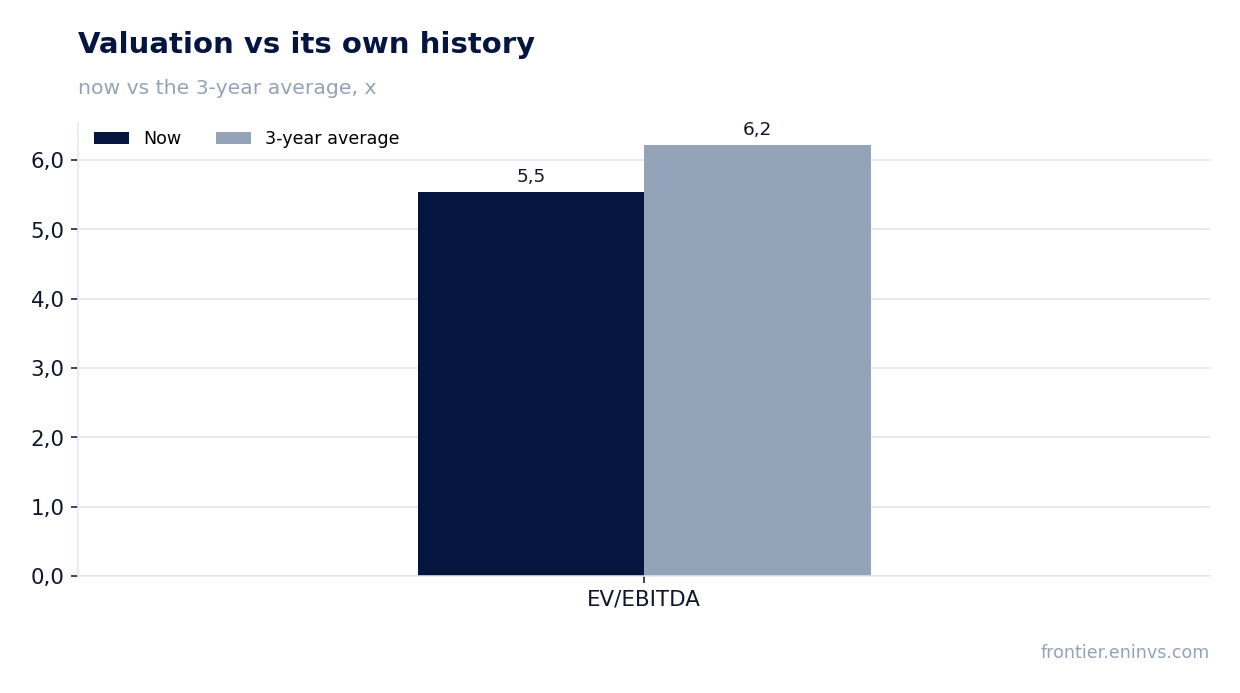
— EV/EBITDA of 5.5 is below its own three-year average of 6.2, but a P/E LTM of 18.2 caps the upside
Attractiveness
Key figures, USD bn
| Metric | Q3 2025 | Q3 2026 | Change |
|---|---|---|---|
| Revenue | 1.94 | 3.28 | +68.8% |
| EBITDA | 0.62 | 0.80 | +28.7% |
| Operating profit | 0.51 | 0.72 | +41.4% |
| Net profit | 0.37 | 0.57 | +52.4% |
| Operating cash flow | 0.16 | 0.66 | +301.8% |
| Capex | 0.04 | 0.06 | +63.2% |
| EBITDA margin | 32.0% | 24.4% | -7.6 pp |
| Net margin | 19.2% | 17.4% | -1.8 pp |
Revenue rose 68.8% year on year, and growth accelerated from 55.5% in the second quarter
In the third quarter of 2026 CVR Energy's revenue reached USD 3,281.0 million, 68.8% more than a year earlier. In the second quarter growth was 55.5%, so the dynamics accelerated. The acceleration is explained primarily by the low base of the third quarter of 2025, when revenue was USD 1,944.0 million.
The sequential comparison confirms the momentum: versus the second quarter of 2026 (USD 2,738.0 million) revenue rose 19.8%. Such a step in a single quarter is significant for a refiner and points to a recovery in volumes or selling prices.
For assessing sustainability it matters that growth has accelerated for two quarters in a row: in the first quarter of 2026 revenue added 20.3%, in the second 55.5%, in the third 68.8%. The year-earlier base was weak, however, and without volume and price data one cannot claim that growth will continue at the same pace.
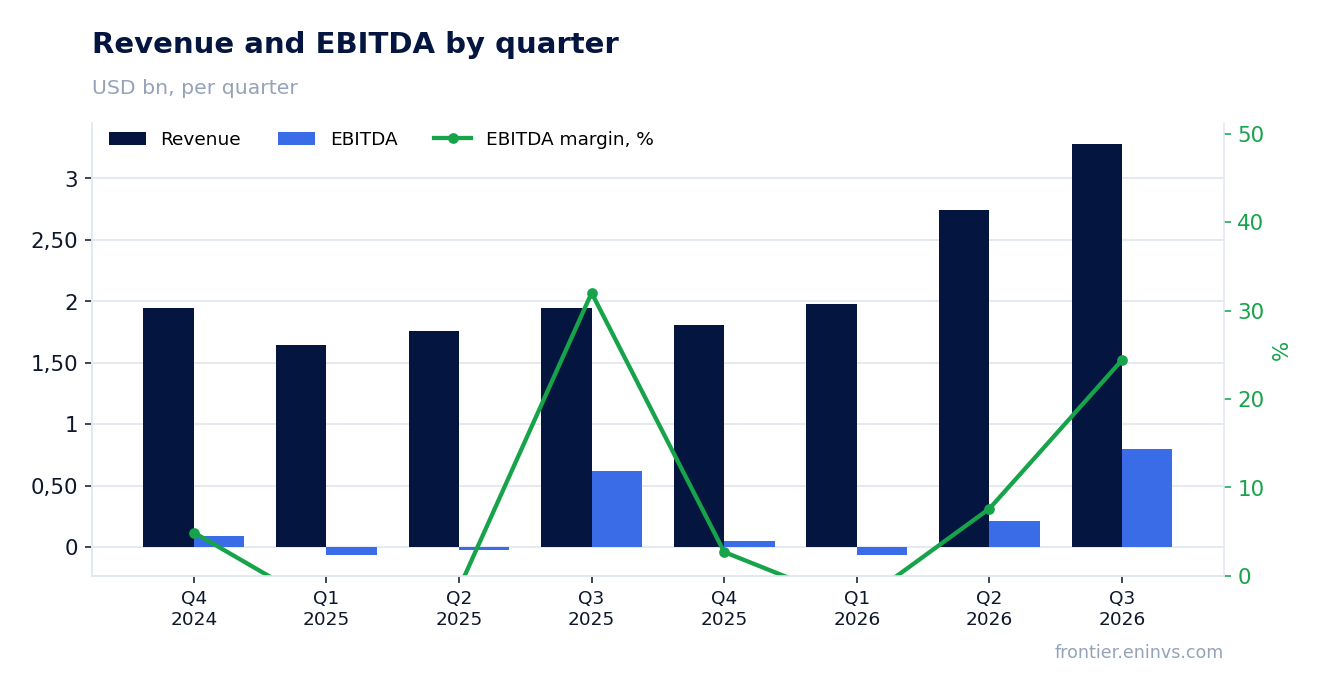
EBITDA added 28.7%, but the margin compressed to 24.4% from 32.0% – growth is getting more expensive
EBITDA for the third quarter of 2026 was USD 802.0 million, 28.7% more than a year earlier. At the same time the EBITDA margin fell to 24.4% from 32.0% in the third quarter of 2025. The 7.6 percentage-point gap means each dollar of revenue brings noticeably less operating profit.
Operating profit was USD 724.0 million on revenue of 3,281.0 million, i.e. 22.1% of revenue. A year earlier, on revenue of 1,944.0 million, operating profit was 512.0 million, or 26.3%. The compression at the operating-profit level is smaller than at the EBITDA level, but the direction is the same.
The facts do not disclose the cause of the margin compression. Revenue growing 68.8% while EBITDA grows only 28.7% means variable costs or procurement prices rose faster than revenue. For refining this is typical when feedstock costs rise faster than product prices, but the specific driver is not stated in the report.
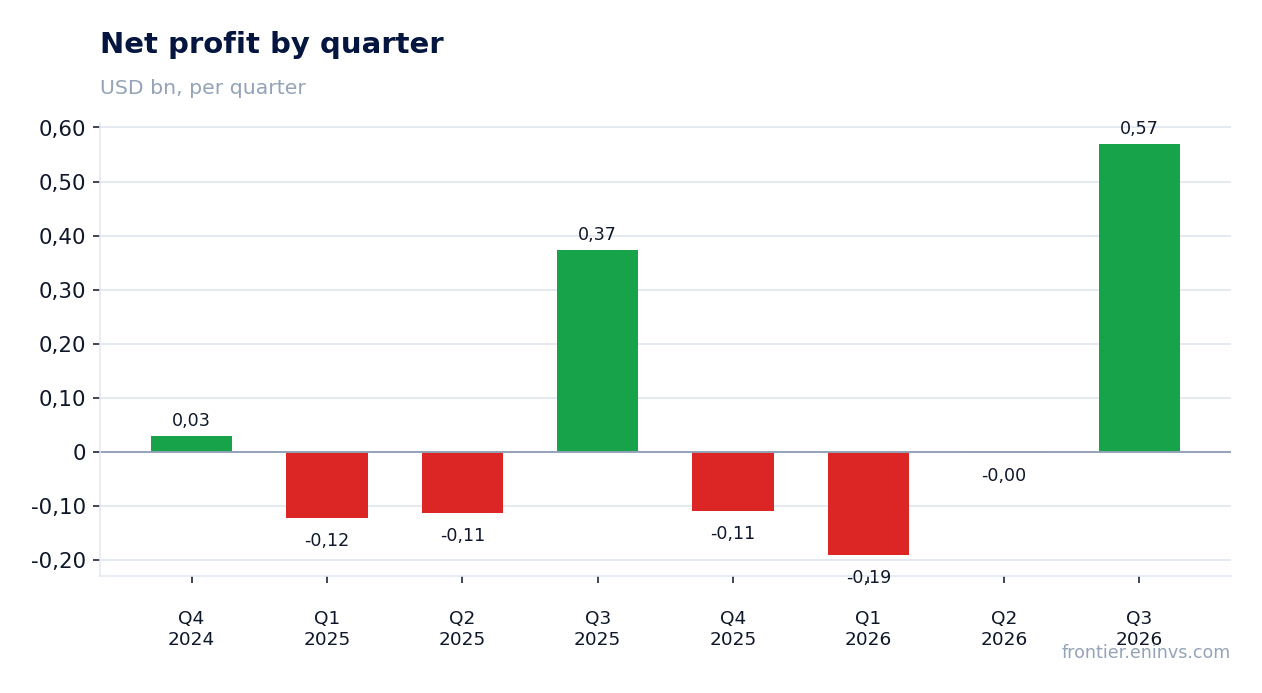
Net profit rose 52.4% to USD 570.0 million at a 17.4% net margin
Net profit for the third quarter of 2026 was USD 570.0 million, 52.4% more than a year earlier. The net margin was 17.4% against 19.2% in the third quarter of 2025. The 1.8 percentage-point decline is smaller than the EBITDA margin compression, which points to a lower effective tax rate or lower interest on debt.
Net profit grew faster than EBITDA (52.4% versus 28.7%), which is unusual when the operating margin is compressing. This means that below the operating line costs fell: either interest payments or tax. Net debt on 30 September was USD 0.7 billion, and the reduction from 1.3 billion on 30 June lowered the interest burden.
Earnings per share and the share count are not disclosed in the facts, so the P/E LTM of 18.2 is the only valuation reference for earnings. With net profit of USD 265.0 million over the last twelve months and a market capitalisation of 4,834.5 million, the multiple reflects expectations of profit recovery rather than the current level.
Free cash flow of USD 593.0 million covers capital expenditure of 62.0 million with room to spare
Operating cash flow for the third quarter of 2026 was USD 655.0 million, capital expenditure 62.0 million. Free cash flow, the difference between them, is 593.0 million. That is more than nine times capital expenditure, which for capital-intensive refining means a high ability to generate cash in a favourable environment.
For comparison: in the second quarter of 2026 operating cash flow was USD 307.0 million on capital expenditure of 44.0 million, in the first quarter 64.0 million on 47.0 million. The acceleration of cash flow in the third quarter coincides with the acceleration of revenue and profit growth, meaning cash arrives together with reported profit, not instead of it.
Over the last twelve months operating cash flow was USD 1,026.0 million. With capital expenditure of around 200 million over the same period, free cash flow remains positive. This gives the company room to reduce debt and pay dividends without raising new financing.
Net debt fell from USD 1.3 billion on 30 June to 0.7 billion on 30 September
CVR Energy's net debt on 30 September 2026 was USD 0.7 billion against 1.3 billion on 30 June. The 0.6 billion reduction over the quarter was funded by free cash flow of USD 593.0 million. A year earlier, on 30 September 2025, net debt was 1.4 billion, so over twelve months it fell by 0.7 billion.
The ratio of net debt to EBITDA over the last twelve months is 0.6. That is a low level for the industry and means the company can service its debt without strain. The direction of change in the ratio is not disclosed in the facts, so only the current level can be stated, not that leverage declined.
Low debt matters for dividend policy: at a ratio of 0.6 the company has room for payouts even if the environment deteriorates. However, a dividend yield of 0.4% suggests that this room is not yet being converted into high payouts.
A 0.4% dividend yield does not offset the margin-compression risk
CVR Energy's dividend yield over the last twelve months is 0.4%. That is well below the yield an investor can get on risk-free instruments. At such a yield the dividend is not an argument for the stock, and the investment decision must rest on the business valuation, not on payouts.
The company pays dividends, but the amount is not disclosed in the facts. With net profit of USD 265.0 million over the last twelve months and a market capitalisation of 4,834.5 million, a 0.4% yield corresponds to payouts of about 19.3 million, or roughly 7% of profit. That is a conservative policy that leaves money in the business.
Dividend growth requires sustained profit growth. The EBITDA margin compression to 24.4% from 32.0% limits the payout base. If the margin recovers, the dividend could rise, but for now a 0.4% yield provides no cushion for the investor.
EV/EBITDA of 5.5 is below its own three-year average of 6.2, but a P/E LTM of 18.2 caps the upside
The EV/EBITDA multiple over the last twelve months is 5.5 against its own three-year average of 6.2. The stock trades 11% below its historical valuation on this multiple, i.e. it looks cheaper than usual. That is an argument for the current price.
However, the P/E LTM is 18.2 on net profit of USD 265.0 million over the last twelve months. Profit for that period includes weak first and second quarters of 2026, when the company posted losses. If the third-quarter profit of USD 570.0 million proves sustainable, annual profit could substantially exceed 265.0 million and the P/E would fall.
On the portal's model the upside of the share to fair value is estimated at +45%. That is the portal's own estimate, not a market consensus. It rests on re-pricing EBITDA at current commodity prices at the target EV/EBITDA. If the margin stays at 24.4%, the model may prove optimistic.
Valuation on the latest reported figures
| Metric | Value |
|---|---|
| Market cap | 4.83 bn USD |
| P/E (LTM) | 18.2 |
| EV/EBITDA (LTM) | 5.5 |
| P/B | 5.38 |
| Net debt / EBITDA (LTM) | 0.60 |
| Operating cash flow (LTM) | 1.03 bn |
| ROE | -2.3% |
| Dividend yield (12m) | 0.4% |
| EV/EBITDA, 3-year average | 6.2 |
Bottom line
A strong third quarter of 2026 delivered revenue of USD 3,281.0 million (+68.8%), EBITDA of 802.0 million and net profit of 570.0 million. Free cash flow of USD 593.0 million allowed net debt to be cut to 0.7 billion. However, the margin compressed to 24.4% from 32.0%, and the market responded with a 14.0% drop in the shares on the release day. At an EV/EBITDA of 5.5 against a three-year average of 6.2 the stock is cheaper than its history, but a 0.4% dividend yield and a P/E LTM of 18.2 limit the appeal. The verdict is neutral: the valuation is below its historical level, but margin sustainability is unconfirmed.
Open the company's financial profile CVI →
See also: market overview · valuation map · stock screeners