Dorchester Minerals: revenue up 45.2%, but at current output the reserve base lasts 3.2 years
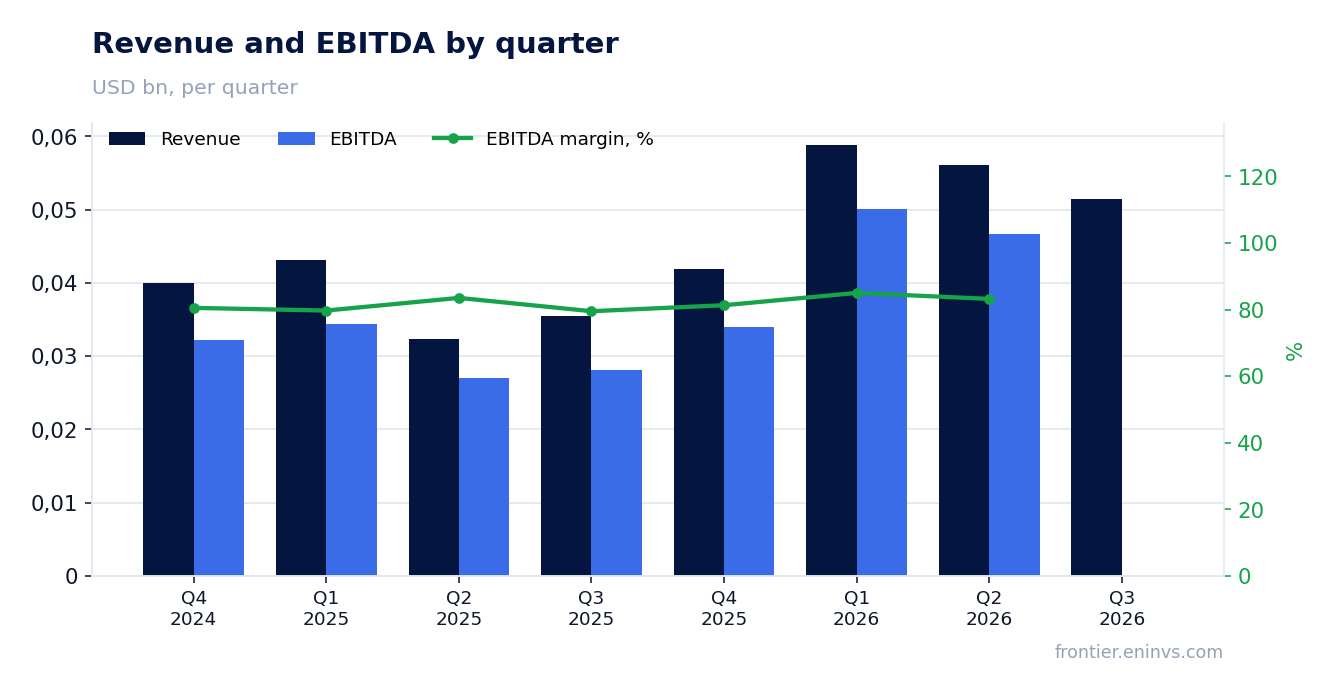
Dorchester Minerals reported third-quarter 2026 revenue of $51.4 million and net profit of $27.6 million, up 45.2% and 146.9% year on year respectively. The net margin rose to 53.7% from 31.5% a year earlier, and net debt remains negative at $52.3 million, meaning the company runs a net cash position. By our calculation, at the realised price implied by the portal's spot model, revenue should have been $51.6 million; the actual figure came in 0.4% below that – an almost exact match. At the current price the share looks rather attractive: EV/EBITDA of 8.1 is below its own three-year average of 10.4, the dividend yield of 12.4% is high, and leverage is negative, but the short reserve life limits the durability of the dividend.
Key takeaways
— Revenue rose 45.2% year on year, but growth decelerated from 73.1% in the second quarter to 45.2% now
— The portal's spot model expected revenue of $51.6 million; the actual $51.4 million was just 0.4% off
— The net margin rose to 53.7% from 31.5%, and that happened with revenue almost exactly matching the model
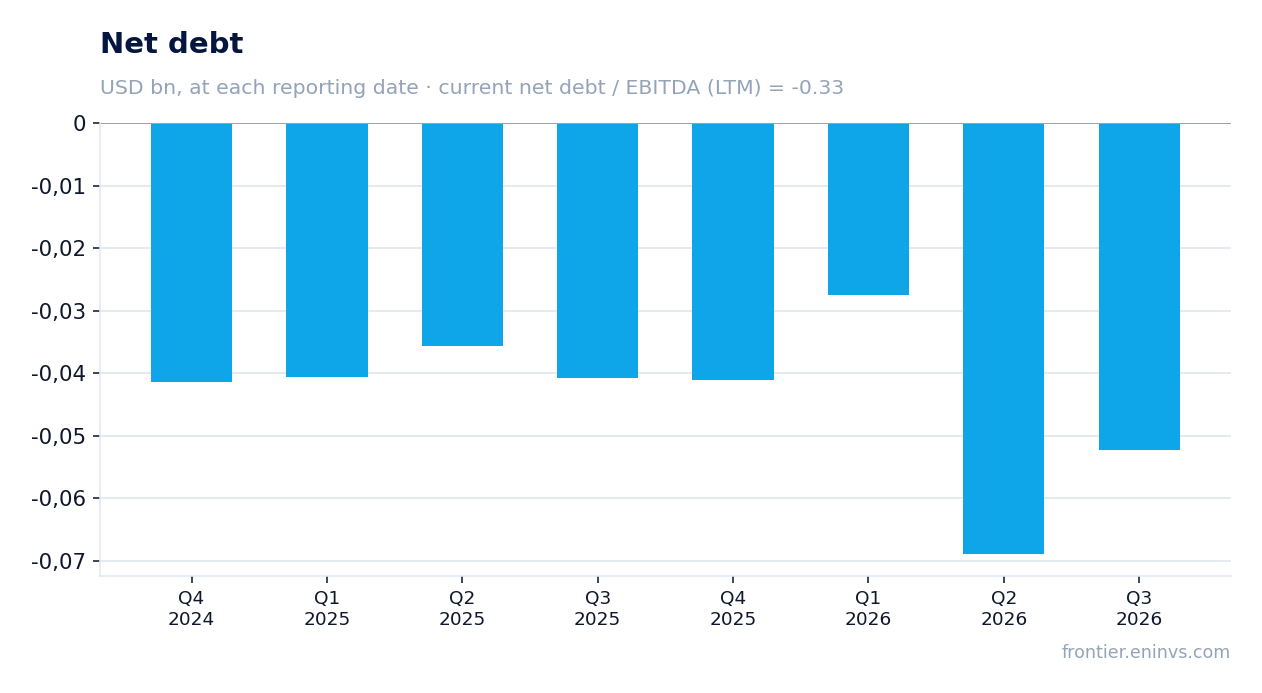
— Net debt is negative at $52.3 million at the end of September 2026, so leverage is negative
— The 12.4% dividend yield is backed by operating cash flow rather than borrowed money
— Reserves at the current production rate last 3.2 years – the main constraint on the dividend story
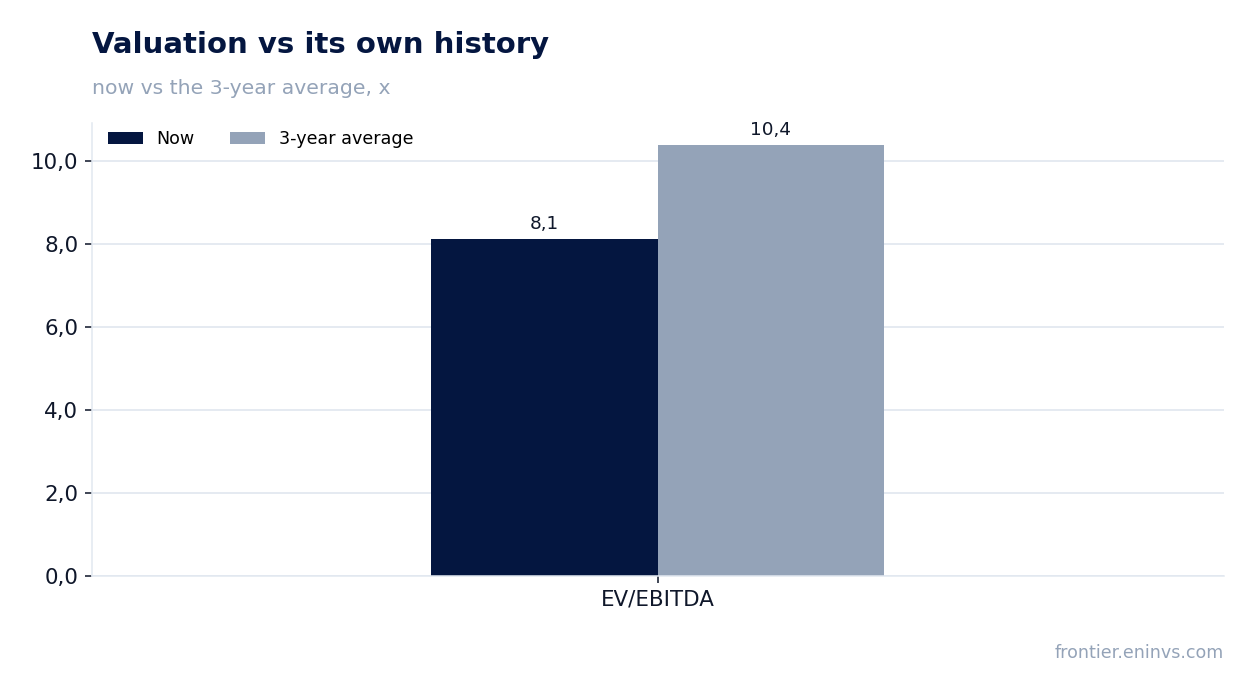
— EV/EBITDA of 8.1 is below its own three-year average of 10.4 – the share is cheaper than it has been over the past three years
Attractiveness
Key figures, USD bn
| Metric | Q3 2025 | Q3 2026 | Change |
|---|---|---|---|
| Revenue | 0.04 | 0.05 | +45.2% |
| EBITDA | 0.03 | — | — |
| Operating profit | 0.01 | — | — |
| Net profit | 0.01 | 0.03 | +146.9% |
| Operating cash flow | 0.03 | 0.04 | +25.4% |
| EBITDA margin | 79.1% | — | — |
| Net margin | 31.5% | 53.7% | +22.2 pp |
Revenue rose 45.2% year on year, but growth decelerated from 73.1% in the second quarter to 45.2% now
In the third quarter of 2026 Dorchester Minerals reported revenue of $51.4 million, 45.2% above the same quarter a year earlier. That is a strong result, but it is slower than the previous quarter: growth was 73.1% in the second quarter. The deceleration is mainly due to the higher base – third-quarter 2025 revenue was $35.4 million, while second-quarter 2025 revenue was $32.4 million.
The quarterly sequence shows the peak in growth came in the first and second quarters of 2026 – 36.4% and 73.1% respectively. In the third quarter growth remains high but is no longer accelerating. For a holder this means the main impulse from the price environment may already be realised, and further dynamics will depend on production volumes and realised prices.
The portal's spot model expected revenue of $51.6 million; the actual $51.4 million was just 0.4% off
According to the portal's spot model, which re-prices the average of the previous four quarters at current-period prices, expected revenue was $51.6 million. Actual revenue came in at $51.4 million – just 0.4% below. This means the company earned almost exactly what the price environment implied.
For EBITDA, however, no comparison is possible: the actual third-quarter 2026 figure is not disclosed in the facts. Over the previous four quarters, the deviation of actual EBITDA from the model ranged from -13.1% to +49.2%. Such volatility suggests the model does not always capture one-offs, but this time, on revenue, it worked almost perfectly.
What the prices implied and what the company earned
| Base (—) | Implied at period prices | Reported | Reported vs implied | |
|---|---|---|---|---|
| EBITDA, portal spot model, USD mn | — | 43,2 | — | — |
The net margin rose to 53.7% from 31.5%, and that happened with revenue almost exactly matching the model
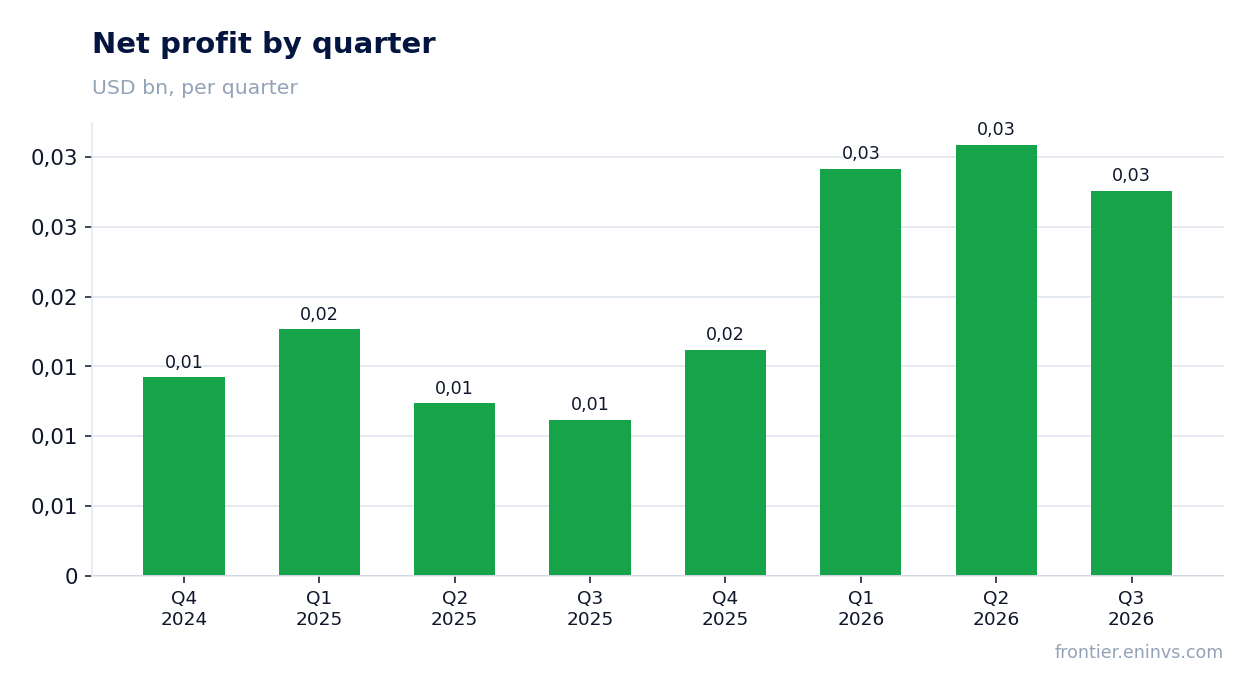
Net profit for the third quarter of 2026 was $27.6 million, up 146.9% year on year. With revenue of $51.4 million, the net margin reached 53.7% versus 31.5% in the third quarter of 2025. Such a margin increase, with revenue almost exactly matching the model, suggests that most of the improvement came from costs or from items below operating profit.
The facts do not break down operating expenses, so it is impossible to name the specific line that produced this effect. However, net profit rising almost 2.5 times on revenue growth of 45.2% means costs grew much more slowly than revenue. This could be due to lower unit costs or to one-off factors that will not repeat next quarter.
Net debt is negative at $52.3 million at the end of September 2026, so leverage is negative
At the end of September 2026 Dorchester Minerals' net debt stood at minus $52.3 million, meaning the company has a net cash position. The ratio of net debt to trailing-twelve-month EBITDA is negative at -0.33. This means there is no debt burden, and the company does not depend on borrowed financing.
Over the quarter net debt changed little: minus $52.3 million on 30 June 2026 and the same minus $52.3 million on 30 September 2026. A year earlier, on 30 September 2025, the figure was minus $40.8 million. The increase in the net cash position over the year reflects cash accumulation, which supports dividend payments.
The 12.4% dividend yield is backed by operating cash flow rather than borrowed money
Dorchester Minerals' dividend yield over the last 12 months is 12.4% – a high level for the market. Payments are backed by operating cash flow, which was $42.9 million in the third quarter of 2026 and $165.4 million over the last 12 months. With a net cash position, the company does not need borrowed funds to finance dividends.
Our estimate for the current year's dividend assumes payments are tied to profit and cash flow. With trailing-twelve-month net profit of $103.8 million and operating cash flow of $165.4 million, the dividend base looks solid. However, the 3.2-year reserve life means that without replenishing reserves, the current payout level cannot be sustained for long. A dividend cut is possible if hydrocarbon prices fall or production declines.
Reserves at the current production rate last 3.2 years – the main constraint on the dividend story
Dorchester Minerals' reserve life at the current production rate is 3.2 years. That is a very short horizon for a company paying generous dividends. It means that without acquiring new reserves or improving recovery rates, current production volumes cannot be sustained beyond a few years.
For an investor this is a key risk: a high dividend today may be compensation for a depleting resource base. The company does not disclose plans to replenish reserves, so it is impossible to assess whether it can extend the life. In the next report, watch for any statements on acreage acquisitions or changes in reserve estimates.
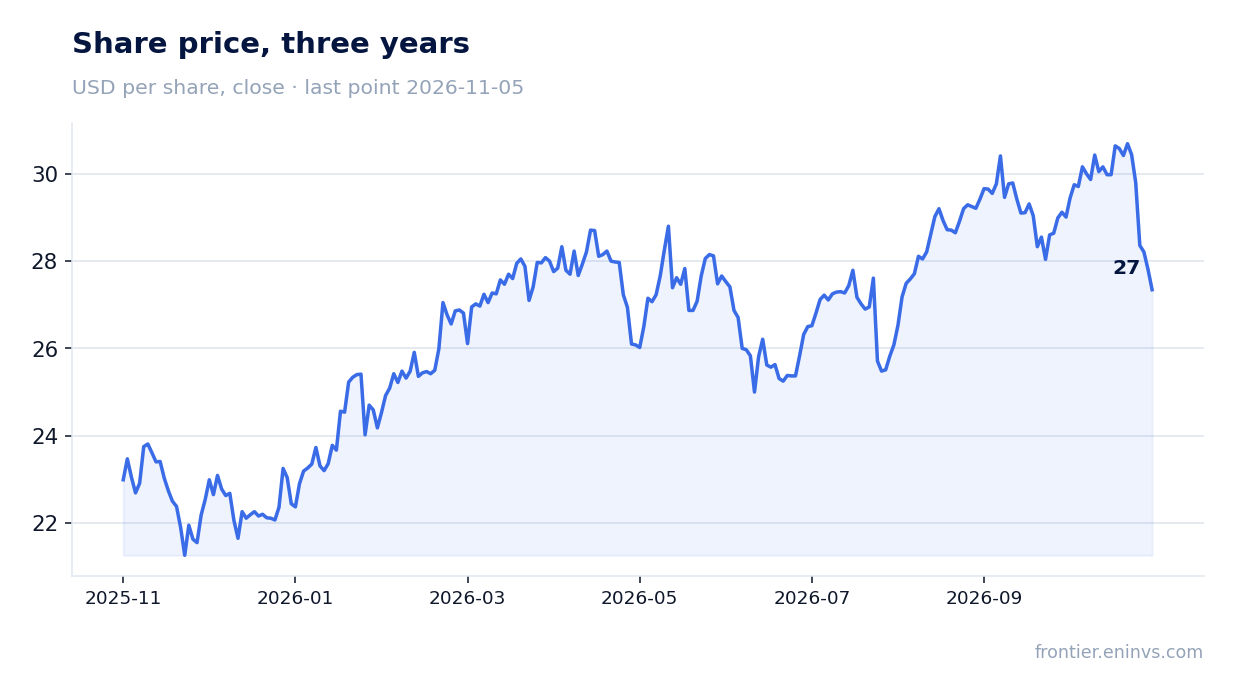
EV/EBITDA of 8.1 is below its own three-year average of 10.4 – the share is cheaper than it has been over the past three years
The trailing-twelve-month EV/EBITDA multiple is 8.1, 22% below its own three-year average of 10.4. This means that on this measure the share trades cheaper than its average over the past three years. The trailing P/E is 12.9, which looks low given a net margin of 53.7% and negative net debt.
However, the comparison with history is limited: trailing-twelve-month EBITDA of $160.3 million was earned at high hydrocarbon prices. If prices fall, the multiple will rise even if the share price stays unchanged. Therefore the current valuation is attractive only if the price environment holds.
Valuation on the latest reported figures
| Metric | Value |
|---|---|
| Market cap | 1.34 bn USD |
| P/E (LTM) | 12.9 |
| EV/EBITDA (LTM) | 8.1 |
| P/B | 4.40 |
| Net debt / EBITDA (LTM) | -0.33 |
| Operating cash flow (LTM) | 0.17 bn |
| ROE | 37.2% |
| Dividend yield (12m) | 12.4% |
| EV/EBITDA, 3-year average | 10.4 |
Bottom line
The strong point of the report was net profit: $27.6 million for the quarter, up 146.9% year on year with a 53.7% margin. However, revenue growth decelerated from 73.1% in the second quarter to 45.2% in the third, and actual revenue almost exactly matched the model, suggesting no unexpected price gain. Net debt is negative, the 12.4% dividend yield is high, and EV/EBITDA of 8.1 is below its own three-year average. The main question for a holder is not current profit but the company's ability to extend its reserve life, which now stands at just 3.2 years.
Open the company's financial profile DMLP →
See also: market overview · valuation map · stock screeners