Daqo New Energy: revenue recovered to $194m, but every kilogram of polysilicon sold is still loss-making
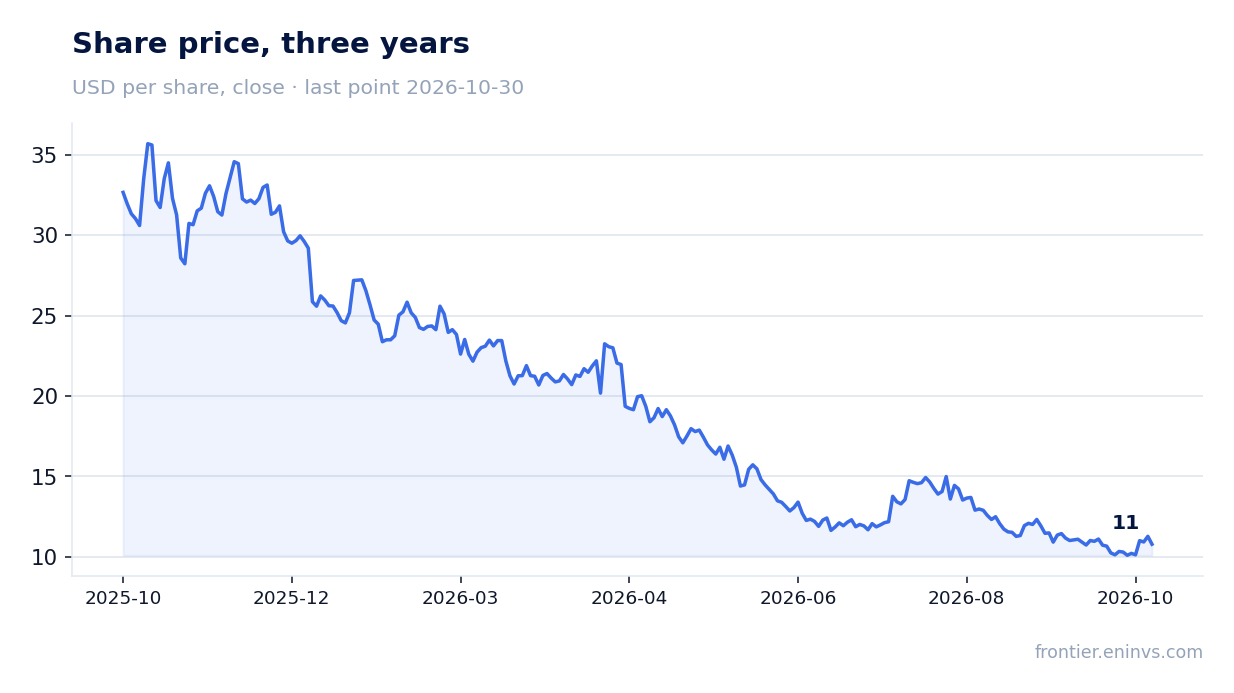
Daqo New Energy reported third-quarter 2026 results with polysilicon prices still below cost: revenue came in at $194.2m, down 20.7% year on year, EBITDA was -$78.6m and the net loss $52.9m. Operating cash flow was nevertheless positive at $61.2m, with capital expenditure of $38.8m. At a market capitalisation of $725.4m against net cash of $849.2m the share trades below its cash cushion, but a persistently loss-making production economics keeps it unattractive.
Key takeaways
— Revenue tripled quarter on quarter but is still down 20.7% year on year
— EBITDA of -$78.6m implies a -40.5% margin versus a positive 15.3% a year earlier
— The $52.9m net loss is smaller than the operating loss thanks to financial income on the cash cushion
— Operating cash flow of $61.2m is positive, but $38.8m of capex absorbs most of it
— Net cash of $849.2m exceeds the $725.4m market capitalisation, yet that does not make production profitable
— Return on equity of -4.8% shows the loss is already eroding book value
Attractiveness
Key figures, USD bn
| Metric | Q3 2025 | Q3 2026 | Change |
|---|---|---|---|
| Revenue | 0.24 | 0.19 | -20.7% |
| EBITDA | 0.04 | -0.08 | -310.0% |
| Operating profit | -0.02 | -0.08 | — |
| Net profit | -0.01 | -0.05 | — |
| Operating cash flow | 0.06 | 0.06 | +10.1% |
| Capex | 0.03 | 0.04 | +19.3% |
| EBITDA margin | 15.3% | -40.5% | -55.8 pp |
| Net margin | -6.1% | -27.2% | -21.1 pp |
Revenue tripled quarter on quarter but is still down 20.7% year on year
Third-quarter 2026 revenue was $194.2m versus $62.7m in the second quarter – nearly a threefold increase. This is a recovery from the collapse at the start of the year, when first-quarter revenue fell to $26.7m. Against the third quarter of 2025, however, when $244.9m of product was sold, revenue declined 20.7%.
The deceleration in the annual dynamic is clear: the decline was 17.0% in the second quarter and 20.7% in the third. The quarterly recovery is driven mainly by shipment volumes rather than prices: the polysilicon market remains oversupplied, and prices have not returned to levels at which production is profitable.
For an investor this means the company is increasing physical sales but cannot earn on them. While prices are below cost, revenue growth only enlarges the operating loss.
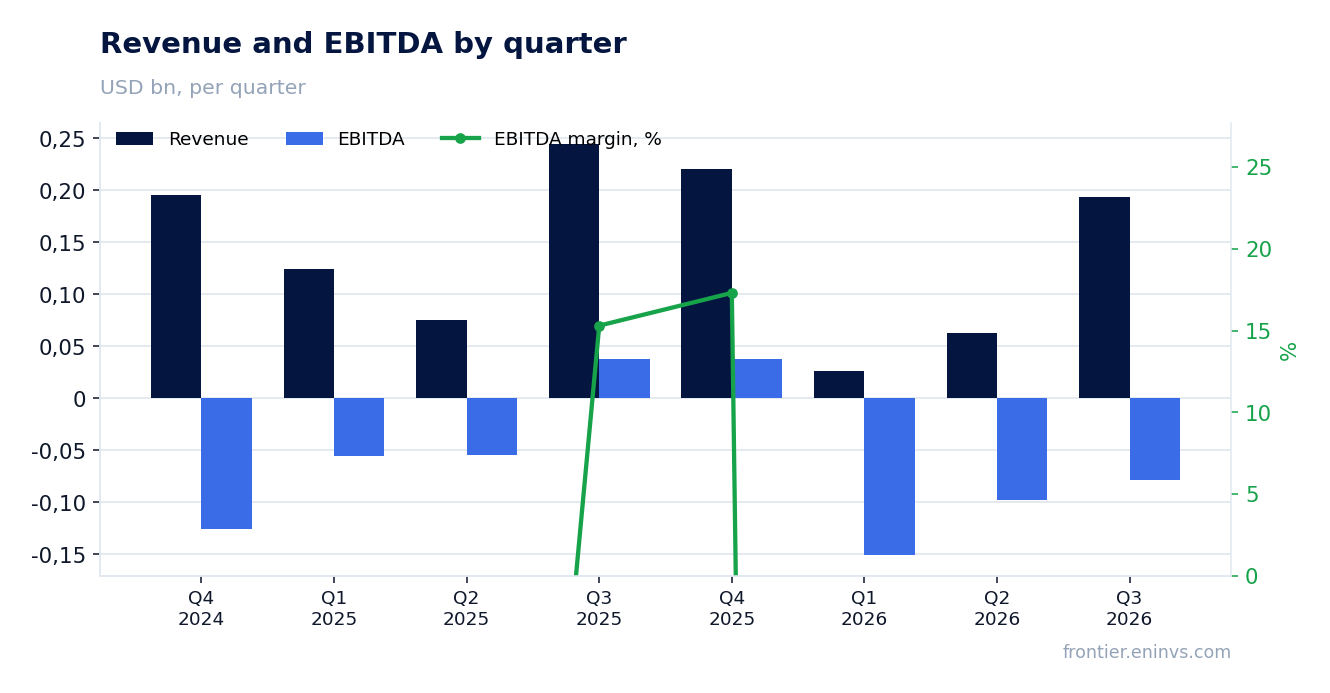
EBITDA of -$78.6m implies a -40.5% margin versus a positive 15.3% a year earlier
Third-quarter 2026 EBITDA was -$78.6m, and operating profit equals the same figure at -$78.6m. A year earlier EBITDA was positive at $37.4m with a 15.3% margin. Now the margin is -40.5%: every dollar of revenue brings 40 cents of operating loss.
The reason is that the polysilicon price does not cover variable and fixed costs. The company keeps operating to preserve market share and utilise capacity, but the economics of production remain negative. The 20.7% year-on-year revenue decline does not explain the full scale of the EBITDA drop – operating leverage is working in reverse.
A turnaround is possible only with a sustained rise in polysilicon prices. Until then EBITDA will stay negative, and no volume metric can compensate for that.
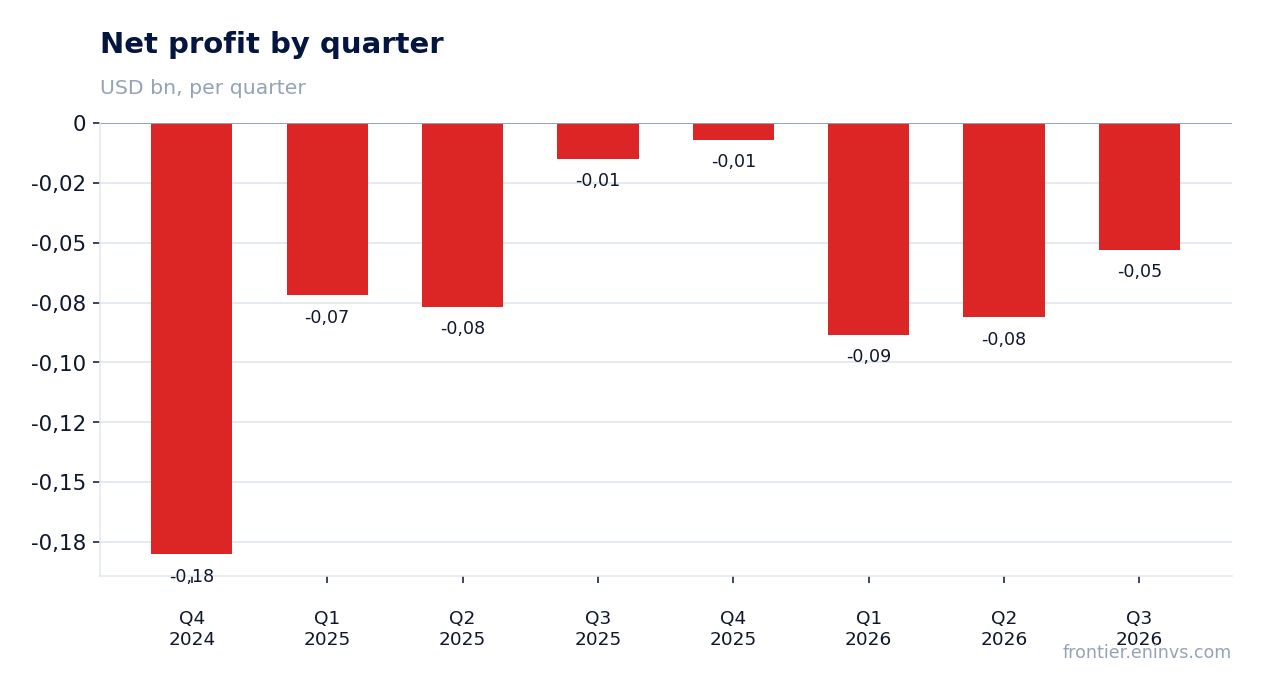
The $52.9m net loss is smaller than the operating loss thanks to financial income on the cash cushion
The third-quarter 2026 net loss was $52.9m against an operating loss of $78.6m. The $25.7m difference is financial income earned on the company's cash cushion. The net margin is -27.2% versus -6.1% a year earlier.
A year earlier the net loss was $14.9m with positive EBITDA – then the loss was driven mainly by non-cash items. Now negative EBITDA is an operating reality, and financial income only softens the bottom line.
This profit structure means the company lives off interest on accumulated cash rather than off production. That is sustainable only as long as the cash cushion does not start to shrink.
Operating cash flow of $61.2m is positive, but $38.8m of capex absorbs most of it
Third-quarter 2026 operating cash flow was $61.2m – a positive figure despite the loss. This is explained by working-capital release and non-cash items within the loss. Capital expenditure for the quarter was $38.8m, leaving about $22.4m of free cash flow.
Over the trailing twelve months operating cash flow is negative at -$115.3m. This means the quarterly improvement has not yet reversed the annual trend: in the first and second quarters of 2026 the outflow was $147.5m and $128.7m respectively.
The company continues to invest in capacity even with negative EBITDA. That supports future potential, but at current prices capex only adds to the burden on the cash cushion.
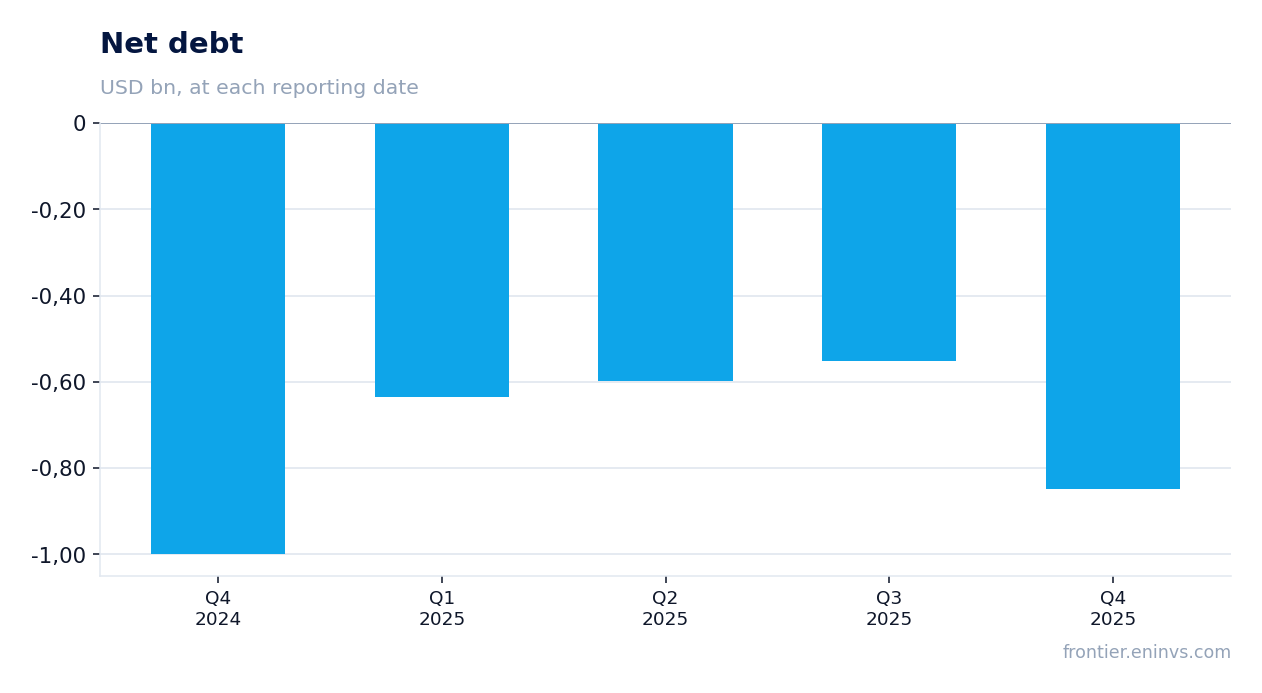
Net cash of $849.2m exceeds the $725.4m market capitalisation, yet that does not make production profitable
At the latest annual balance-sheet date the company's net cash was $849.2m – the cash cushion exceeds the $725.4m market capitalisation. Formally the share trades below the value of net cash, which creates an illusion of safety.
However, the cash cushion does not generate operating profit, only financial income. If losses continue, the cushion will shrink: over the trailing twelve months the operating outflow was $115.3m, and capex requires tens of millions more. At such a pace the margin of safety is measured in quarters, not years.
Return on equity of -4.8% confirms that the loss is already eroding book value. Cash exceeding market capitalisation is not a discount to fair value but a reflection of the market's disbelief in the company's ability to earn from its core business.
Return on equity of -4.8% shows the loss is already eroding book value
Return on equity over the trailing twelve months was -4.8%. This means every dollar of equity brings almost 5 cents of loss. If this dynamic persists, book value will decline, and with it the protection that the cash cushion provides.
The loss is formed not by one-off write-downs but by operating economics: EBITDA has been negative for three consecutive quarters – -$150.8m in the first quarter of 2026, -$98.1m in the second and -$78.6m in the third. Even with the improving trend, the quarterly figures remain deeply negative.
For an investor this means the company is not creating value but consuming what it has accumulated. Until polysilicon prices recover, return on equity will stay negative, and no one-off factors will change that.
Valuation on the latest reported figures
| Metric | Value |
|---|---|
| Market cap | 0.73 bn USD |
| P/B | 0.16 |
| Operating cash flow (LTM) | -0.12 bn |
| ROE | -4.8% |
Bottom line
The strong points of the report were positive operating cash flow of $61.2m and a recovery in revenue to $194.2m – nearly threefold quarter on quarter. That recovery, however, did not change the main picture: EBITDA has been negative for three consecutive quarters, and a -40.5% margin means production is loss-making at the operating level. The $52.9m net loss is softened by financial income on the cash cushion, but the cushion of $849.2m is no longer growing, and the trailing-twelve-month operating outflow was $115.3m. At a market capitalisation of $725.4m the share trades below net cash, but that does not make it attractive: the market values not the cash but the ability of the business to earn. Verdict – unattractive.
Open the company's financial profile DQ →
See also: market overview · valuation map · stock screeners