Eni: profit nearly quadrupled, but the margin compressed and the multiple sits above its own history
Eni's results for the third quarter of 2026, ended 30 September, showed revenue of USD 29,909.0 mn, up 26.6% year on year, EBITDA of USD 3,924.3 mn and net profit of USD 3,681.9 mn, up 292.1% from a year earlier. The EBITDA margin narrowed to 13.1% from 16.0%, while the net margin rose to 12.3% from 4.0%. Leverage stands at 1.88x LTM EBITDA, and EV/EBITDA of 8.3 compares with the company's own three-year average of 5.5. At the current price the share looks neutral: strong profit growth and a 3.1% dividend yield are offset by operating margin compression and a premium to its own history.
Key takeaways
— Revenue rose 26.6% year on year in the third quarter, an acceleration from 15.3% in the first quarter
— The EBITDA margin compressed to 13.1% from 16.0%, even as profit nearly quadrupled
— Net profit of USD 3,681.9 mn came in above operating profit of USD 2,139.1 mn
— Net debt of USD 25.7 bn at 1.88x EBITDA is a moderate load, but it rose by USD 1.9 bn over the year
— Operating cash flow of USD 5,007.6 mn covers interest and investment needs, but the dividend absorbs a visible share
— The 3.1% dividend yield is modest and hinges on the durability of profit
— EV/EBITDA of 8.3 is 51% above the company's own three-year average of 5.5 – the share is more expensive than its history
Attractiveness
Key figures, USD bn
| Metric | Q3 2025 | Q3 2026 | Change |
|---|---|---|---|
| Revenue | 23.6 | 29.9 | +26.6% |
| EBITDA | 3.77 | 3.92 | +4.1% |
| Operating profit | 1.39 | 2.14 | +53.6% |
| Net profit | 0.94 | 3.68 | +292.1% |
| Operating cash flow | 3.60 | 5.01 | +39.1% |
| EBITDA margin | 16.0% | 13.1% | -2.9 pp |
| Net margin | 4.0% | 12.3% | +8.3 pp |
Revenue rose 26.6% year on year in the third quarter, an acceleration from 15.3% in the first quarter
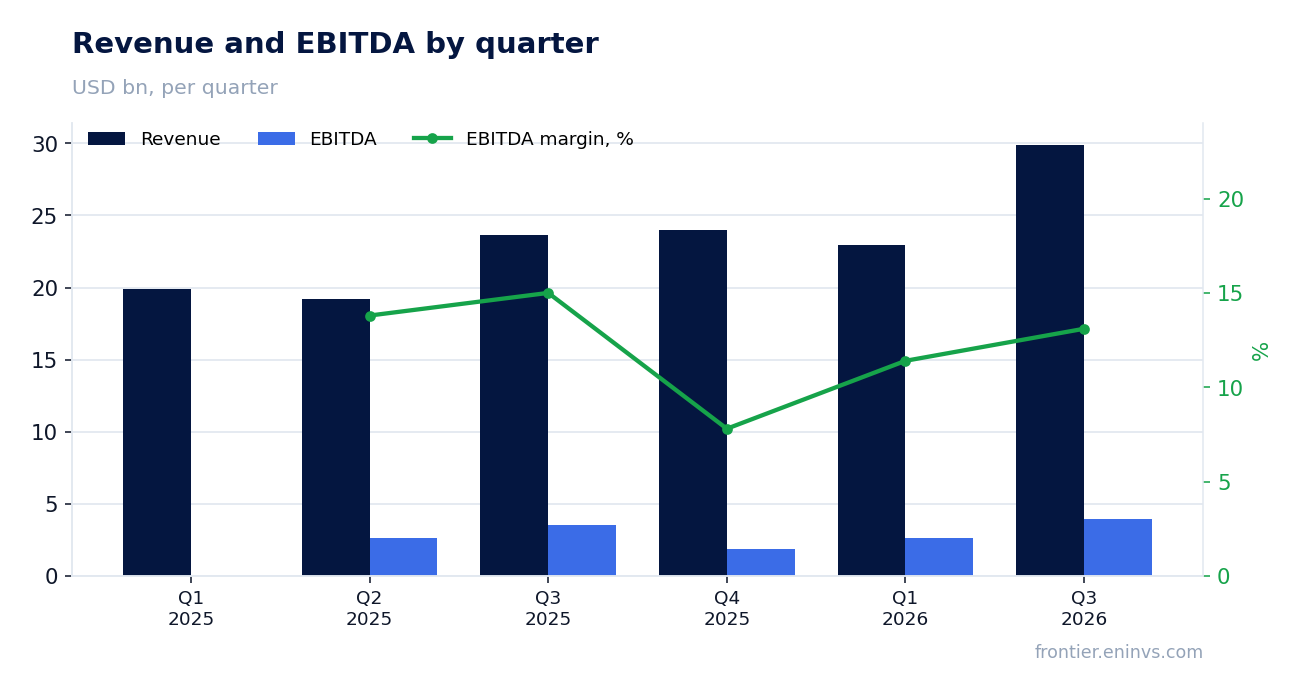
Revenue for the third quarter of 2026 was USD 29,909.0 mn, up 26.6% from the same quarter a year earlier. Growth was 15.3% in the first quarter, so the pace accelerated. The quarterly path within the year is uneven: after USD 22,971.3 mn in the first quarter, revenue in the second is not disclosed, but the third quarter is clearly above both the first quarter and the fourth quarter of 2025.
The acceleration rests on prices and volumes, but the facts provide no segment breakdown, so the exact contribution of upstream and downstream cannot be named. What matters is that revenue growth is not matched by operating profit growth: operating profit was USD 2,139.1 mn, below the first quarter of 2025. The company is selling more but earning less on each dollar of revenue.
The EBITDA margin compressed to 13.1% from 16.0%, even as profit nearly quadrupled
EBITDA for the third quarter was USD 3,924.3 mn, up just 4.1% year on year against revenue growth of 26.6%. As a result, the EBITDA margin fell to 13.1% from 16.0% a year earlier. This is the key operating fact of the report: revenue added a quarter, while EBITDA-level profitability barely grew.
Margin compression means costs grew faster than revenue. The facts give no line-item detail, so the specific cause – procurement, transport or royalties – cannot be named. But the effect is visible in absolute terms: with revenue near USD 30 bn, each percentage point of margin is worth about USD 300 mn, and the loss of three points is roughly USD 900 mn of EBITDA not earned relative to last year's proportion.
Net profit of USD 3,681.9 mn came in above operating profit of USD 2,139.1 mn
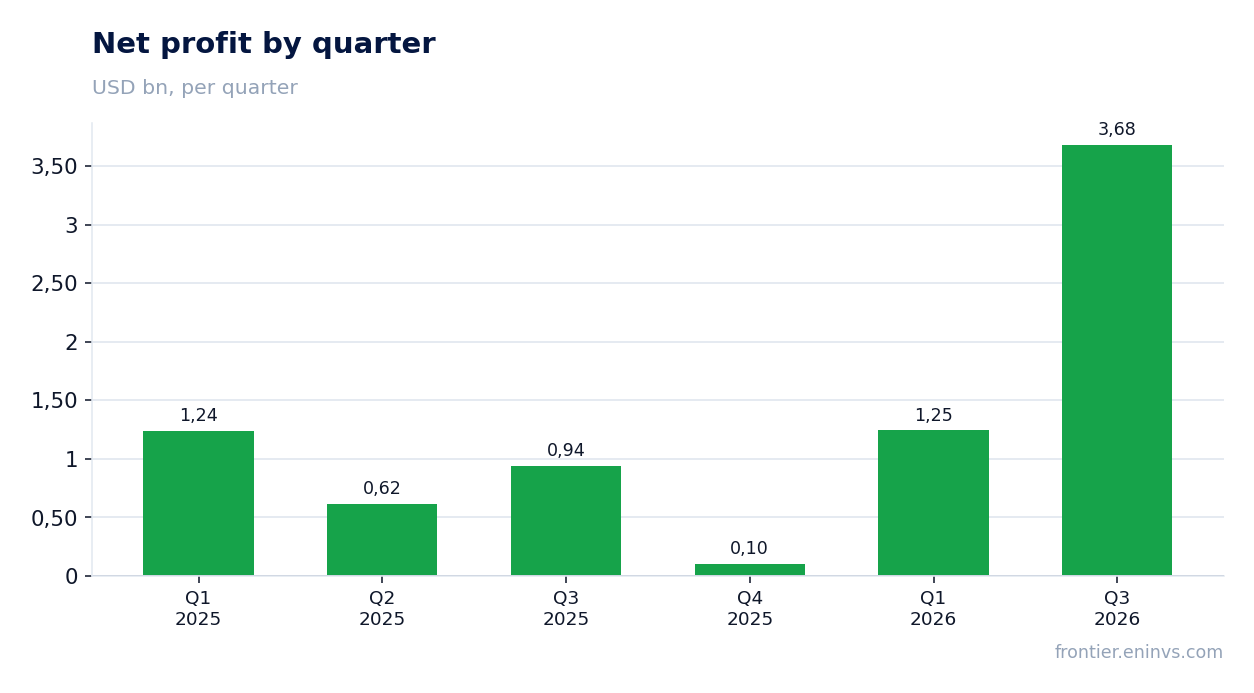
Net profit for the third quarter was USD 3,681.9 mn against USD 938.9 mn a year earlier, up 292.1%. Operating profit was USD 2,139.1 mn, so net profit exceeds operating profit by more than USD 1.5 bn. That relationship means a visible gain was booked below the operating line – likely financial items or one-offs – but the facts do not disclose its nature.
The net margin rose to 12.3% from 4.0%, which looks stronger than the operating trend. For assessing the durability of profit, it matters that operating profit of USD 2,139.1 mn is below the first quarter of 2025, when it was USD 3,915.5 mn. If the one-off gain does not repeat, next quarter's net profit will be closer to operating profit.
Net debt of USD 25.7 bn at 1.88x EBITDA is a moderate load, but it rose by USD 1.9 bn over the year
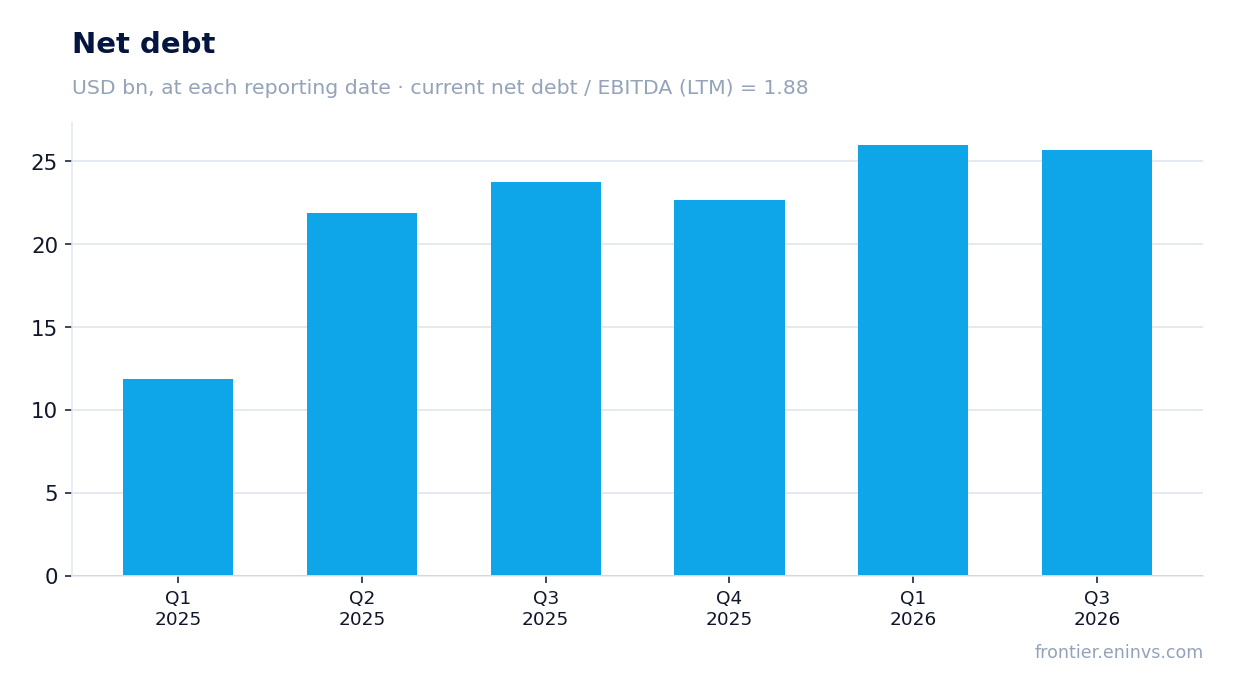
Net debt at 30 September 2026 was USD 25,688.4 mn, or USD 25.7 bn. The ratio to LTM EBITDA is 1.88x, moderate for an oil and gas company. From 31 March 2026 net debt fell from USD 26.0 bn to USD 25.7 bn, a change of USD 0.3 bn, while over twelve months it rose from USD 23.8 bn on 30 September 2025 by USD 1.9 bn.
The rise in debt over the year despite strong profit is explained by investment and shareholder payouts, but the facts give no cash-flow breakdown. What matters is that the 1.88x level creates no pressure on the balance sheet, but also leaves no room for new debt without EBITDA growth. Interest expense is not disclosed in the facts, so its coverage by cash flow cannot be assessed.
Operating cash flow of USD 5,007.6 mn covers interest and investment needs, but the dividend absorbs a visible share
Operating cash flow for the third quarter was USD 5,007.6 mn, above EBITDA of USD 3,924.3 mn. That means working capital released funds rather than absorbing them. The flow covers capital expenditure, the amount of which is not disclosed in the facts, and dividend payments.
The trailing twelve-month dividend yield is 3.1%, which at a market capitalisation of USD 90.0 bn corresponds to payouts of about USD 2.8 bn a year. That is roughly half of a quarterly operating flow, so the dividend is covered, but not with a large cushion. If EBITDA stays under pressure and debt keeps rising, room to increase payouts will narrow.
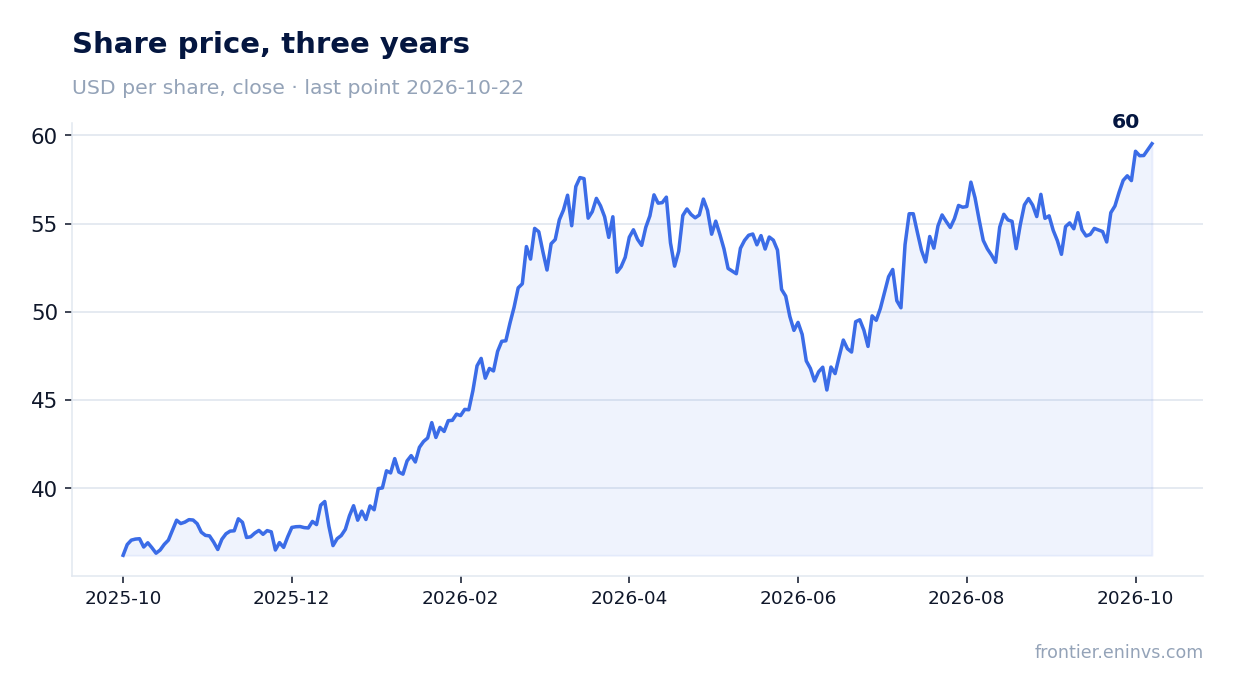
The 3.1% dividend yield is modest and hinges on the durability of profit
The last twelve months' payout gives a yield of 3.1% on the current price. For the oil and gas sector this is a moderate level, and it is lower than one might expect with quarterly profit of USD 3.7 bn. The reason is that a significant part of third-quarter profit is likely one-off, and the company is in no hurry to distribute it.
Our estimate for the current year's dividend assumes the payout stays at the level that produces a 3.1% yield, about USD 2.8 bn of payments. That depends on whether the one-off gain below the operating line repeats and on the company's willingness to add debt. If profit returns to the operating level of USD 2.1 bn a quarter, payouts could be cut.
The 3.1% yield is below the key rate, which is not given in the facts, but that is normal for equities. The main risk to the dividend is not debt but margin compression: with a 13.1% EBITDA margin and 26.6% revenue growth, the company earns less on each dollar, and that limits the payout base.
EV/EBITDA of 8.3 is 51% above the company's own three-year average of 5.5 – the share is more expensive than its history
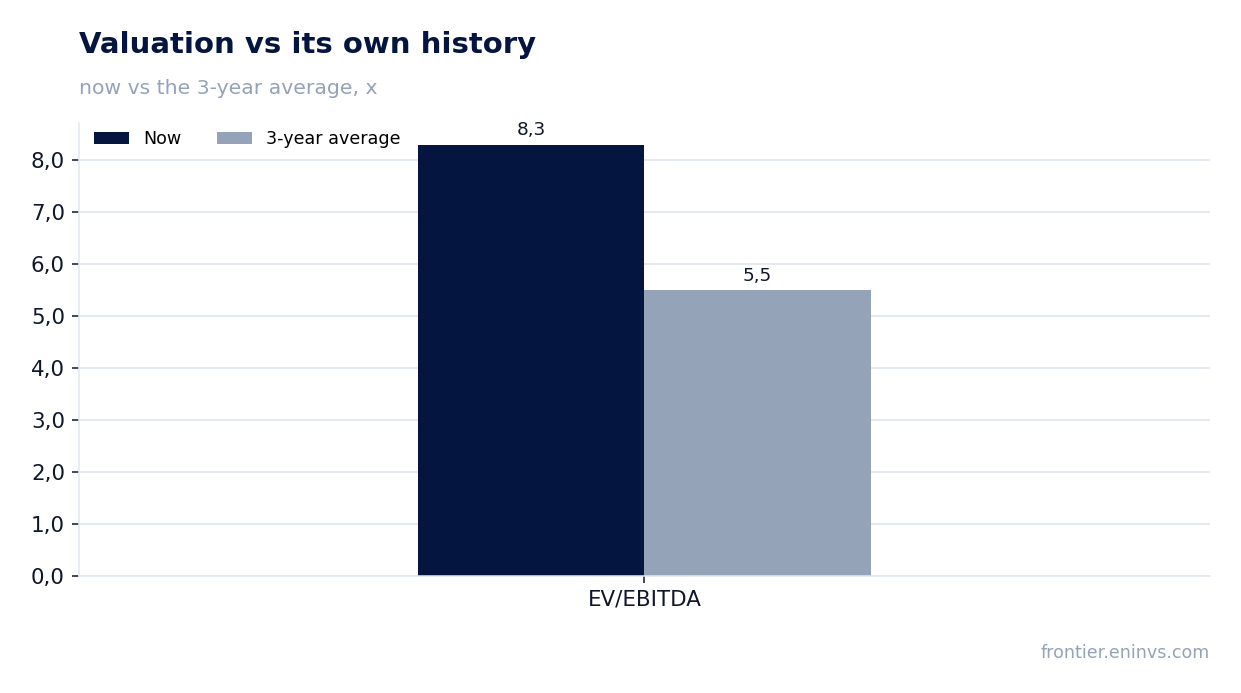
The LTM EV/EBITDA multiple is 8.3 against the company's own three-year average of 5.5. That is a 51% premium, meaning the market values the company above its three-year average. The LTM P/E is 28.9, also high for the oil and gas sector.
The premium is justified only if third-quarter profit is sustainable. But operating profit of USD 2,139.1 mn is below the first quarter of 2025, and the EBITDA margin compressed. On the portal's model, which re-prices EBITDA at current commodity prices at the target EV/EBITDA, the share's fair value is 5% below the current price. This is not a consensus but our own estimate.
For comparison: at a multiple at the three-year average of 5.5, the share would be significantly cheaper. The current price embeds a margin recovery that the report does not show. If the margin does not start rising next quarter, the premium to history will be hard to hold.
Valuation on the latest reported figures
| Metric | Value |
|---|---|
| Market cap | 90.0 bn USD |
| P/E (LTM) | 28.9 |
| EV/EBITDA (LTM) | 8.3 |
| P/B | 1.66 |
| Net debt / EBITDA (LTM) | 1.88 |
| ROE | 8.0% |
| Dividend yield (12m) | 3.1% |
| EV/EBITDA, 3-year average | 5.5 |
Bottom line
The strong side of the report is revenue: 26.6% growth, accelerating from 15.3% in the first quarter, and operating cash flow of USD 5,007.6 mn, which covers investment and the dividend. The weak side is the margin: EBITDA grew just 4.1%, the margin compressed to 13.1% from 16.0%, and operating profit of USD 2,139.1 mn is below last year's levels. Net profit of USD 3,681.9 mn looks impressive, but it exceeds operating profit, and its durability is in question. Net debt of USD 25.7 bn at 1.88x EBITDA is moderate, and the 3.1% dividend yield is modest. The share trades at a 51% premium to its own three-year EV/EBITDA average, and on the portal's model fair value is 5% below the current price. The verdict is neutral: revenue and cash-flow growth are balanced by margin compression and a rich valuation.
Open the company's financial profile E →
See also: market overview · valuation map · stock screeners