Eldorado Gold: profit doubled, but free cash flow was eaten by construction and debt
Eldorado Gold's third-quarter 2026 results showed revenue of $511.9 million (+19.1% year on year) and net profit of $118.0 million (+112.9%), with the net margin rising to 23.0% from 12.9% a year earlier. Yet operating cash flow was only $134.8 million against capital expenditure of $444.0 million, and net debt reached $1.44 billion at the end of September. At the current price the share looks neutral: revenue growth accelerated, but the EV/EBITDA multiple is above its own three-year history, and the portal's model implies a downside of 29%.
Key takeaways
— Revenue accelerated to +19.1% year on year from +7.9% a quarter earlier, the fastest pace since the first quarter of 2026
— Net profit rose 112.9% to $118.0 million, lifting the net margin to 23.0% from 12.9%
— Operating cash flow of $134.8 million does not cover capital expenditure of $444.0 million
— Net debt rose from $0.2 billion on 30 September 2025 to $1.4 billion on 30 September 2026
— Net debt to LTM EBITDA stands at 1.39 – a level, not a direction
— Trailing twelve-month dividend yield is only 0.72%, so the payout is not the main argument for the share
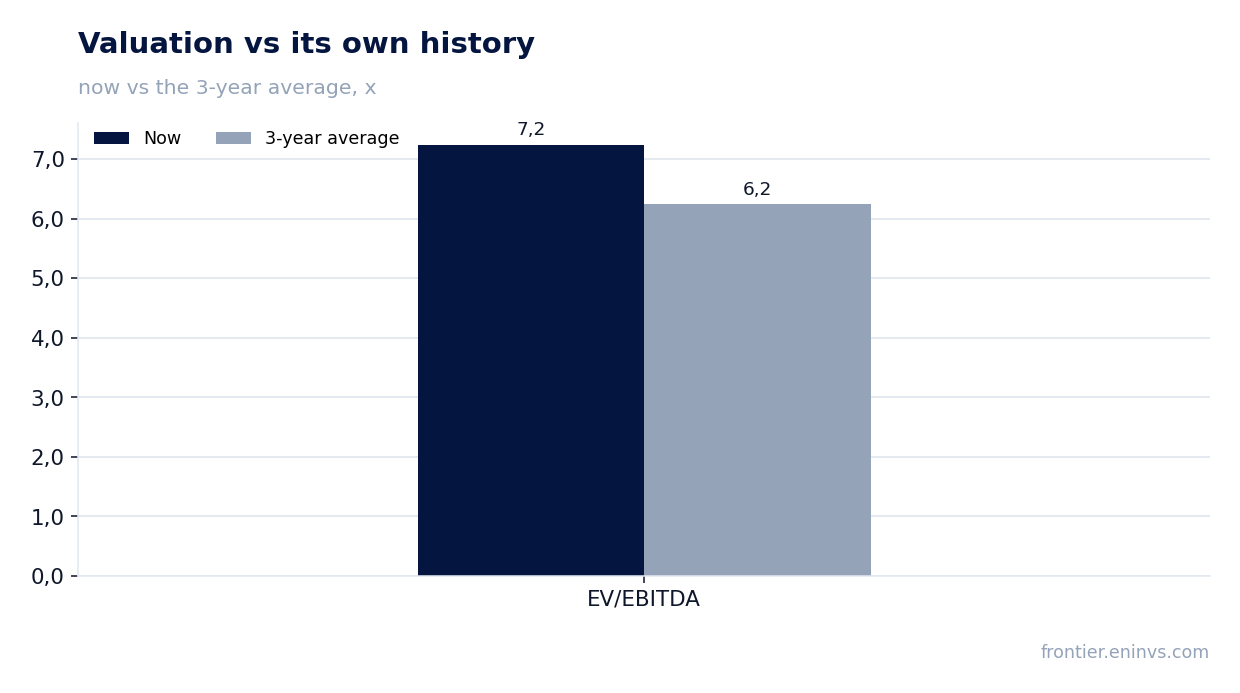
— LTM EV/EBITDA of 7.2 is above its own three-year average of 6.2, and the portal model implies a 29% downside
Attractiveness
Key figures, USD bn
| Metric | Q3 2025 | Q3 2026 | Change |
|---|---|---|---|
| Revenue | 0.43 | 0.51 | +19.1% |
| EBITDA | 0.23 | — | — |
| Operating profit | 0.17 | 0.21 | +26.0% |
| Net profit | 0.06 | 0.12 | +112.9% |
| Operating cash flow | 0.13 | 0.13 | +3.1% |
| Capex | 0.24 | -0.44 | -283.3% |
| EBITDA margin | 54.6% | — | — |
| Net margin | 12.9% | 23.0% | +10.1 pp |
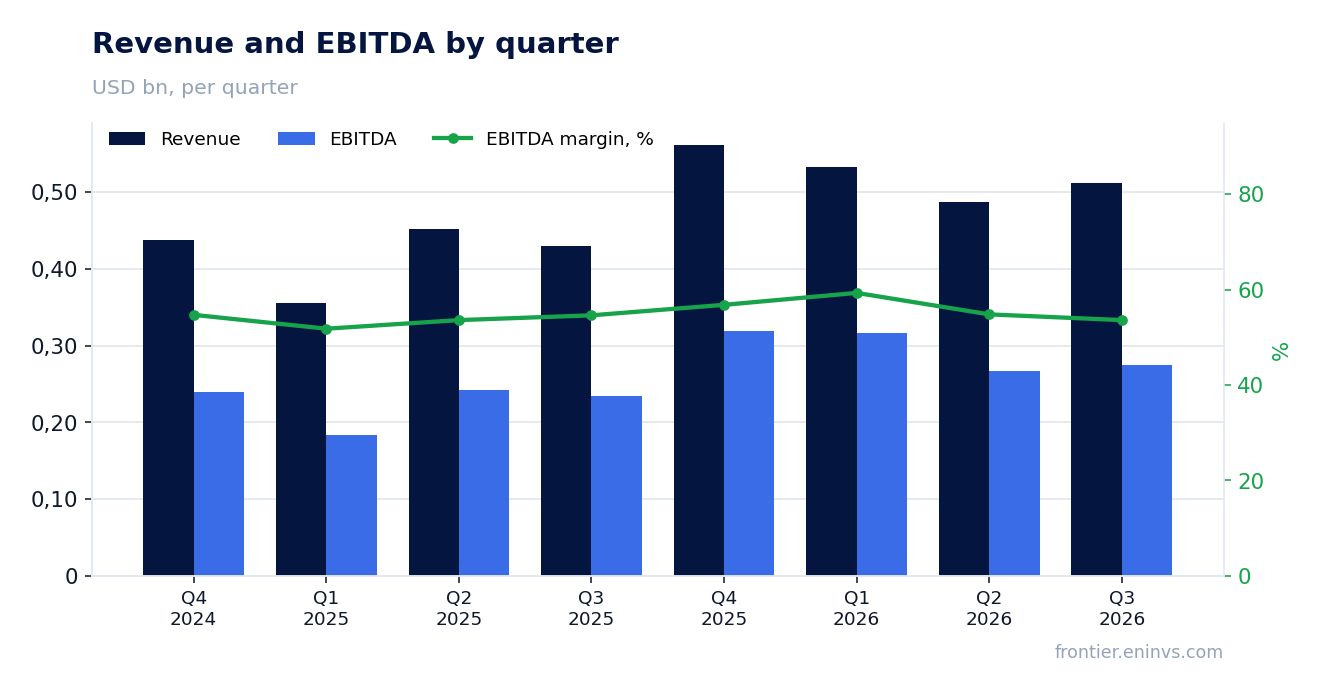
Revenue accelerated to +19.1% year on year from +7.9% a quarter earlier, the fastest pace since the first quarter of 2026
In the third quarter of 2026 Eldorado Gold's revenue was $511.9 million, 19.1% more than a year earlier. A quarter earlier growth was a more modest 7.9%, so the current pace is an acceleration. This is the fastest growth since the first quarter of 2026, when revenue rose 50.0%.
The acceleration rests on a sustained level of sales: revenue has held above $500 million for two consecutive quarters after $487.5 million in the second quarter. A year earlier, in the third quarter of 2025, revenue was $429.9 million, so the comparison base remains low.
To judge sustainability, it matters that the growth is not accompanied by falling prices: the facts do not disclose volumes or prices, so the cause of the acceleration can only be tied to the overall revenue dynamic. The next report will show whether the pace above 15% holds.
Net profit rose 112.9% to $118.0 million, lifting the net margin to 23.0% from 12.9%
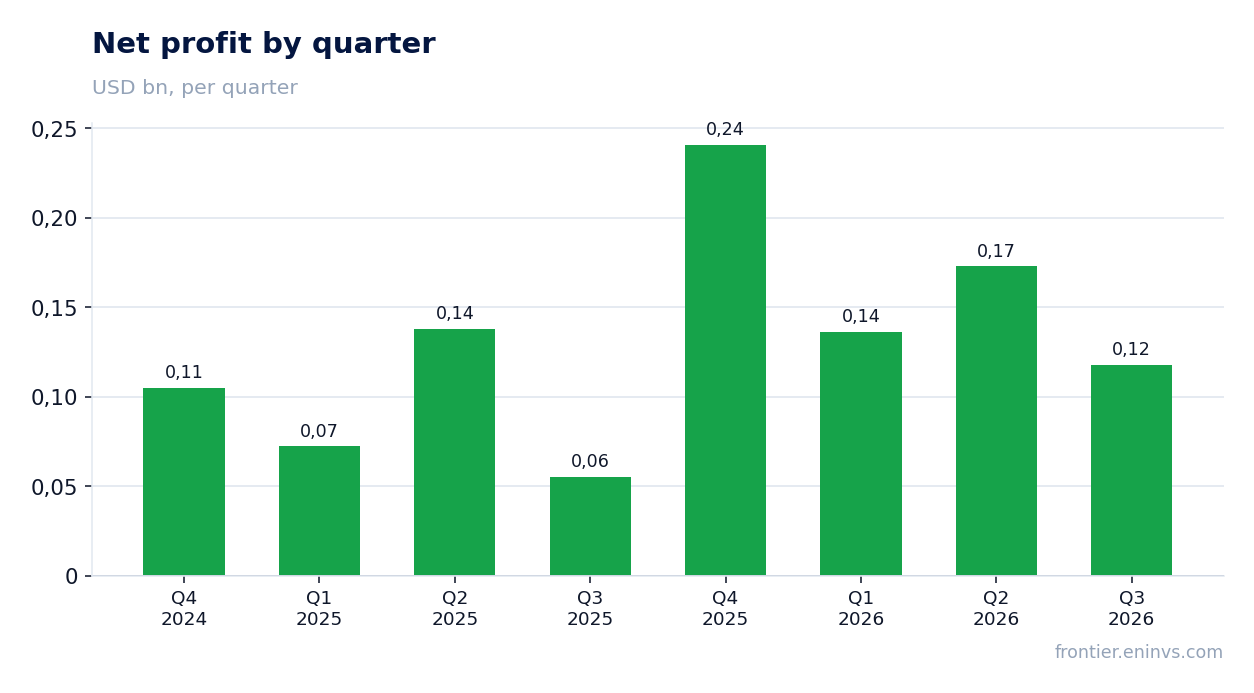
Net profit in the third quarter of 2026 was $118.0 million against $55.4 million a year earlier. The net margin reached 23.0%, versus 12.9% in the third quarter of 2025. Operating profit rose to $214.9 million from $170.6 million.
Profit nearly doubling on 19.1% revenue growth means the margin widened beyond the top line. Operating profit added 26%, faster than revenue, pointing to lower relative costs. The facts do not break costs down by line, so the specific item behind the effect cannot be named.
Profit over the last twelve months was $668.0 million on revenue of $2,100.0 million. The quarterly profit of $118.0 million is below the average for that period, which points to uneven results between quarters.
Operating cash flow of $134.8 million does not cover capital expenditure of $444.0 million
Operating cash flow in the third quarter of 2026 was $134.8 million, while capital expenditure was $444.0 million. The $309.2 million gap means the investment programme is funded from sources other than current operations.
Over the last twelve months operating cash flow was $296.1 million, and capital expenditure in the third quarter alone was almost twice that annual figure. This burden explains why net debt is rising: the company is investing faster than it generates cash.
For a shareholder this means free cash flow remains negative, and the dividend base is not formed from free cash flow. As long as capital expenditure exceeds operating cash flow, debt will rise or stay high.
Net debt rose from $0.2 billion on 30 September 2025 to $1.4 billion on 30 September 2026
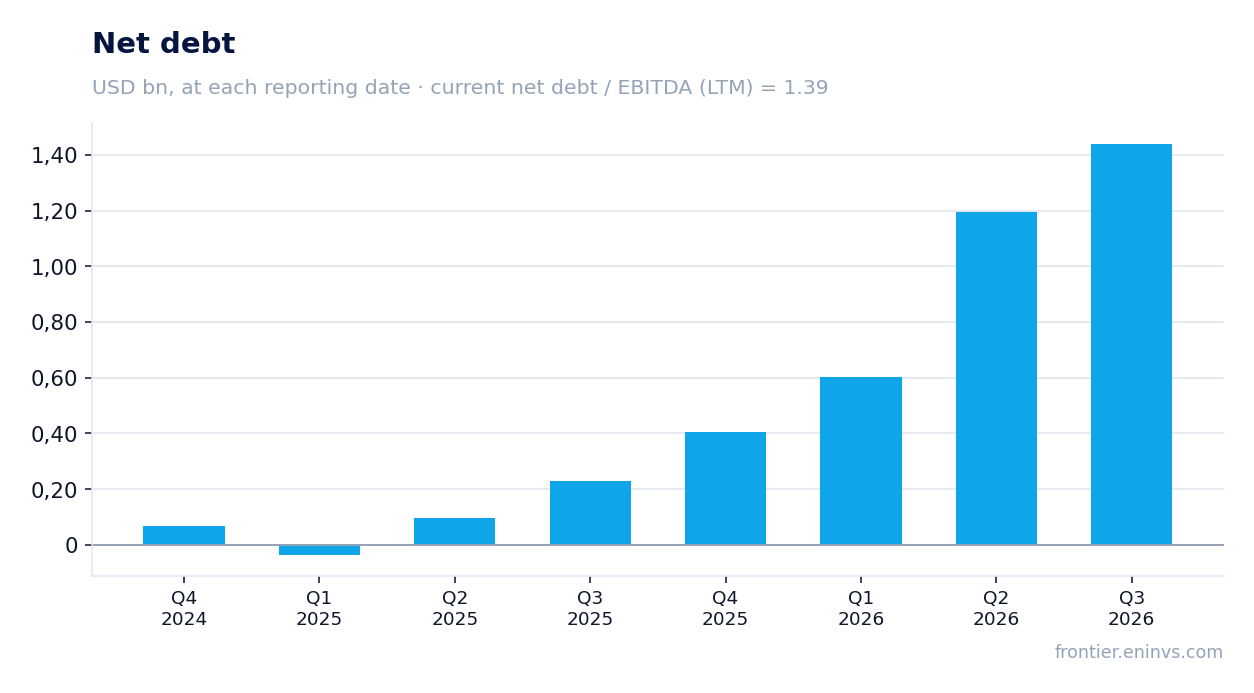
Net debt on 30 September 2026 was $1.44 billion. A year earlier, on 30 September 2025, it was $0.2 billion, so it rose by $1.2 billion over twelve months. During the second quarter of 2026 debt increased from $1.2 billion on 30 June to $1.4 billion on 30 September.
Net debt to LTM EBITDA stands at 1.39. That is a moderate level for a capital-intensive industry, but it reflects the current state, not the direction: the facts do not include an earlier value of this ratio, so one cannot claim leverage is rising or falling.
The rise in debt is directly tied to capital expenditure, which reached $444.0 million in the third quarter. If the investment programme continues at the same scale, the debt burden will remain significant.
Net debt to LTM EBITDA stands at 1.39 – a level, not a direction
The net debt / EBITDA ratio for the last twelve months is 1.39. This means debt is covered by annual EBITDA of $1,035.6 million in less than a year and a half. For a mining company this is an acceptable level, but it says nothing about whether the situation is improving or worsening.
The facts do not include an earlier value of this ratio, so any claim about rising or falling leverage would be speculation. One can only note that at the end of September 2026 debt was 1.39 times annual EBITDA.
The debt level matters for risk assessment: if gold prices fall, EBITDA may shrink, and the ratio would rise even without new borrowing.
Trailing twelve-month dividend yield is only 0.72%, so the payout is not the main argument for the share
The trailing twelve-month dividend yield is 0.72%. That is a low level that does not compensate for the risk tied to capital intensity and debt. With a market capitalisation of $7,078.5 million, annual payments amount to about $51 million.
Our estimate for the current year's dividend assumes the company maintains the current payout: free cash flow is negative, and the dividend is not funded from it. If capital expenditure stays at $444.0 million a quarter, a payout increase is unlikely.
A yield of 0.72% is well below the key rate, so for an income-oriented investor the share holds little appeal. The dividend here is an addition to the growth story rather than the main motive.
LTM EV/EBITDA of 7.2 is above its own three-year average of 6.2, and the portal model implies a 29% downside
The LTM EV/EBITDA multiple is 7.2, while its own three-year average is 6.2. The share trades 16% above its historical valuation, which limits upside. The LTM P/E is 10.6, which does not look expensive, but EV/EBITDA accounts for debt that has risen to $1.44 billion.
On the portal's model, which re-prices EBITDA at current commodity prices at the target EV/EBITDA, the fair value of the share is 29% below the current market price. This is our own estimate, not a market consensus.
The combination of revenue and profit growth with an expensive valuation and negative free cash flow creates an ambiguous picture. A revision of the verdict upwards would require either sustained EBITDA growth or lower capital expenditure.
Valuation on the latest reported figures
| Metric | Value |
|---|---|
| Market cap | 7.08 bn USD |
| P/E (LTM) | 10.6 |
| EV/EBITDA (LTM) | 7.2 |
| P/B | 1.65 |
| Net debt / EBITDA (LTM) | 1.39 |
| Operating cash flow (LTM) | 0.30 bn |
| ROE | 6.8% |
| Dividend yield (12m) | 0.7% |
| EV/EBITDA, 3-year average | 6.2 |
Bottom line
The strong side of the report was revenue growth to $511.9 million, accelerating to 19.1%, and a doubling of net profit to $118.0 million. Yet this result came with negative free cash flow: capital expenditure of $444.0 million was more than three times operating cash flow. Net debt rose to $1.44 billion, and the dividend yield remains low at 0.72%. The key question for a holder now is whether the company can slow investment and start generating free cash without sacrificing growth. Until that is answered, the share looks neutral.
Open the company's financial profile EGO →
See also: market overview · valuation map · stock screeners