VAALCO Energy: Brent up 34% but the quarter closed with a $39.8m loss
On 6 November VAALCO Energy released its third-quarter 2026 results. The average Brent price in the period was $91.3 per barrel against $68 a year earlier, and on that backdrop revenue rose 141.0% to $147.0m. Yet the net result was a loss of $39.8m against a $1.1m profit a year earlier, and on our calculation at last year's volumes and costs revenue should have been only $81.9m – meaning the company sold substantially more than price alone implied. With EV/EBITDA LTM at 12.2 against its own three-year average of 1.7 the share looks expensive, and the portal's model puts fair value 90% below the market; the verdict is unattractive.
Key takeaways
— Brent rose 34.2% year on year, but revenue rose 141.0% – volume and realised price did more than price alone
— On our calculation at last year's volumes and costs revenue would have been $81.9m; the actual $147.0m is $65.1m higher
— A net loss of $39.8m on revenue of $147.0m – a net margin of -27.1% against +1.8% a year earlier
— Leverage at 3.53x EBITDA LTM is a level that leaves no cushion in a loss-making quarter
— A 4.68% dividend yield in a loss-making quarter with high leverage rests on past cash flow, not current profit
— EV/EBITDA LTM of 12.2 against its own three-year average of 1.7 – the share is 640% more expensive than its history
— Reserves cover 3.9 years of production – a short base for valuing future cash flows
Attractiveness
Key figures, USD bn
| Metric | Q3 2025 | Q3 2026 | Change |
|---|---|---|---|
| Revenue | 0.06 | 0.15 | +141.0% |
| EBITDA | 0.02 | — | — |
| Operating profit | 0.00 | — | — |
| Net profit | 0.00 | -0.04 | -3714.9% |
| Operating cash flow | 0.02 | — | — |
| Capex | 0.05 | — | — |
| EBITDA margin | 35.2% | — | — |
| Net margin | 1.8% | -27.1% | -28.9 pp |
Brent rose 34.2% year on year, but revenue rose 141.0% – volume and realised price did more than price alone
The average Brent price in the third quarter of 2026 was $91.3 per barrel against $68 a year earlier, up 34.2%. Against the previous quarter the price fell 5.6% from $96.8, and spot on 6 November is $100, 9.5% above the reported-period average.
Revenue for the quarter was $147.0m, up 141.0% from $61.0m a year earlier. That growth far outpaces the price: on our calculation at last year's volumes and costs revenue would have been $81.9m, so the price effect contributed only $20.9m. The remaining $65.1m did not come from price – it is either higher production and sales volumes, a realised price above Brent, or one-off receipts. The facts and the source do not disclose the causes, so we record the gap itself without attributing it to a specific factor.
The acceleration in revenue growth against the previous quarter is clear: in the second quarter of 2026 growth was 39.5%, in the third 141.0%. But that jump is exactly what creates the main question of the report: if price explains only a third of the increase, the durability of the rest needs checking in the next quarter.
Commodity prices: period average and now
| Benchmark | Year ago | Q3 2026 | YoY | Spot 2026-11-06 |
|---|---|---|---|---|
| Brent, USD | 68,0 | 91,3 | +34,2% | 100,0 |
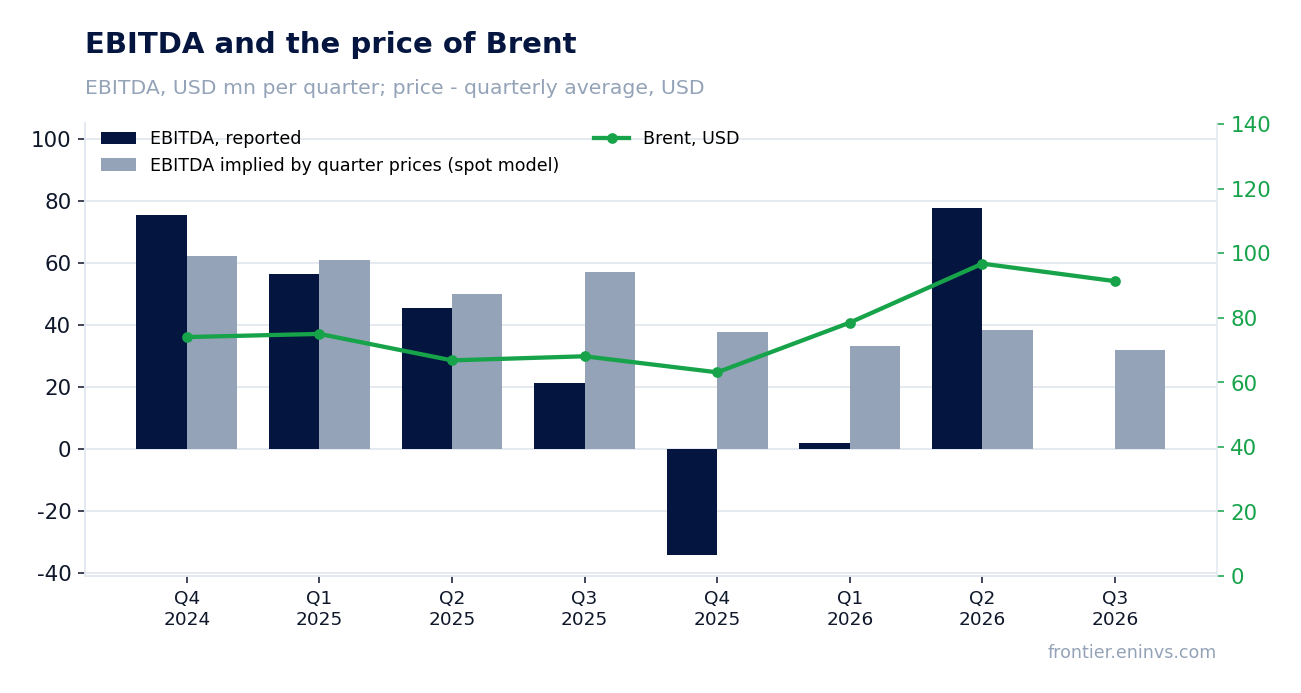
On our calculation at last year's volumes and costs revenue would have been $81.9m; the actual $147.0m is $65.1m higher
Our 'what should have been' calculation holds last year's volumes and non-commodity costs and moves only price. At $91.3 instead of $68 revenue would have been $81.9m and EBITDA $42.3m. Actual revenue of $147.0m is $65.1m, or 79.5%, above that.
The portal's spot model, built from the average of the previous four quarters re-priced to current prices, expected revenue of $104.2m and EBITDA of $31.8m. Actual revenue is 41.1% above even that. The deviation of actual EBITDA from the model over the four prior periods ranged from -190.1% to +102.5%, so the model has historically predicted this issuer poorly.
Both estimates agree on one point: the company sold substantially more than price and normal volume explain. The facts do not name the cause. Until it is known, the quarter's profit cannot be treated as recurring, and it is on that recurrence that the share's valuation rests.
What the prices implied and what the company earned
| Base (Q3 2025) | Implied at period prices | Reported | Reported vs implied | |
|---|---|---|---|---|
| Revenue, USD mn | 61,0 | 81,9 | 147,0 | +79,5% |
| EBITDA, USD mn | 21,5 | 42,3 | — | — |
| EBITDA, portal spot model, USD mn | — | 31,8 | — | — |
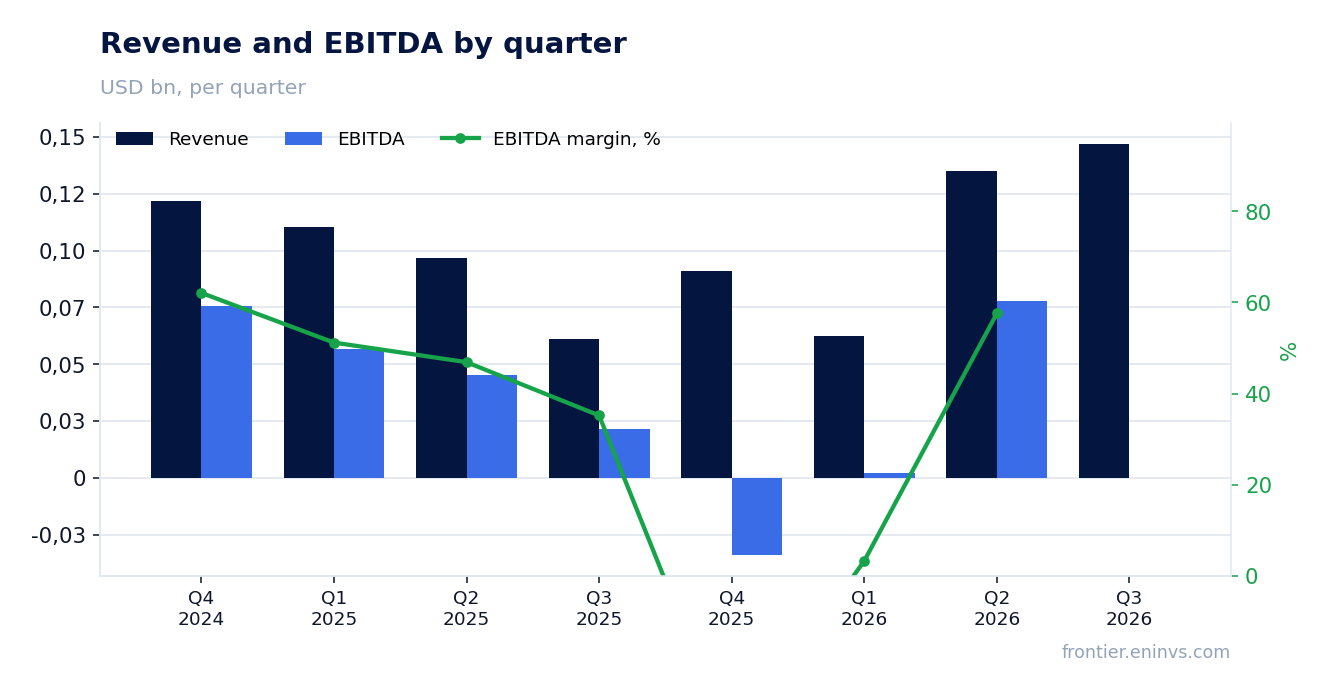
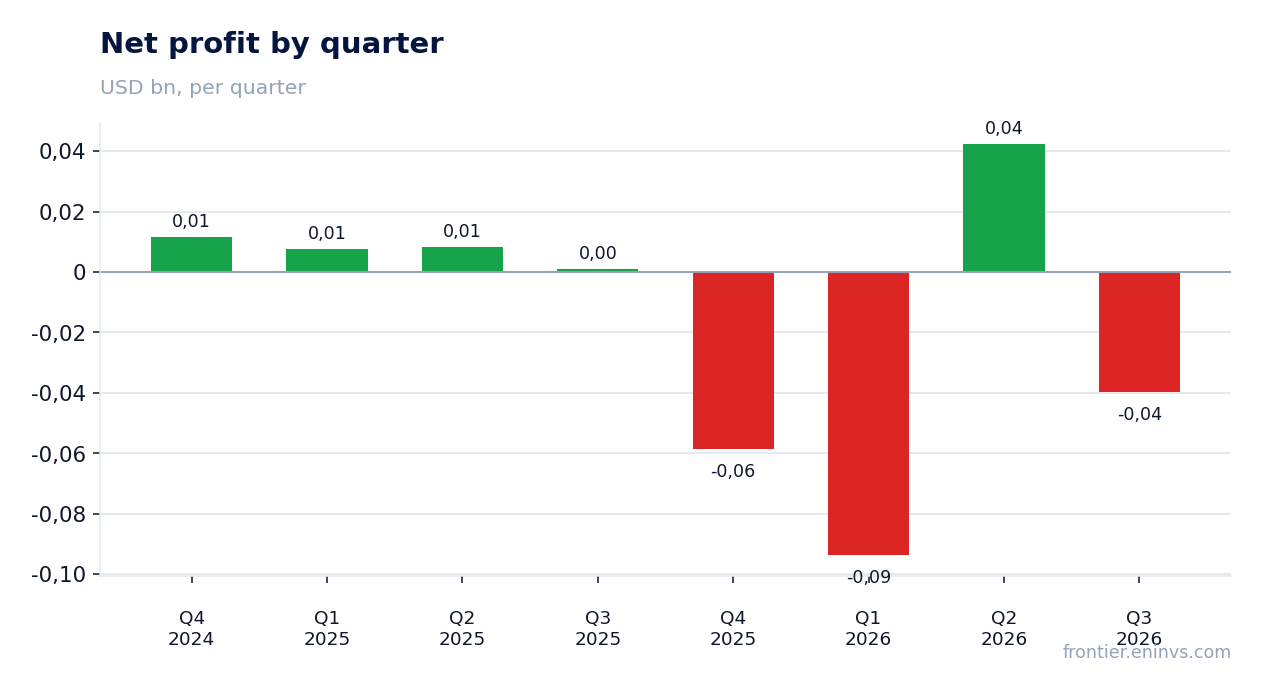
A net loss of $39.8m on revenue of $147.0m – a net margin of -27.1% against +1.8% a year earlier
On revenue of $147.0m the company posted a net loss of $39.8m. A year earlier, on revenue of $61.0m, it earned $1.1m, a net margin of 1.8%. Now it is -27.1%.
A loss on the company's record revenue means costs below the operating line outweighed gross profit. The facts do not disclose those items, so we do not name a cause. What matters is that 141.0% revenue growth did not turn into profit: the link between the oil price and the bottom line broke in this quarter.
For a holder this is the report's main signal. If the loss is one-off – a revaluation or a write-down – the next quarter will show recovery. If it reflects the cost or liability structure, then a high Brent price no longer rescues the result, and that changes the assessment of the company.
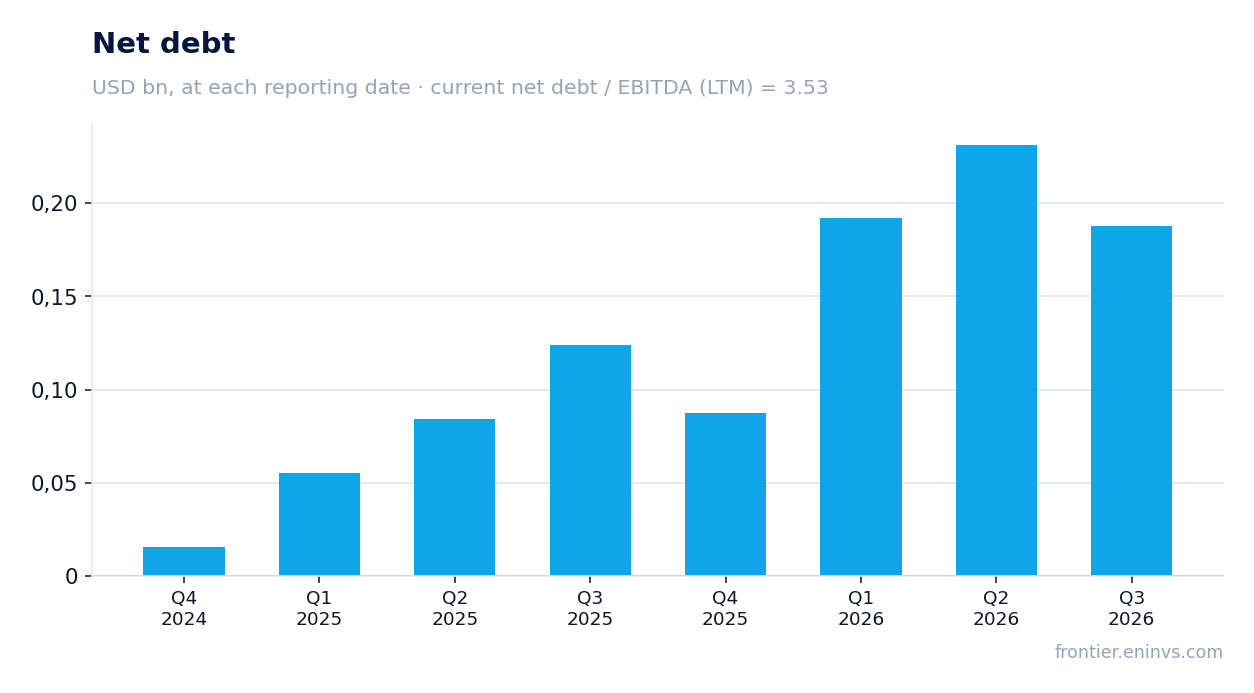
Leverage at 3.53x EBITDA LTM is a level that leaves no cushion in a loss-making quarter
Net debt at 30 September 2026 was $187.7m, or $0.2bn. Against EBITDA of $53.2m over the last twelve months that is 3.53x – a level at which half of annual EBITDA services debt on the current base.
Net debt barely moved in the quarter: $0.2bn at 30 June and $0.2bn at 30 September. Over twelve months it rose from $0.1bn at 30 September 2025 to $0.2bn, roughly $0.1bn. The direction of the ratio is not given in the facts, so we quote the level only.
A loss combined with 3.53x leverage means the company cannot afford another weak quarter without pressure on the balance sheet. At a Brent price of $100 there is room, but it is thin, and a short reserve base of 3.9 years limits the time in which that room can be widened.
A 4.68% dividend yield in a loss-making quarter with high leverage rests on past cash flow, not current profit
The trailing twelve-month dividend yield is 4.68% on a market capitalisation of $566.5m. Payments over the reported period rest on cash flow from earlier quarters, not on third-quarter profit, which closed with a $39.8m loss.
Our estimate of the current-year dividend rests on cash flow rather than profit: with a loss the payout base narrows, and everything depends on how durable operating cash flow is at a Brent price near $100. If the loss is one-off, the payout holds; if it reflects costs, the dividend will have to be cut.
A 4.68% yield against a key rate not given in the facts cannot be called unambiguously attractive: with 3.53x leverage and a loss the market demands a risk premium, and the current yield does not cover it. A smaller payout could come either from a repeat loss or from the need to direct cash flow to debt.
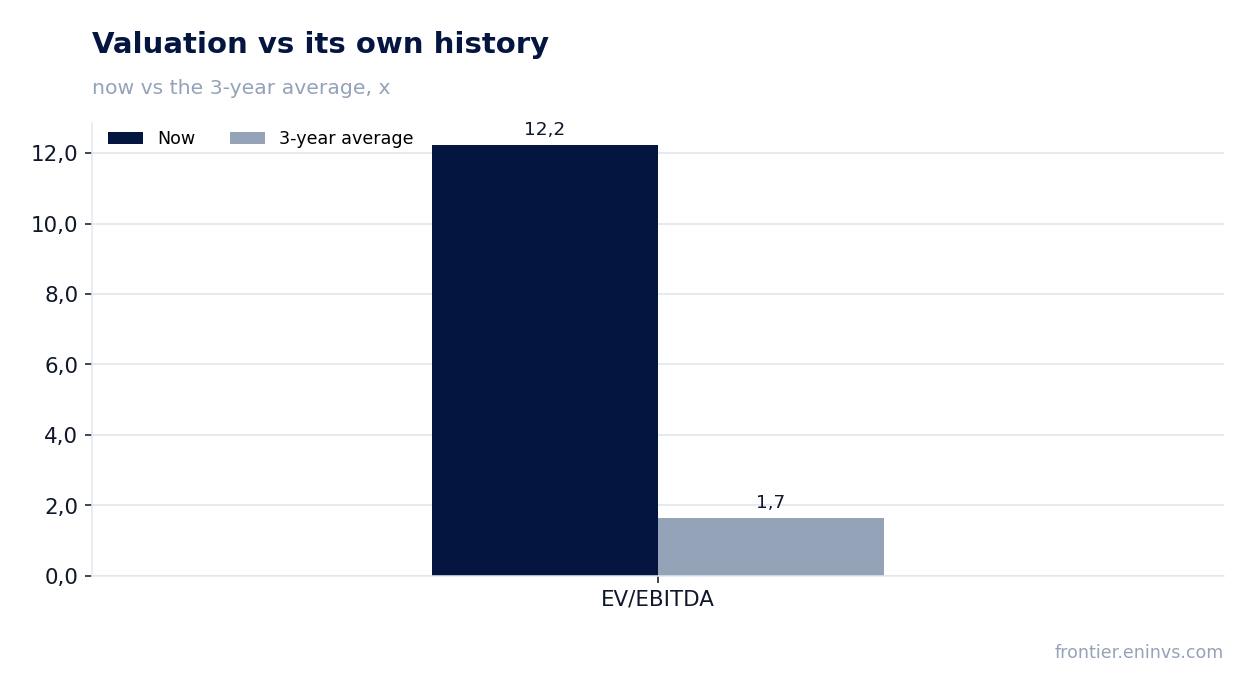
EV/EBITDA LTM of 12.2 against its own three-year average of 1.7 – the share is 640% more expensive than its history
EV/EBITDA over the last twelve months is 12.2 against its own three-year average of 1.7. The share trades 640% above its history on this multiple – the most direct argument against the current price.
The portal's model, re-pricing EBITDA at current commodity prices at the target multiple, puts fair value 90% below the market. The value sits on the model's clamp, so it is a bound rather than a point estimate, but the direction is unambiguous.
A high multiple in a loss-making quarter means the market is paying for a profit recovery that the report does not show. If the next quarter restores profit, the multiple will normalise quickly through a larger denominator; if not, the current price has no support.
Reserves cover 3.9 years of production – a short base for valuing future cash flows
Reserve life at the current production rate is 3.9 years. For an oil and gas company that is a short horizon: it limits both the period over which development can be stretched and the base for a discounted cash flow valuation.
A short reserve base amplifies the importance of the current price: with 3.9 years of production the company depends on today's price more than a company with a ten-year reserve. Hence the high sensitivity to Brent – at $100 per barrel there is a margin of safety, at a fall back to $68, as a year earlier, there is almost none.
For a holder this means the share must be valued on the current commodity price, not on a cycle average. That is why the verdict rests on the portal's spot model and the multiple at current prices rather than on historical earnings.
Valuation on the latest reported figures
| Metric | Value |
|---|---|
| Market cap | 0.57 bn USD |
| EV/EBITDA (LTM) | 12.2 |
| P/B | 1.28 |
| Net debt / EBITDA (LTM) | 3.53 |
| ROE | 46.8% |
| Dividend yield (12m) | 4.7% |
| EV/EBITDA, 3-year average | 1.7 |
Bottom line
The quarter's strength was revenue of $147.0m – up 141.0% with Brent 34.2% higher. But on our calculation price explains only $20.9m of the increase, and the other $65.1m came from a source the report does not name. A net loss of $39.8m on revenue of $147.0m and 3.53x EBITDA LTM leverage show that sales growth did not turn into profit. With a multiple of 12.2 against its own three-year average of 1.7 and the portal model's fair value 90% below the market, the share looks expensive. The verdict is unattractive; it would change either on disclosure that the loss is one-off together with a profit recovery, or on Brent falling to $68, which would make the current price even less justified.
Open the company's financial profile EGY →
See also: market overview · valuation map · stock screeners