Evolution Petroleum: oil up 31.5% but output down 4.6% – and EBITDA fell short of what the price implied
Contents
On 10 November Evolution Petroleum reported results for the first quarter of fiscal 2027 (July-September 2026). WTI averaged 85.4 USD in the period against 64.9 USD a year earlier (+31.7%), Henry Hub 2.893 USD against 3.083 USD (-6.2%). At the year-ago volumes and costs and moving only prices, revenue should have been 24.4 million USD and EBITDA 9.0 million USD; reported revenue was 22.6 million USD and EBITDA 7.6 million USD, 1.4 million USD below the price-implied figure. Our verdict: rather unattractive – on the portal's model the upside to fair value is -62%. Our view: the share is rather unattractive at the current price; upside on the portal model -62%.
Our view: is there upside
Our view in numbers
| Metric | Our read |
|---|---|
| Verdict | Rather unattractive |
| Upside on the portal model | -62% |
| How the model works | spot model: EBITDA re-priced to current commodity prices at the target EV/EBITDA, against market cap |
| EV/EBITDA now and 3-year average | 7.2 vs 7.6 – a 5% discount to its history |
| Dividend yield, 12m | 13.4% |
| Net debt / EBITDA | 2.12 – moderate leverage |
| Strongest case for | A 13.4% dividend yield and EBITDA of 28.2 million USD at current prices give 7.1x EV/EBITDA – the share may appeal to income investors. |
| Strongest case against | Production fell 4.6%, EBITDA missed the price-implied figure by 15.4% and free cash flow is negative – the dividend is at risk. |
| What would change the view | Production above 7,500 BOEPD and EBITDA above 30 million USD a year would move the verdict one step up; production below 6,500 BOEPD or a dividend cut would move it one step down. |
Key takeaways
— Oil rose 31.5% but output fell 4.6% – and EBITDA missed the price-implied figure by 15.4%
— Revenue grew 6.0% year on year but decelerated from 14.7% a quarter earlier
— Average daily production fell to 6,978 BOEPD on downtime at Delhi and TexMex and natural decline
— Lease operating costs per BOE fell to 19.25 USD, but G&A rose 21.1%
— The 3.0 million USD loss is explained by a 5.4 million USD non-operating hedge loss
— Leverage at 2.12x EBITDA and negative cash flow after dividends and the Permian Minerals acquisition
— The 0.12 USD dividend at a 13.4% yield is the main argument for the share, but it is not covered by free cash flow
Key figures, USD bn
| Metric | Q3 2025 | Q3 2026 | Change |
|---|---|---|---|
| Revenue | 0.02 | 0.02 | +6.0% |
| EBITDA | 0.01 | 0.01 | +29.4% |
| Operating profit | -0.00 | 0.00 | to profit |
| Net profit | 0.00 | -0.00 | -463.1% |
| Operating cash flow | 0.01 | 0.00 | -57.9% |
| Capex | 0.02 | — | — |
| EBITDA margin | 27.6% | 33.7% | +6.1 pp |
| Net margin | 3.9% | -13.3% | -17.2 pp |
Oil rose 31.5% but output fell 4.6% – and EBITDA missed the price-implied figure by 15.4%
WTI averaged 85.4 USD in the period against 64.9 USD a year earlier (+31.7%), Henry Hub 2.893 USD against 3.083 USD (-6.2%). Against that backdrop revenue rose 6.0% to 22.6 million USD and EBITDA 29.4% to 7.6 million USD.
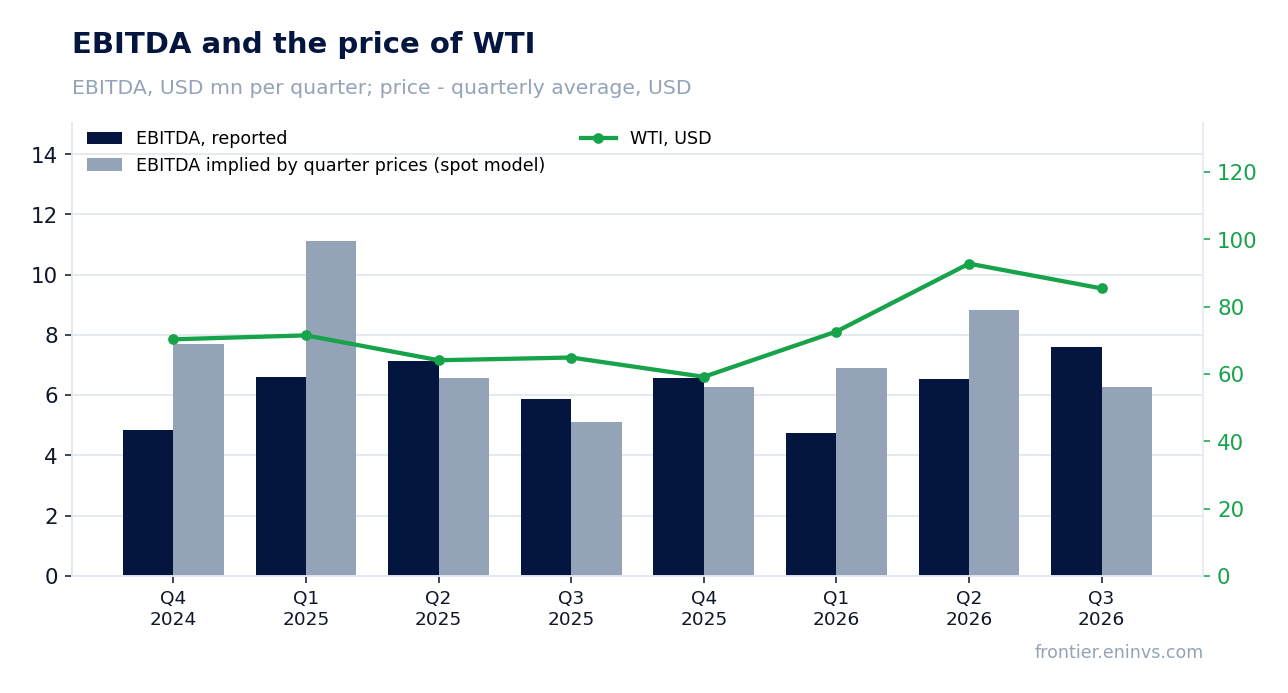
At the year-ago volumes and costs and moving only prices, revenue should have been 24.4 million USD and EBITDA 9.0 million USD. Reported revenue was 1.8 million USD (-7.5%) and EBITDA 1.4 million USD (-15.4%) below. The gap is explained by a 4.6% fall in production and a 21.1% rise in G&A per BOE.
The portal's spot model, built from the average of the previous four quarters, expected EBITDA of 6.3 million USD and revenue of 22.4 million USD; the reported 7.6 million USD and 22.6 million USD came in 21.0% and 0.8% above. But that model is only a run-rate view and disagrees with the year-ago calculation, which we treat as primary.
Commodity prices: period average and now
| Benchmark | Year ago | Q1 2026 | YoY | Spot 2026-11-11 |
|---|---|---|---|---|
| WTI, USD | 64,9 | 85,4 | +31,7% | 86,5 |
| Henry Hub, USD | 3,08 | 2,89 | -6,2% | 3,30 |
Revenue grew 6.0% year on year but decelerated from 14.7% a quarter earlier
Revenue growth of 6.0% year on year decelerated from 14.7% in the previous quarter. Oil revenue was 13.9 million USD, gas revenue 5.5 million USD and NGL revenue 3.2 million USD.
The deceleration is driven primarily by a 17.9% fall in oil production to 170 thousand barrels. Gas and NGL rose 1.5% and 0.0% respectively, but their revenue contribution is smaller.
The realised oil price rose 31.5% to 81.7 USD per barrel, but that did not offset the volume decline. The realised gas price fell 8.4% to 2.51 USD per Mcf.
What the prices implied and what the company earned
| Base (Q1 2025) | Implied at period prices | Reported | Reported vs implied | |
|---|---|---|---|---|
| Revenue, USD mn | 21,3 | 24,4 | 22,6 | -7,5% |
| EBITDA, USD mn | 5,90 | 9,00 | 7,60 | -15,4% |
| EBITDA, portal spot model, USD mn | — | 6,30 | 7,60 | +21,0% |
Revenue and EBITDA by quarter
| Period | Measure | bn USD |
|---|---|---|
| Q4 2024 | Revenue | 0.020274999999999998 |
| Q1 2025 | Revenue | 0.022561 |
| Q2 2025 | Revenue | 0.021108000000000002 |
| Q3 2025 | Revenue | 0.021288 |
| Q4 2025 | Revenue | 0.020679 |
| Q1 2026 | Revenue | 0.020168 |
| Q2 2026 | Revenue | 0.024207999999999997 |
| Q3 2026 | Revenue | 0.022573 |
| Q4 2024 | EBITDA | 0.004828 |
| Q1 2025 | EBITDA | 0.006600000000000001 |
| Q2 2025 | EBITDA | 0.007121 |
| Q3 2025 | EBITDA | 0.005876 |
| Q4 2025 | EBITDA | 0.006577 |
| Q1 2026 | EBITDA | 0.004736 |
| Q2 2026 | EBITDA | 0.006522 |
| Q3 2026 | EBITDA | 0.007605 |
EBITDA margin
| Period | Measure | % |
|---|---|---|
| Q4 2024 | EBITDA margin | 23.8 |
| Q1 2025 | EBITDA margin | 29.3 |
| Q2 2025 | EBITDA margin | 33.7 |
| Q3 2025 | EBITDA margin | 27.6 |
| Q4 2025 | EBITDA margin | 31.8 |
| Q1 2026 | EBITDA margin | 23.5 |
| Q2 2026 | EBITDA margin | 26.9 |
| Q3 2026 | EBITDA margin | 33.7 |
Average daily production fell to 6,978 BOEPD on downtime at Delhi and TexMex and natural decline
Average daily production in the period was 6,978 BOEPD against 7,315 BOEPD a year earlier (-4.6%) and 6,901 BOEPD a quarter earlier (+1.1%). The year-on-year decline was caused by unplanned downtime at Delhi and TexMex and natural decline across the portfolio.
The fall was partly offset by acquisitions of mineral and royalty interests in the Haynesville and Bossier shales and in the Permian. The Permian Minerals acquisition, effective 20 August, contributed about 218 BOE/d.
Oil production fell 17.9% to 170 thousand barrels, gas rose 1.5% to 2,182 MMcf and NGL were flat at 108 thousand barrels. The company expects production to grow next quarter with a full quarter of Permian Minerals ownership and new wells.
Production, realised price and unit cost (company release)
| Metric | Year ago | Reported period | YoY |
|---|---|---|---|
| Average daily production, BOEPD | 7 315 | 6 978 | -4,6% |
| Total production, MBOE | 673,00 | 642,00 | -4,6% |
| Crude oil (before hedges), $/BBL | 62,18 | 81,74 | +31,5% |
| Natural gas (before hedges), $/MCF | 2,74 | 2,51 | -8,4% |
| Natural gas liquids (before hedges), $/BBL | 23,30 | 29,47 | +26,5% |
| Total lease operating costs, $/BOE | 19,45 | 19,25 | -1,0% |
| Ad valorem and production taxes, $/BOE | 2,11 | 2,14 | +1,4% |
| Gathering, transportation, and other costs, $/BOE | 4,30 | 4,27 | -0,7% |
| Other lease operating costs, $/BOE | 13,04 | 12,84 | -1,5% |
| Depletion of full cost proved properties, $/BOE | 8,26 | 8,32 | +0,7% |
Lease operating costs per BOE fell to 19.25 USD, but G&A rose 21.1%
Total lease operating costs fell to 19.25 USD per BOE from 19.45 USD a year earlier. The decline reflects the operator change at TexMex and lower gas-related costs at Jonah Field and the Barnett Shale.
G&A excluding stock-based compensation rose 21.1% to 3.22 USD per BOE on higher professional fees and salaries, and on lower production volumes.
Ad valorem and production taxes were 2.14 USD per BOE and gathering, transportation and other costs 4.27 USD per BOE. Overall cash costs stayed under control, but G&A growth partly offset the fall in lease operating costs.
The 3.0 million USD loss is explained by a 5.4 million USD non-operating hedge loss
The net loss was 3.0 million USD against net income of 0.8 million USD a year earlier. The loss is explained by a 5.4 million USD net loss on derivative contracts, including a 4.1 million USD unrealised loss booked below operating income.
Adjusted net loss excluding selected items was 0.3 million USD against 0.1 million USD a year earlier. Adjusted EBITDA was 6.8 million USD against 7.3 million USD a year earlier.
Operating profit was positive at 1.9 million USD, so the loss came from financial items rather than operations. Hedges are not in the EBITDA we use for valuation and affect net profit only.
Valuation vs its own history
now vs the 3-year average
| Period | Measure | × |
|---|---|---|
| EV/EBITDA | Now | 7.2018745261276 |
| EV/EBITDA | 3-year average | 7.557073585076528 |
Leverage at 2.12x EBITDA and negative cash flow after dividends and the Permian Minerals acquisition
Net debt at 30 September 2026 was 57.3 million USD, or 2.12x trailing twelve-month EBITDA. Operating cash flow for the quarter was 3.3 million USD and capex 0.7 million USD.
The company paid 4.9 million USD in dividends and 16.0 million USD for Permian Minerals, partly funded by a 12.5 million USD equity offering and 3.5 million USD of borrowings. Free cash flow after dividends and the acquisition was negative.
Available liquidity at quarter-end was 15.3 million USD, of which 12.2 million USD was available under the credit facility. After the 20 October redetermination availability fell to 9.2 million USD.
Share price, three years
close, last point 2026-11-10
| Period | Measure | USD per share |
|---|---|---|
| 2025-11-10 | Closing price | 4.449999809265137 |
| 2025-11-11 | Closing price | 4.590000152587891 |
| 2025-11-12 | Closing price | 4.389999866485596 |
| 2025-11-13 | Closing price | 4.340000152587891 |
| 2025-11-14 | Closing price | 4.260000228881836 |
| 2025-11-17 | Closing price | 4.070000171661377 |
| 2025-11-18 | Closing price | 4.059999942779541 |
| 2025-11-19 | Closing price | 3.859999895095825 |
| 2025-11-20 | Closing price | 3.7200000286102295 |
| 2025-11-21 | Closing price | 3.819999933242798 |
| 2025-11-24 | Closing price | 3.809999942779541 |
| 2025-11-25 | Closing price | 3.799999952316284 |
| 2025-11-26 | Closing price | 3.859999895095825 |
| 2025-11-28 | Closing price | 3.930000066757202 |
| 2025-12-01 | Closing price | 4.039999961853027 |
| 2025-12-02 | Closing price | 3.950000047683716 |
| 2025-12-03 | Closing price | 4.130000114440918 |
| 2025-12-04 | Closing price | 4.190000057220459 |
| 2025-12-05 | Closing price | 4.210000038146973 |
| 2025-12-08 | Closing price | 4.119999885559082 |
| 2025-12-09 | Closing price | 4.130000114440918 |
| 2025-12-10 | Closing price | 4.079999923706055 |
| 2025-12-11 | Closing price | 4.070000171661377 |
| 2025-12-12 | Closing price | 4.090000152587891 |
| 2025-12-15 | Closing price | 3.8399999141693115 |
| 2025-12-16 | Closing price | 3.759999990463257 |
| 2025-12-17 | Closing price | 3.7200000286102295 |
| 2025-12-18 | Closing price | 3.559999942779541 |
| 2025-12-19 | Closing price | 3.5299999713897705 |
| 2025-12-22 | Closing price | 3.549999952316284 |
| 2025-12-23 | Closing price | 3.549999952316284 |
| 2025-12-24 | Closing price | 3.6500000953674316 |
| 2025-12-26 | Closing price | 3.5799999237060547 |
| 2025-12-29 | Closing price | 3.559999942779541 |
| 2025-12-30 | Closing price | 3.5399999618530273 |
| 2025-12-31 | Closing price | 3.5399999618530273 |
| 2026-01-02 | Closing price | 3.640000104904175 |
| 2026-01-05 | Closing price | 3.430000066757202 |
| 2026-01-06 | Closing price | 3.3399999141693115 |
| 2026-01-07 | Closing price | 3.2200000286102295 |
| 2026-01-08 | Closing price | 3.380000114440918 |
| 2026-01-09 | Closing price | 3.359999895095825 |
| 2026-01-12 | Closing price | 3.390000104904175 |
| 2026-01-13 | Closing price | 3.549999952316284 |
| 2026-01-14 | Closing price | 3.680000066757202 |
| 2026-01-15 | Closing price | 3.640000104904175 |
| 2026-01-16 | Closing price | 3.640000104904175 |
| 2026-01-20 | Closing price | 3.6500000953674316 |
| 2026-01-21 | Closing price | 3.7300000190734863 |
| 2026-01-22 | Closing price | 3.690000057220459 |
| 2026-01-23 | Closing price | 3.7100000381469727 |
| 2026-01-26 | Closing price | 3.7300000190734863 |
| 2026-01-27 | Closing price | 3.7899999618530273 |
| 2026-01-28 | Closing price | 3.8299999237060547 |
| 2026-01-29 | Closing price | 3.9000000953674316 |
| 2026-01-30 | Closing price | 3.940000057220459 |
| 2026-02-02 | Closing price | 3.990000009536743 |
| 2026-02-03 | Closing price | 4.079999923706055 |
| 2026-02-04 | Closing price | 4.019999980926514 |
| 2026-02-05 | Closing price | 3.9600000381469727 |
| 2026-02-06 | Closing price | 4.099999904632568 |
| 2026-02-09 | Closing price | 4.119999885559082 |
| 2026-02-10 | Closing price | 4.0 |
| 2026-02-11 | Closing price | 4.21999979019165 |
| 2026-02-12 | Closing price | 4.130000114440918 |
| 2026-02-13 | Closing price | 4.369999885559082 |
| 2026-02-17 | Closing price | 4.409999847412109 |
| 2026-02-18 | Closing price | 4.519999980926514 |
| 2026-02-19 | Closing price | 4.519999980926514 |
| 2026-02-20 | Closing price | 4.429999828338623 |
| 2026-02-23 | Closing price | 4.289999961853027 |
| 2026-02-24 | Closing price | 4.429999828338623 |
| 2026-02-25 | Closing price | 4.340000152587891 |
| 2026-02-26 | Closing price | 4.369999885559082 |
| 2026-02-27 | Closing price | 4.46999979019165 |
| 2026-03-02 | Closing price | 4.559999942779541 |
| 2026-03-03 | Closing price | 4.460000038146973 |
| 2026-03-04 | Closing price | 4.46999979019165 |
| 2026-03-05 | Closing price | 4.510000228881836 |
| 2026-03-06 | Closing price | 4.590000152587891 |
| 2026-03-09 | Closing price | 4.639999866485596 |
| 2026-03-10 | Closing price | 4.690000057220459 |
| 2026-03-11 | Closing price | 4.78000020980835 |
| 2026-03-12 | Closing price | 4.760000228881836 |
| 2026-03-13 | Closing price | 4.690000057220459 |
| 2026-03-16 | Closing price | 4.590000152587891 |
| 2026-03-17 | Closing price | 4.489999771118164 |
| 2026-03-18 | Closing price | 4.449999809265137 |
| 2026-03-19 | Closing price | 4.599999904632568 |
| 2026-03-20 | Closing price | 4.619999885559082 |
| 2026-03-23 | Closing price | 4.510000228881836 |
| 2026-03-24 | Closing price | 4.510000228881836 |
| 2026-03-25 | Closing price | 4.46999979019165 |
| 2026-03-26 | Closing price | 4.559999942779541 |
| 2026-03-27 | Closing price | 4.659999847412109 |
| 2026-03-30 | Closing price | 4.670000076293945 |
| 2026-03-31 | Closing price | 4.579999923706055 |
| 2026-04-01 | Closing price | 4.369999885559082 |
| 2026-04-02 | Closing price | 4.429999828338623 |
| 2026-04-06 | Closing price | 4.559999942779541 |
| 2026-04-07 | Closing price | 4.699999809265137 |
| 2026-04-08 | Closing price | 4.440000057220459 |
| 2026-04-09 | Closing price | 4.440000057220459 |
| 2026-04-10 | Closing price | 4.440000057220459 |
| 2026-04-13 | Closing price | 4.460000038146973 |
| 2026-04-14 | Closing price | 4.230000019073486 |
| 2026-04-15 | Closing price | 4.230000019073486 |
| 2026-04-16 | Closing price | 4.230000019073486 |
| 2026-04-17 | Closing price | 4.130000114440918 |
| 2026-04-20 | Closing price | 4.210000038146973 |
| 2026-04-21 | Closing price | 4.139999866485596 |
| 2026-04-22 | Closing price | 4.5 |
| 2026-04-23 | Closing price | 4.800000190734863 |
| 2026-04-24 | Closing price | 4.75 |
| 2026-04-27 | Closing price | 4.699999809265137 |
| 2026-04-28 | Closing price | 4.739999771118164 |
| 2026-04-29 | Closing price | 4.760000228881836 |
| 2026-04-30 | Closing price | 4.800000190734863 |
| 2026-05-01 | Closing price | 4.840000152587891 |
| 2026-05-04 | Closing price | 4.929999828338623 |
| 2026-05-05 | Closing price | 4.949999809265137 |
| 2026-05-06 | Closing price | 4.710000038146973 |
| 2026-05-07 | Closing price | 4.710000038146973 |
| 2026-05-08 | Closing price | 4.650000095367432 |
| 2026-05-11 | Closing price | 4.78000020980835 |
| 2026-05-12 | Closing price | 4.789999961853027 |
| 2026-05-13 | Closing price | 4.210000038146973 |
| 2026-05-14 | Closing price | 4.489999771118164 |
| 2026-05-15 | Closing price | 4.659999847412109 |
| 2026-05-18 | Closing price | 4.690000057220459 |
| 2026-05-19 | Closing price | 4.730000019073486 |
| 2026-05-20 | Closing price | 4.539999961853027 |
| 2026-05-21 | Closing price | 4.559999942779541 |
| 2026-05-22 | Closing price | 4.409999847412109 |
| 2026-05-26 | Closing price | 4.269999980926514 |
| 2026-05-27 | Closing price | 4.21999979019165 |
| 2026-05-28 | Closing price | 4.260000228881836 |
| 2026-05-29 | Closing price | 4.239999771118164 |
| 2026-06-01 | Closing price | 4.289999961853027 |
| 2026-06-02 | Closing price | 4.349999904632568 |
| 2026-06-03 | Closing price | 4.340000152587891 |
| 2026-06-04 | Closing price | 4.550000190734863 |
| 2026-06-05 | Closing price | 4.400000095367432 |
| 2026-06-08 | Closing price | 4.389999866485596 |
| 2026-06-09 | Closing price | 4.289999961853027 |
| 2026-06-10 | Closing price | 4.340000152587891 |
| 2026-06-11 | Closing price | 4.25 |
| 2026-06-12 | Closing price | 4.159999847412109 |
| 2026-06-15 | Closing price | 3.880000114440918 |
| 2026-06-16 | Closing price | 3.890000104904175 |
| 2026-06-17 | Closing price | 3.869999885559082 |
| 2026-06-18 | Closing price | 3.859999895095825 |
| 2026-06-22 | Closing price | 3.809999942779541 |
| 2026-06-23 | Closing price | 3.8499999046325684 |
| 2026-06-24 | Closing price | 3.819999933242798 |
| 2026-06-25 | Closing price | 3.8299999237060547 |
| 2026-06-26 | Closing price | 3.7899999618530273 |
| 2026-06-29 | Closing price | 3.7200000286102295 |
| 2026-06-30 | Closing price | 3.680000066757202 |
| 2026-07-01 | Closing price | 3.640000104904175 |
| 2026-07-02 | Closing price | 3.6500000953674316 |
| 2026-07-06 | Closing price | 3.5199999809265137 |
| 2026-07-07 | Closing price | 3.5999999046325684 |
| 2026-07-08 | Closing price | 3.759999990463257 |
| 2026-07-09 | Closing price | 3.6700000762939453 |
| 2026-07-10 | Closing price | 3.630000114440918 |
| 2026-07-13 | Closing price | 3.8299999237060547 |
| 2026-07-14 | Closing price | 3.8499999046325684 |
| 2026-07-15 | Closing price | 3.7699999809265137 |
| 2026-07-16 | Closing price | 3.799999952316284 |
| 2026-07-17 | Closing price | 3.809999942779541 |
| 2026-07-20 | Closing price | 3.859999895095825 |
| 2026-07-21 | Closing price | 3.890000104904175 |
| 2026-07-22 | Closing price | 4.0 |
| 2026-07-23 | Closing price | 3.940000057220459 |
| 2026-07-24 | Closing price | 3.8299999237060547 |
| 2026-07-27 | Closing price | 3.609999895095825 |
| 2026-07-28 | Closing price | 3.6500000953674316 |
| 2026-07-29 | Closing price | 3.700000047683716 |
| 2026-07-30 | Closing price | 3.6500000953674316 |
| 2026-07-31 | Closing price | 3.680000066757202 |
| 2026-08-03 | Closing price | 3.609999895095825 |
| 2026-08-04 | Closing price | 3.549999952316284 |
| 2026-08-05 | Closing price | 3.5 |
| 2026-08-06 | Closing price | 3.549999952316284 |
| 2026-08-07 | Closing price | 3.6500000953674316 |
| 2026-08-10 | Closing price | 3.7300000190734863 |
| 2026-08-11 | Closing price | 3.7699999809265137 |
| 2026-08-12 | Closing price | 3.7300000190734863 |
| 2026-08-13 | Closing price | 3.75 |
| 2026-08-14 | Closing price | 3.759999990463257 |
| 2026-08-17 | Closing price | 3.819999933242798 |
| 2026-08-18 | Closing price | 3.8299999237060547 |
| 2026-08-19 | Closing price | 3.3399999141693115 |
| 2026-08-20 | Closing price | 3.549999952316284 |
| 2026-08-21 | Closing price | 3.5299999713897705 |
| 2026-08-24 | Closing price | 3.4700000286102295 |
| 2026-08-25 | Closing price | 3.4800000190734863 |
| 2026-08-26 | Closing price | 3.4200000762939453 |
| 2026-08-27 | Closing price | 3.5799999237060547 |
| 2026-08-28 | Closing price | 3.640000104904175 |
| 2026-08-31 | Closing price | 3.700000047683716 |
| 2026-09-01 | Closing price | 3.690000057220459 |
| 2026-09-02 | Closing price | 3.6700000762939453 |
| 2026-09-03 | Closing price | 3.700000047683716 |
| 2026-09-04 | Closing price | 3.680000066757202 |
| 2026-09-08 | Closing price | 3.700000047683716 |
| 2026-09-09 | Closing price | 3.690000057220459 |
| 2026-09-10 | Closing price | 3.8399999141693115 |
| 2026-09-11 | Closing price | 3.7200000286102295 |
| 2026-09-14 | Closing price | 3.7100000381469727 |
| 2026-09-15 | Closing price | 3.690000057220459 |
| 2026-09-16 | Closing price | 3.630000114440918 |
| 2026-09-17 | Closing price | 3.690000057220459 |
| 2026-09-18 | Closing price | 3.859999895095825 |
| 2026-09-21 | Closing price | 3.559999942779541 |
| 2026-09-22 | Closing price | 3.6600000858306885 |
| 2026-09-23 | Closing price | 3.5999999046325684 |
| 2026-09-24 | Closing price | 3.630000114440918 |
| 2026-09-25 | Closing price | 3.5199999809265137 |
| 2026-09-28 | Closing price | 3.450000047683716 |
| 2026-09-29 | Closing price | 3.490000009536743 |
| 2026-09-30 | Closing price | 3.5399999618530273 |
| 2026-10-01 | Closing price | 3.569999933242798 |
| 2026-10-02 | Closing price | 3.5799999237060547 |
| 2026-10-05 | Closing price | 3.559999942779541 |
| 2026-10-06 | Closing price | 3.640000104904175 |
| 2026-10-07 | Closing price | 3.609999895095825 |
| 2026-10-08 | Closing price | 3.640000104904175 |
| 2026-10-09 | Closing price | 3.6700000762939453 |
| 2026-10-12 | Closing price | 3.7100000381469727 |
| 2026-10-13 | Closing price | 3.759999990463257 |
| 2026-10-14 | Closing price | 3.7100000381469727 |
| 2026-10-15 | Closing price | 3.6700000762939453 |
| 2026-10-16 | Closing price | 3.7100000381469727 |
| 2026-10-19 | Closing price | 3.75 |
| 2026-10-20 | Closing price | 3.7300000190734863 |
| 2026-10-21 | Closing price | 3.759999990463257 |
| 2026-10-22 | Closing price | 3.759999990463257 |
| 2026-10-23 | Closing price | 3.930000066757202 |
| 2026-10-26 | Closing price | 3.950000047683716 |
| 2026-10-27 | Closing price | 3.990000009536743 |
| 2026-10-28 | Closing price | 3.890000104904175 |
| 2026-10-29 | Closing price | 3.819999933242798 |
| 2026-10-30 | Closing price | 3.799999952316284 |
| 2026-11-02 | Closing price | 3.609999895095825 |
| 2026-11-03 | Closing price | 3.6500000953674316 |
| 2026-11-04 | Closing price | 3.5199999809265137 |
| 2026-11-05 | Closing price | 3.4600000381469727 |
| 2026-11-06 | Closing price | 3.4800000190734863 |
| 2026-11-09 | Closing price | 3.5399999618530273 |
| 2026-11-10 | Closing price | 3.555000066757202 |
The 0.12 USD dividend at a 13.4% yield is the main argument for the share, but it is not covered by free cash flow
The company declared another quarterly dividend of 0.12 USD per share, payable on 31 December 2026. This is the 53rd consecutive quarterly dividend. The trailing twelve-month yield is 13.4%.
The dividend is not covered by free cash flow: operating cash flow for the quarter was 3.3 million USD while dividends absorbed 4.9 million USD. The gap was funded by borrowings and the equity offering.
To sustain the payout the company needs either higher production and cash flow or lower capex. At current oil and gas prices, trailing twelve-month EBITDA is 27.0 million USD and EBITDA at spot prices is 28.2 million USD.
Valuation on the latest reported figures
| Metric | Value |
|---|---|
| Market cap | 0.14 bn USD |
| EV/EBITDA (LTM) | 7.2 |
| P/B | 2.36 |
| Net debt / EBITDA (LTM) | 2.12 |
| Operating cash flow (LTM) | 0.02 bn |
| ROE | -19.0% |
| Dividend yield (12m) | 13.4% |
| EV/EBITDA, 3-year average | 7.6 |
Net profit by quarter
| Period | Measure | bn USD |
|---|---|---|
| Q4 2024 | Net profit | −0.001825 |
| Q1 2025 | Net profit | −0.002179 |
| Q2 2025 | Net profit | 0.0034 |
| Q3 2025 | Net profit | 0.000824 |
| Q4 2025 | Net profit | 0.001065 |
| Q1 2026 | Net profit | −0.008932 |
| Q2 2026 | Net profit | 0.004614 |
| Q3 2026 | Net profit | −0.002992 |
Bottom line
The strong point was EBITDA growth of 29.4% on higher oil prices and a fall in lease operating costs per BOE. But production fell 4.6% and EBITDA missed the price-implied figure by 15.4%. The 3.0 million USD loss is an accounting effect from hedges, but leverage at 2.12x EBITDA and negative cash flow are real problems. The 13.4% dividend is attractive but not covered by cash flow. Our verdict: rather unattractive – on the portal's model the upside to fair value is -62%. Our view: the share is rather unattractive at the current price; upside on the portal model -62%.