Expand Energy: revenue accelerated to +10.8%, but EBITDA margin compressed by almost 7 points

On 27 October Expand Energy reported results for the third quarter of 2026. Revenue came in at USD 3,286 mn, up 10.8% year on year after a 19.8% decline a quarter earlier; EBITDA was USD 1,390 mn and net profit USD 519 mn. Revenue growth resumed, but EBITDA and net profit fell 5.2% and 5.1% respectively, and the EBITDA margin compressed to 42.3% from 49.4% a year earlier. At an EV/EBITDA of 4.2 against its own three-year average of 4.9 and a portal-model upside of +16%, the share looks rather attractive, though the margin compression keeps us from a higher rating.
Key takeaways
— Revenue accelerated to +10.8% year on year after a 19.8% decline a quarter earlier
— EBITDA fell 5.2% and its margin compressed to 42.3% from 49.4% a year earlier
— Net profit declined 5.1% to USD 519 mn at a 15.8% net margin
— Operating cash flow of USD 1,177 mn covered capital expenditure of USD 838 mn with room to spare
— Net debt rose from USD 3.1 bn on 30 June to USD 4.5 bn on 30 September
— Trailing twelve-month dividend yield is 2.4%, with payouts still funded from operating cash flow
— EV/EBITDA of 4.2 is below its own three-year average of 4.9, and the portal model implies +16% upside
Attractiveness
Key figures, USD bn
| Metric | Q3 2025 | Q3 2026 | Change |
|---|---|---|---|
| Revenue | 2.97 | 3.29 | +10.8% |
| EBITDA | 1.47 | 1.39 | -5.2% |
| Operating profit | 0.72 | 0.64 | -11.7% |
| Net profit | 0.55 | 0.52 | -5.1% |
| Operating cash flow | 1.20 | 1.18 | -2.0% |
| Capex | 0.78 | 0.84 | +8.1% |
| EBITDA margin | 49.4% | 42.3% | -7.1 pp |
| Net margin | 18.4% | 15.8% | -2.6 pp |
Revenue accelerated to +10.8% year on year after a 19.8% decline a quarter earlier
In the third quarter of 2026 Expand Energy's revenue reached USD 3,286 mn, 10.8% above the same quarter a year earlier. A quarter earlier, in Q2 2026, revenue was declining 19.8% year on year, so the direction reversed – growth accelerated.
Sequentially, revenue rose from USD 2,960 mn in Q2 to USD 3,286 mn in Q3. This is a recovery from a weak second quarter, but the absolute level is still below the peak of Q1 2026, when revenue reached USD 4,397 mn.
For durability, it matters that revenue has grown year on year for two consecutive quarters after the slump in late 2025 – early 2026. However, the year-earlier base in Q3 2025 was low, and without data on realised prices and production volumes we cannot say the growth is organic rather than one-off.
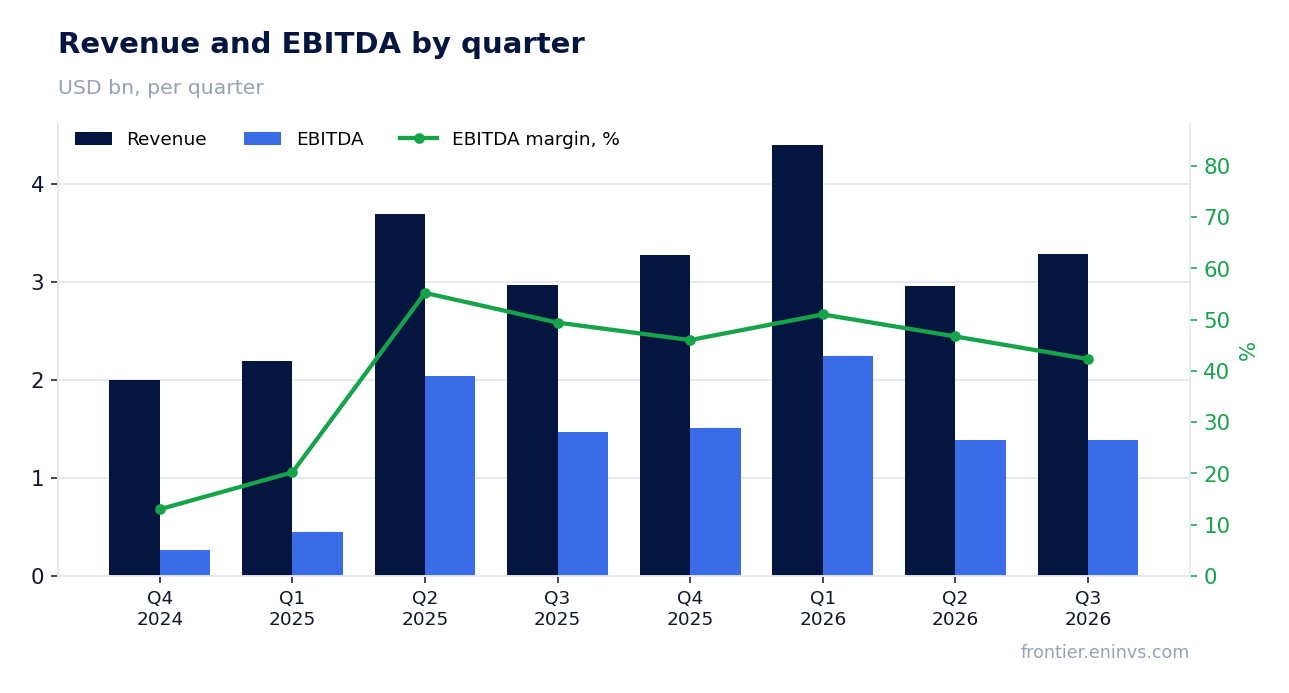
EBITDA fell 5.2% and its margin compressed to 42.3% from 49.4% a year earlier
EBITDA for Q3 2026 was USD 1,390 mn, 5.2% below the level of Q3 2025. With revenue up 10.8%, this means costs grew faster than revenue, and the EBITDA margin compressed to 42.3% from 49.4% a year earlier – almost 7 percentage points.
Operating profit in the reported quarter was USD 640 mn versus USD 725 mn a year earlier. A decline in operating profit alongside revenue growth points to higher operating costs, but the facts provide no line-item breakdown, so the specific cause of the margin compression cannot be named.
The margin compression is the main negative of the report. If it reflects one-off factors, the margin may recover next quarter; if it is a consequence of rising unit costs, pressure on profit will persist. For an investor, the key question is the durability of the margin above 40%.
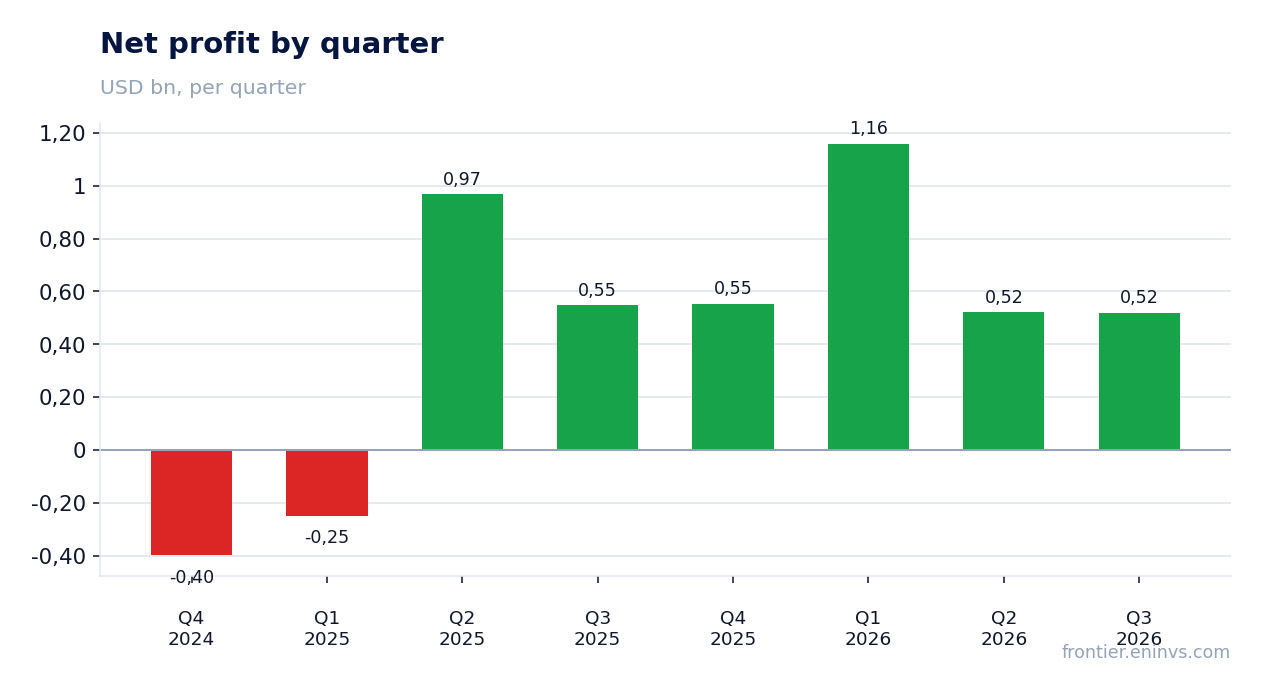
Net profit declined 5.1% to USD 519 mn at a 15.8% net margin
Net profit for Q3 2026 was USD 519 mn, down 5.1% year on year. The net margin narrowed to 15.8% from 18.4% a year earlier, consistent with the compression in the operating margin.
Over the trailing twelve months net profit was USD 2,753 mn on revenue of USD 13,900 mn and EBITDA of USD 6,513.7 mn. These figures reflect the stronger first and second quarters of 2026 and should not be applied to the reported quarter.
The decline in profit alongside revenue growth confirms that the main risk in the report is costs, not revenue. Net profit remains positive and covers dividend payments, but its dynamics are worse than those of revenue.
Operating cash flow of USD 1,177 mn covered capital expenditure of USD 838 mn with room to spare
Operating cash flow for Q3 2026 was USD 1,177 mn, capital expenditure – USD 838 mn. Free cash flow therefore remains positive at roughly USD 339 mn before interest and taxes.
Over the trailing twelve months operating cash flow was USD 5,631 mn, with capital expenditure in the reported quarter higher than in the previous one (USD 838 mn versus USD 753 mn in Q2). The increase in capex may be tied to seasonal work, but the facts do not disclose the reason.
Positive free cash flow is important for funding dividends and reducing debt. However, rising capital expenditure and higher net debt suggest that free cash flow is fully absorbed by investment and payouts.
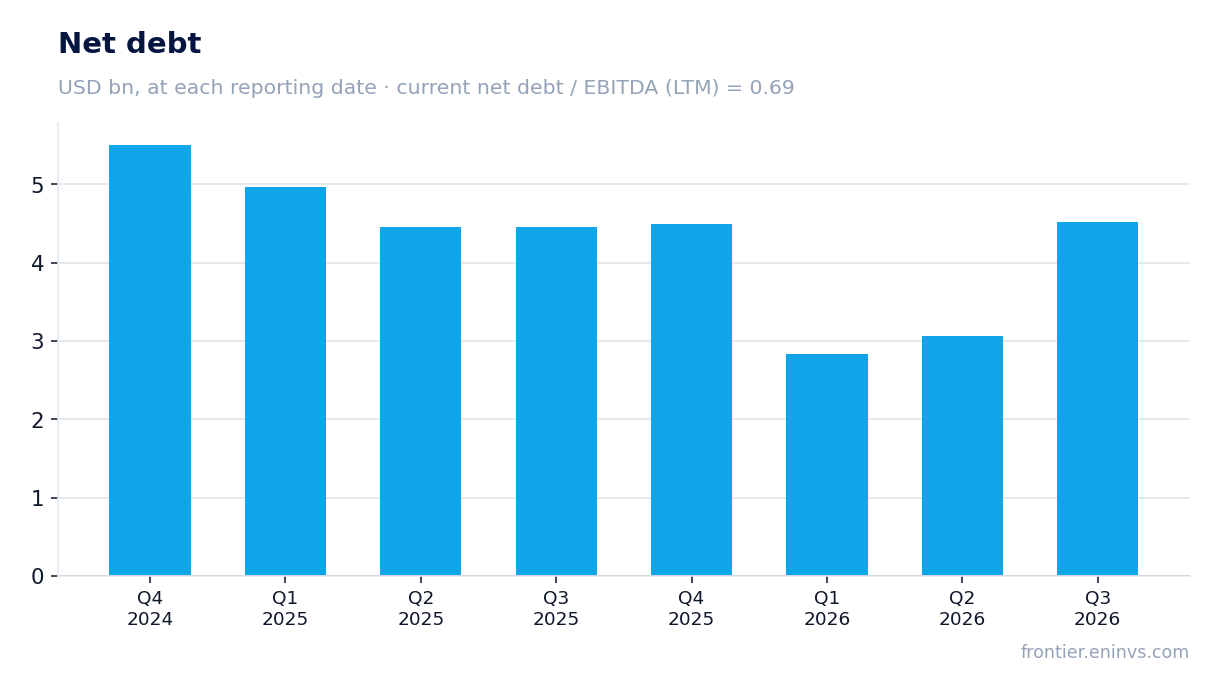
Net debt rose from USD 3.1 bn on 30 June to USD 4.5 bn on 30 September
Net debt as of 30 September 2026 was USD 4,514 mn, up from USD 3,065 mn on 30 June 2026 – an increase of USD 1.4 bn over the quarter. A year earlier, on 30 September 2025, net debt was USD 4,460 mn, so over twelve months it was almost unchanged.
The ratio of net debt to trailing twelve-month EBITDA is 0.69 – a level that remains comfortable for the company. The direction of change in this ratio is not disclosed in the facts, so we state the level only.
The increase in debt in Q3 is partly explained by seasonal capital expenditure and dividend payments. With positive operating cash flow the company can service its debt, but further debt growth without EBITDA growth could limit financial flexibility.
Trailing twelve-month dividend yield is 2.4%, with payouts still funded from operating cash flow
Expand Energy's trailing twelve-month dividend yield is 2.4%. The company pays dividends, and current quarterly operating cash flow of USD 1,177 mn covers both capital expenditure and payouts.
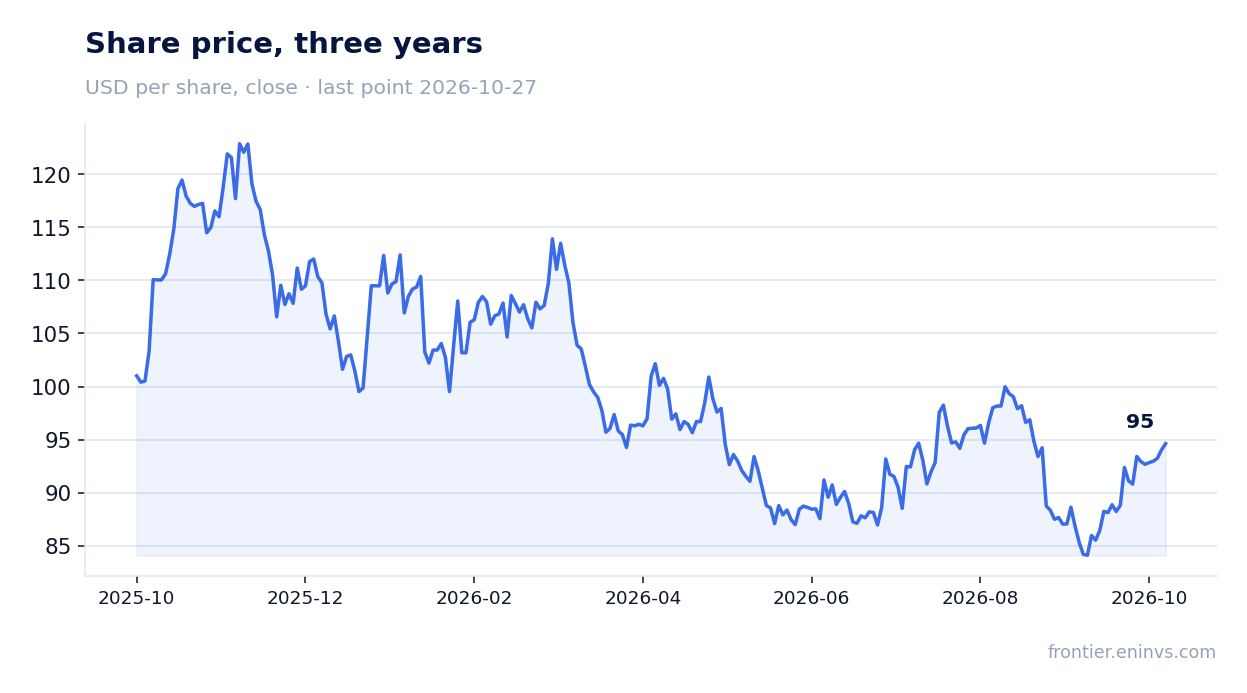
Our estimate for the 2026 dividend assumes the current yield of about 2.4% is maintained at a share price of USD 94.02. This implies the company will keep the current payout level, which rests on profit and cash flow. However, with margin compression and rising debt, the sustainability of payouts depends on EBITDA recovery.
A yield of 2.4% is modest relative to the risk-free rate, but for a commodity company with cyclical earnings it reflects a cautious approach to capital allocation. A cut is possible if EBITDA falls further or capital expenditure rises.
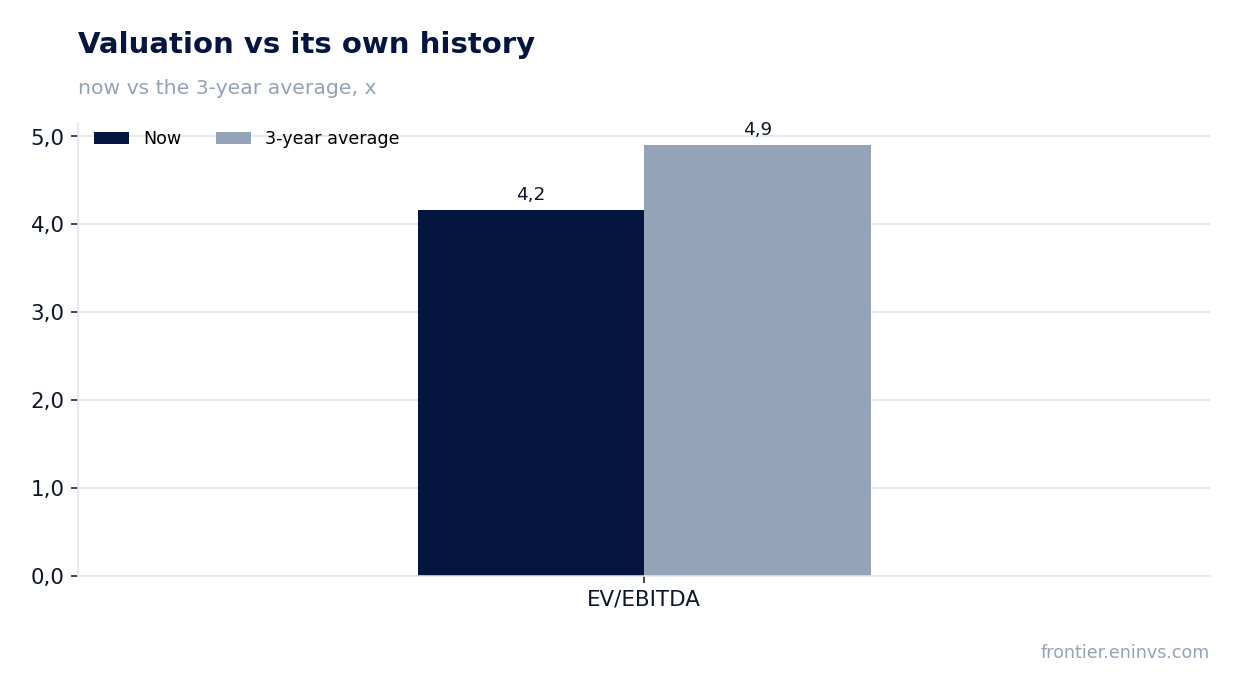
EV/EBITDA of 4.2 is below its own three-year average of 4.9, and the portal model implies +16% upside
The trailing twelve-month EV/EBITDA multiple is 4.2 against its own three-year average of 4.9 – the share trades 15% below its historical valuation. The trailing P/E is 8.2, also pointing to a modest valuation.
On the portal's model, which re-prices EBITDA at current commodity prices at the target EV/EBITDA, the upside to fair value is +16%. This is our own estimate, not a market consensus.
The market reaction to the report was muted: the share added 0.6% on the release day, and from the release to 27 October the gain was also 0.6%. Investors appear to have weighed the margin compression, but the low valuation limits downside.
Valuation on the latest reported figures
| Metric | Value |
|---|---|
| Market cap | 22.6 bn USD |
| P/E (LTM) | 8.2 |
| EV/EBITDA (LTM) | 4.2 |
| P/B | 1.22 |
| Net debt / EBITDA (LTM) | 0.69 |
| Operating cash flow (LTM) | 5.63 bn |
| ROE | 3.6% |
| Dividend yield (12m) | 2.4% |
| EV/EBITDA, 3-year average | 4.9 |
Tracked metrics of the idea
The metrics we track our idea "Expand Energy, US gas producers" of 2026-07-24 by - at the idea date and now. The share price moved +3% over the period. Original write-up: https://frontier.eninvs.com/region/commodities/article/natgas
Idea: at publication and now
| Metric | 2026-07-24, price 91.52 | Now, price 94.62 |
|---|---|---|
| Fundamental value created, share of market cap | +25% | -9% |
| Upside on the commodity model (conservative price: midpoint of spot and 3-year average) | +10% | +16% |
Bottom line
The strong side of the report is the resumption of revenue growth to +10.8% year on year and positive free cash flow. The weak side is the compression of the EBITDA margin to 42.3% and the 5.1% decline in profit. Net debt rose over the quarter but remains moderate relative to EBITDA. The valuation is below its own history, and the portal model implies +16% upside, which outweighs the margin negative. Verdict – rather attractive: the low multiple and resilient cash flow offset the margin risk, but a re-rating requires evidence of margin recovery.
Open the company's financial profile EXE →
See also: market overview · valuation map · stock screeners