Endeavour Silver: silver up 57.6%, yet EBITDA came in 12.6% below what the price implied
Contents

On 13 November Endeavour Silver released its third-quarter 2026 results. The average silver price in the quarter was 62.8 dollars against 39.9 a year earlier (+57.6%), gold – 4268 against 3459 (+23.4%). At the year-ago volumes and costs, and moving only the price, our calculation puts revenue at 197.7 million dollars and EBITDA at 81.5 million; the company reported 184.5 million and 71.3 million, 6.7% and 12.6% below. Our conclusion: rather unattractive – on the portal's model the share's fair value is 73% below the current price. Our view: the share is rather unattractive at the current price; upside on the portal model -73%.
Our view: is there upside
Our view in numbers
| Metric | Our read |
|---|---|
| Verdict | Rather unattractive |
| Upside on the portal model | -73% |
| How the model works | spot model: EBITDA re-priced to current commodity prices at the target EV/EBITDA, against market cap |
| Net debt / EBITDA | -0.11 – net cash |
| Strongest case for | The company has net cash of 37.2 million dollars and strong operating flow of 76.5 million in the quarter, which provides a cushion if prices fall. |
| Strongest case against | At today's prices EBITDA falls to 138.1 million dollars, and EV/EBITDA at current prices is 16.5 – the valuation leaves no margin of safety. |
| What would change the view | A return of silver to 62.8 dollars an ounce or a sustained reduction in unit costs would move the verdict one step up. |
Key takeaways
— Silver averaged 62.8 dollars in the quarter – 57.6% above a year earlier, but already 14.1% below the previous quarter
— The price implied EBITDA of 81.5 million dollars; the company earned 71.3 million – a 12.6% gap
— Revenue grew 35.9% year on year, a deceleration from 139.4% in the previous quarter
— The EBITDA margin rose to 38.6% from 14.5%, and almost all of it is the metal price, not costs
— Net cash of 37.2 million dollars and net debt to EBITDA of minus 0.11 – there is effectively no debt
— At today's prices the portal model puts annual EBITDA at 138.1 million against 325.9 million over the last twelve months – a 57.6% fall
— On the portal's model the share is 73% above fair value, and EV/EBITDA at current prices is 16.5
Key figures, USD bn
| Metric | Q3 2025 | Q3 2026 | Change |
|---|---|---|---|
| Revenue | 0.14 | 0.18 | +35.9% |
| EBITDA | 0.02 | 0.07 | +263.3% |
| Operating profit | -0.00 | 0.05 | to profit |
| Net profit | -0.04 | 0.03 | to profit |
| Operating cash flow | 0.03 | 0.08 | +182.8% |
| Capex | 0.03 | 0.03 | -21.2% |
| EBITDA margin | 14.5% | 38.6% | +24.1 pp |
| Net margin | -30.6% | 14.3% | +44.9 pp |
Silver averaged 62.8 dollars in the quarter – 57.6% above a year earlier, but already 14.1% below the previous quarter
Silver accounts for 65% of the company's revenue in the portal model, so its price is the main driver of the report. The quarterly average was 62.8 dollars against 39.9 a year earlier, up 57.6%. Gold, which brings 35% of revenue, averaged 4268 dollars against 3459 (+23.4%).
Against the previous quarter the metal has already cheapened: silver by 14.1%, gold by 5.5%. On 13 November spot silver is 49.9 dollars, a further 20.6% below the reported-quarter average; gold is 3884 dollars, 9.0% lower. For the company this means next period's revenue and EBITDA will be calculated from a lower base.
Commodity prices: period average and now
| Benchmark | Year ago | Q3 2026 | YoY | Spot 2026-11-13 |
|---|---|---|---|---|
| Silver, USD | 39,9 | 62,8 | +57,6% | 49,9 |
| Gold, USD | 3 459 | 4 268 | +23,4% | 3 884 |
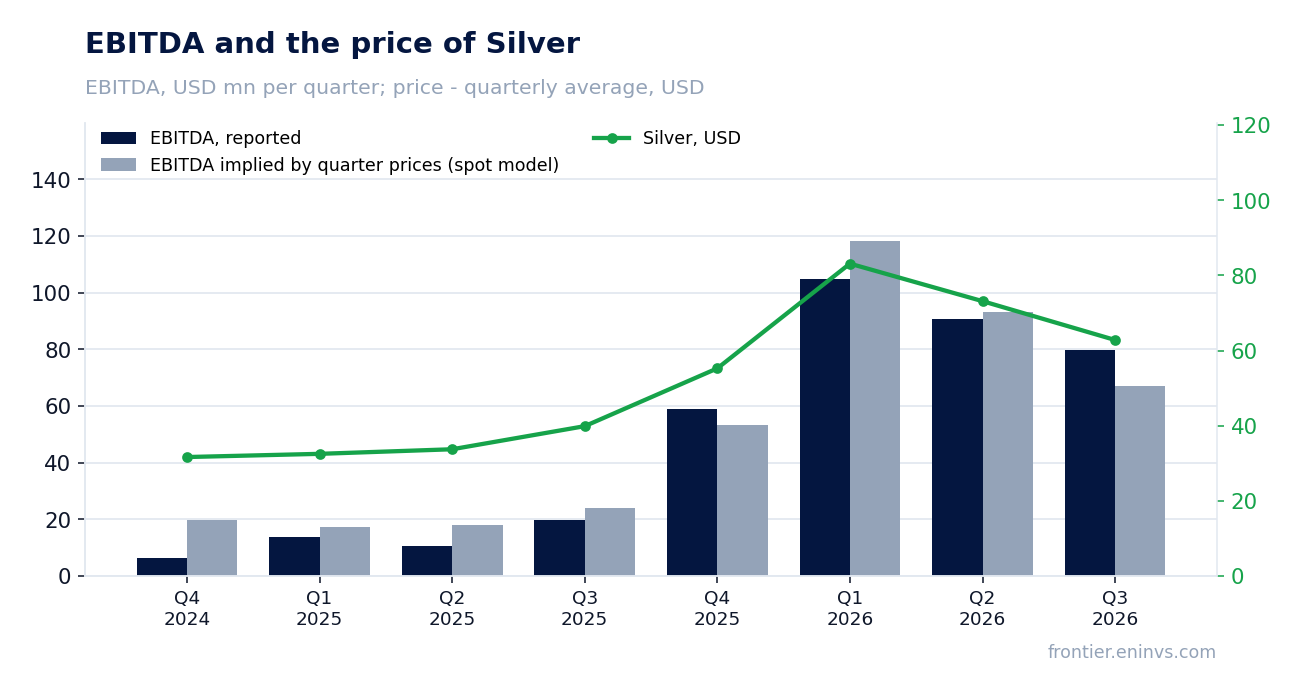
The price implied EBITDA of 81.5 million dollars; the company earned 71.3 million – a 12.6% gap
At the year-ago volumes and non-commodity costs, moving only metal prices, our calculation gives revenue of 197.7 million dollars and EBITDA of 81.5 million. The company actually reported 184.5 million of revenue and 71.3 million of EBITDA: 13.2 million and 10.2 million below the calculation.
The gap means the metal price was not fully carried through to the result. The causes could be sales volumes, the realised price against the benchmark or unit costs; the facts and the source do not name a specific cause, so we record the gap itself rather than invent an explanation.
The portal's spot model, built from the average of the previous four quarters, expected EBITDA of 67.1 million and revenue of 183.9 million. The reported 71.3 million and 184.5 million came in 6.3% and 0.3% above. That model looks at the run-rate, not the price effect, and disagrees in direction with the year-ago calculation; for what the company should have earned at this price we rely on the year-ago calculation.
What the prices implied and what the company earned
| Base (Q3 2025) | Implied at period prices | Reported | Reported vs implied | |
|---|---|---|---|---|
| Revenue, USD mn | 135,8 | 197,7 | 184,5 | -6,7% |
| EBITDA, USD mn | 19,6 | 81,5 | 71,3 | -12,6% |
| EBITDA, portal spot model, USD mn | — | 67,1 | 71,3 | +6,3% |
Revenue and EBITDA by quarter
| Period | Measure | bn USD |
|---|---|---|
| Q4 2024 | Revenue | 0.04298600000000002 |
| Q1 2025 | Revenue | 0.0635 |
| Q2 2025 | Revenue | 0.088597 |
| Q3 2025 | Revenue | 0.13575800000000002 |
| Q4 2025 | Revenue | 0.172574 |
| Q1 2026 | Revenue | 0.2097 |
| Q2 2026 | Revenue | 0.21209999999999998 |
| Q3 2026 | Revenue | 0.1845 |
| Q4 2024 | EBITDA | 0.006326 |
| Q1 2025 | EBITDA | 0.013699999999999999 |
| Q2 2025 | EBITDA | 0.010392 |
| Q3 2025 | EBITDA | 0.019627 |
| Q4 2025 | EBITDA | 0.058816 |
| Q1 2026 | EBITDA | 0.105 |
| Q2 2026 | EBITDA | 0.0908 |
| Q3 2026 | EBITDA | 0.07959999999999999 |
EBITDA margin
| Period | Measure | % |
|---|---|---|
| Q4 2024 | EBITDA margin | 14.7 |
| Q1 2025 | EBITDA margin | 21.6 |
| Q2 2025 | EBITDA margin | 11.7 |
| Q3 2025 | EBITDA margin | 14.5 |
| Q4 2025 | EBITDA margin | 34.1 |
| Q1 2026 | EBITDA margin | 50.1 |
| Q2 2026 | EBITDA margin | 42.8 |
| Q3 2026 | EBITDA margin | 43.1 |
Revenue grew 35.9% year on year, a deceleration from 139.4% in the previous quarter
Third-quarter revenue was 184.5 million dollars, 35.9% more than a year earlier. In the previous quarter growth was 139.4%, so the pace decelerated. The deceleration is a base effect: a year ago revenue was 135.8 million, and now it is compared with the already high base of the second quarter of 2026 (212.1 million).
Against the previous quarter revenue fell: 184.5 million versus 212.1 million. At the previous quarter's volumes and costs, moving only the price, our calculation puts revenue at 188.6 million, so the price took away 23.5 million, or 11.1%. The reported 184.5 million is 4.1 million below even that level.
The EBITDA margin rose to 38.6% from 14.5%, and almost all of it is the metal price, not costs
Quarterly EBITDA was 71.3 million dollars, 263.3% more than a year earlier. The EBITDA margin rose to 38.6% from 14.5%. Such a margin increase with an almost unchanged cost structure is a direct consequence of silver rising 57.6% and gold 23.4%.
Net profit was 26.4 million dollars against a loss of 41.5 million a year earlier; the net margin is 14.3% against minus 30.6%. Operating profit was 53.5 million dollars. The gap between EBITDA and operating profit (17.8 million) is depreciation, which does not affect cash flow.
Net cash of 37.2 million dollars and net debt to EBITDA of minus 0.11 – there is effectively no debt
As of 30 September 2026 the company had net cash of 37.2 million dollars: cash exceeds debt. Net debt to EBITDA over the last twelve months is minus 0.11. That is a level, not a trend: the facts give no earlier value to compare with.
Operating cash flow in the quarter was 76.5 million dollars, capital expenditure 27.3 million. Free cash flow is therefore about 49.2 million dollars. Over the last twelve months operating cash flow was 152.4 million, so the quarter was strong on cash as well.
At today's prices the portal model puts annual EBITDA at 138.1 million against 325.9 million over the last twelve months – a 57.6% fall
Over the last twelve months the company earned 325.9 million dollars of EBITDA on revenue of 778.9 million. But that money was earned at high metal prices. At today's prices the portal's spot model puts annual EBITDA at 138.1 million dollars, 57.6% less. That is the base from which valuation should start.
EV/EBITDA at current prices is 16.5, and net debt to EBITDA at current prices is minus 0.27. For a producer with 5.6 years of reserve life at the current mining rate, that looks expensive: the market is paying for EBITDA that today's prices do not support.
Share price, three years
close, last point 2026-11-12
| Period | Measure | USD per share |
|---|---|---|
| 2025-11-13 | Closing price | 7.869999885559082 |
| 2025-11-14 | Closing price | 7.710000038146973 |
| 2025-11-17 | Closing price | 7.519999980926514 |
| 2025-11-18 | Closing price | 7.590000152587891 |
| 2025-11-19 | Closing price | 7.639999866485596 |
| 2025-11-20 | Closing price | 7.070000171661377 |
| 2025-11-21 | Closing price | 7.210000038146973 |
| 2025-11-24 | Closing price | 7.650000095367432 |
| 2025-11-25 | Closing price | 7.809999942779541 |
| 2025-11-26 | Closing price | 8.619999885559082 |
| 2025-11-28 | Closing price | 9.930000305175781 |
| 2025-12-01 | Closing price | 9.399999618530273 |
| 2025-12-02 | Closing price | 9.239999771118164 |
| 2025-12-03 | Closing price | 8.920000076293945 |
| 2025-12-04 | Closing price | 8.6899995803833 |
| 2025-12-05 | Closing price | 8.670000076293945 |
| 2025-12-08 | Closing price | 8.479999542236328 |
| 2025-12-09 | Closing price | 8.859999656677246 |
| 2025-12-10 | Closing price | 9.029999732971191 |
| 2025-12-11 | Closing price | 9.40999984741211 |
| 2025-12-12 | Closing price | 8.979999542236328 |
| 2025-12-15 | Closing price | 9.130000114440918 |
| 2025-12-16 | Closing price | 9.319999694824219 |
| 2025-12-17 | Closing price | 9.359999656677246 |
| 2025-12-18 | Closing price | 9.220000267028809 |
| 2025-12-19 | Closing price | 9.520000457763672 |
| 2025-12-22 | Closing price | 9.890000343322754 |
| 2025-12-23 | Closing price | 9.920000076293945 |
| 2025-12-24 | Closing price | 9.789999961853027 |
| 2025-12-26 | Closing price | 10.079999923706055 |
| 2025-12-29 | Closing price | 9.569999694824219 |
| 2025-12-30 | Closing price | 9.800000190734863 |
| 2025-12-31 | Closing price | 9.399999618530273 |
| 2026-01-02 | Closing price | 9.020000457763672 |
| 2026-01-05 | Closing price | 9.770000457763672 |
| 2026-01-06 | Closing price | 10.600000381469727 |
| 2026-01-07 | Closing price | 10.079999923706055 |
| 2026-01-08 | Closing price | 9.779999732971191 |
| 2026-01-09 | Closing price | 10.619999885559082 |
| 2026-01-12 | Closing price | 11.170000076293945 |
| 2026-01-13 | Closing price | 11.15999984741211 |
| 2026-01-14 | Closing price | 11.210000038146973 |
| 2026-01-15 | Closing price | 11.569999694824219 |
| 2026-01-16 | Closing price | 11.720000267028809 |
| 2026-01-20 | Closing price | 12.34000015258789 |
| 2026-01-21 | Closing price | 12.260000228881836 |
| 2026-01-22 | Closing price | 13.600000381469727 |
| 2026-01-23 | Closing price | 14.119999885559082 |
| 2026-01-26 | Closing price | 13.949999809265137 |
| 2026-01-27 | Closing price | 13.8100004196167 |
| 2026-01-28 | Closing price | 13.850000381469727 |
| 2026-01-29 | Closing price | 13.15999984741211 |
| 2026-01-30 | Closing price | 10.930000305175781 |
| 2026-02-02 | Closing price | 10.779999732971191 |
| 2026-02-03 | Closing price | 11.609999656677246 |
| 2026-02-04 | Closing price | 11.880000114440918 |
| 2026-02-05 | Closing price | 10.4399995803833 |
| 2026-02-06 | Closing price | 11.359999656677246 |
| 2026-02-09 | Closing price | 12.199999809265137 |
| 2026-02-10 | Closing price | 12.140000343322754 |
| 2026-02-11 | Closing price | 12.369999885559082 |
| 2026-02-12 | Closing price | 11.0 |
| 2026-02-13 | Closing price | 11.75 |
| 2026-02-17 | Closing price | 11.239999771118164 |
| 2026-02-18 | Closing price | 11.65999984741211 |
| 2026-02-19 | Closing price | 12.130000114440918 |
| 2026-02-20 | Closing price | 12.890000343322754 |
| 2026-02-23 | Closing price | 12.979999542236328 |
| 2026-02-24 | Closing price | 13.199999809265137 |
| 2026-02-25 | Closing price | 13.239999771118164 |
| 2026-02-26 | Closing price | 14.029999732971191 |
| 2026-02-27 | Closing price | 13.899999618530273 |
| 2026-03-02 | Closing price | 13.140000343322754 |
| 2026-03-03 | Closing price | 11.890000343322754 |
| 2026-03-04 | Closing price | 12.420000076293945 |
| 2026-03-05 | Closing price | 11.510000228881836 |
| 2026-03-06 | Closing price | 11.180000305175781 |
| 2026-03-09 | Closing price | 11.260000228881836 |
| 2026-03-10 | Closing price | 11.550000190734863 |
| 2026-03-11 | Closing price | 11.15999984741211 |
| 2026-03-12 | Closing price | 10.779999732971191 |
| 2026-03-13 | Closing price | 9.970000267028809 |
| 2026-03-16 | Closing price | 10.210000038146973 |
| 2026-03-17 | Closing price | 10.239999771118164 |
| 2026-03-18 | Closing price | 9.470000267028809 |
| 2026-03-19 | Closing price | 8.6899995803833 |
| 2026-03-20 | Closing price | 8.239999771118164 |
| 2026-03-23 | Closing price | 8.720000267028809 |
| 2026-03-24 | Closing price | 8.970000267028809 |
| 2026-03-25 | Closing price | 9.180000305175781 |
| 2026-03-26 | Closing price | 8.5600004196167 |
| 2026-03-27 | Closing price | 8.899999618530273 |
| 2026-03-30 | Closing price | 8.619999885559082 |
| 2026-03-31 | Closing price | 9.3100004196167 |
| 2026-04-01 | Closing price | 9.600000381469727 |
| 2026-04-02 | Closing price | 9.550000190734863 |
| 2026-04-06 | Closing price | 9.5600004196167 |
| 2026-04-07 | Closing price | 9.579999923706055 |
| 2026-04-08 | Closing price | 9.789999961853027 |
| 2026-04-09 | Closing price | 9.59000015258789 |
| 2026-04-10 | Closing price | 9.420000076293945 |
| 2026-04-13 | Closing price | 9.609999656677246 |
| 2026-04-14 | Closing price | 9.979999542236328 |
| 2026-04-15 | Closing price | 9.859999656677246 |
| 2026-04-16 | Closing price | 9.720000267028809 |
| 2026-04-17 | Closing price | 10.180000305175781 |
| 2026-04-20 | Closing price | 10.09000015258789 |
| 2026-04-21 | Closing price | 9.380000114440918 |
| 2026-04-22 | Closing price | 9.720000267028809 |
| 2026-04-23 | Closing price | 9.4399995803833 |
| 2026-04-24 | Closing price | 9.649999618530273 |
| 2026-04-27 | Closing price | 9.720000267028809 |
| 2026-04-28 | Closing price | 9.220000267028809 |
| 2026-04-29 | Closing price | 8.899999618530273 |
| 2026-04-30 | Closing price | 9.229999542236328 |
| 2026-05-01 | Closing price | 9.199999809265137 |
| 2026-05-04 | Closing price | 9.09000015258789 |
| 2026-05-05 | Closing price | 8.59000015258789 |
| 2026-05-06 | Closing price | 9.3100004196167 |
| 2026-05-07 | Closing price | 10.149999618530273 |
| 2026-05-08 | Closing price | 10.029999732971191 |
| 2026-05-11 | Closing price | 11.319999694824219 |
| 2026-05-12 | Closing price | 11.460000038146973 |
| 2026-05-13 | Closing price | 11.279999732971191 |
| 2026-05-14 | Closing price | 10.789999961853027 |
| 2026-05-15 | Closing price | 9.8100004196167 |
| 2026-05-18 | Closing price | 9.489999771118164 |
| 2026-05-19 | Closing price | 9.010000228881836 |
| 2026-05-20 | Closing price | 9.359999656677246 |
| 2026-05-21 | Closing price | 9.329999923706055 |
| 2026-05-22 | Closing price | 9.229999542236328 |
| 2026-05-26 | Closing price | 9.600000381469727 |
| 2026-05-27 | Closing price | 9.319999694824219 |
| 2026-05-28 | Closing price | 9.739999771118164 |
| 2026-05-29 | Closing price | 9.970000267028809 |
| 2026-06-01 | Closing price | 9.770000457763672 |
| 2026-06-02 | Closing price | 9.850000381469727 |
| 2026-06-03 | Closing price | 9.170000076293945 |
| 2026-06-04 | Closing price | 9.260000228881836 |
| 2026-06-05 | Closing price | 8.0 |
| 2026-06-08 | Closing price | 8.039999961853027 |
| 2026-06-09 | Closing price | 7.829999923706055 |
| 2026-06-10 | Closing price | 7.420000076293945 |
| 2026-06-11 | Closing price | 8.100000381469727 |
| 2026-06-12 | Closing price | 8.59000015258789 |
| 2026-06-15 | Closing price | 9.109999656677246 |
| 2026-06-16 | Closing price | 9.300000190734863 |
| 2026-06-17 | Closing price | 8.859999656677246 |
| 2026-06-18 | Closing price | 8.609999656677246 |
| 2026-06-22 | Closing price | 8.550000190734863 |
| 2026-06-23 | Closing price | 8.010000228881836 |
| 2026-06-24 | Closing price | 7.710000038146973 |
| 2026-06-25 | Closing price | 8.039999961853027 |
| 2026-06-26 | Closing price | 8.329999923706055 |
| 2026-06-29 | Closing price | 8.229999542236328 |
| 2026-06-30 | Closing price | 8.279999732971191 |
| 2026-07-01 | Closing price | 8.34000015258789 |
| 2026-07-02 | Closing price | 8.5600004196167 |
| 2026-07-06 | Closing price | 8.510000228881836 |
| 2026-07-07 | Closing price | 8.020000457763672 |
| 2026-07-08 | Closing price | 7.71999979019165 |
| 2026-07-09 | Closing price | 8.239999771118164 |
| 2026-07-10 | Closing price | 8.079999923706055 |
| 2026-07-13 | Closing price | 7.840000152587891 |
| 2026-07-14 | Closing price | 8.079999923706055 |
| 2026-07-15 | Closing price | 7.960000038146973 |
| 2026-07-16 | Closing price | 7.489999771118164 |
| 2026-07-17 | Closing price | 7.409999847412109 |
| 2026-07-20 | Closing price | 7.5 |
| 2026-07-21 | Closing price | 8.199999809265137 |
| 2026-07-22 | Closing price | 8.34000015258789 |
| 2026-07-23 | Closing price | 7.909999847412109 |
| 2026-07-24 | Closing price | 7.820000171661377 |
| 2026-07-27 | Closing price | 7.940000057220459 |
| 2026-07-28 | Closing price | 7.75 |
| 2026-07-29 | Closing price | 7.559999942779541 |
| 2026-07-30 | Closing price | 7.769999980926514 |
| 2026-07-31 | Closing price | 7.519999980926514 |
| 2026-08-03 | Closing price | 7.730000019073486 |
| 2026-08-04 | Closing price | 8.329999923706055 |
| 2026-08-05 | Closing price | 8.960000038146973 |
| 2026-08-06 | Closing price | 8.829999923706055 |
| 2026-08-07 | Closing price | 9.539999961853027 |
| 2026-08-10 | Closing price | 10.239999771118164 |
| 2026-08-11 | Closing price | 10.59000015258789 |
| 2026-08-12 | Closing price | 10.609999656677246 |
| 2026-08-13 | Closing price | 10.3100004196167 |
| 2026-08-14 | Closing price | 10.65999984741211 |
| 2026-08-17 | Closing price | 10.140000343322754 |
| 2026-08-18 | Closing price | 9.65999984741211 |
| 2026-08-19 | Closing price | 10.989999771118164 |
| 2026-08-20 | Closing price | 10.970000267028809 |
| 2026-08-21 | Closing price | 10.619999885559082 |
| 2026-08-24 | Closing price | 10.760000228881836 |
| 2026-08-25 | Closing price | 11.09000015258789 |
| 2026-08-26 | Closing price | 10.890000343322754 |
| 2026-08-27 | Closing price | 11.300000190734863 |
| 2026-08-28 | Closing price | 10.760000228881836 |
| 2026-08-31 | Closing price | 10.710000038146973 |
| 2026-09-01 | Closing price | 10.239999771118164 |
| 2026-09-02 | Closing price | 11.130000114440918 |
| 2026-09-03 | Closing price | 11.470000267028809 |
| 2026-09-04 | Closing price | 11.119999885559082 |
| 2026-09-08 | Closing price | 11.130000114440918 |
| 2026-09-09 | Closing price | 11.149999618530273 |
| 2026-09-10 | Closing price | 10.520000457763672 |
| 2026-09-11 | Closing price | 10.180000305175781 |
| 2026-09-14 | Closing price | 9.720000267028809 |
| 2026-09-15 | Closing price | 9.640000343322754 |
| 2026-09-16 | Closing price | 9.529999732971191 |
| 2026-09-17 | Closing price | 10.170000076293945 |
| 2026-09-18 | Closing price | 10.210000038146973 |
| 2026-09-21 | Closing price | 10.130000114440918 |
| 2026-09-22 | Closing price | 10.510000228881836 |
| 2026-09-23 | Closing price | 9.260000228881836 |
| 2026-09-24 | Closing price | 9.15999984741211 |
| 2026-09-25 | Closing price | 9.390000343322754 |
| 2026-09-28 | Closing price | 8.960000038146973 |
| 2026-09-29 | Closing price | 8.739999771118164 |
| 2026-09-30 | Closing price | 8.579999923706055 |
| 2026-10-01 | Closing price | 8.5600004196167 |
| 2026-10-02 | Closing price | 8.600000381469727 |
| 2026-10-05 | Closing price | 8.600000381469727 |
| 2026-10-06 | Closing price | 8.670000076293945 |
| 2026-10-07 | Closing price | 8.319999694824219 |
| 2026-10-08 | Closing price | 8.569999694824219 |
| 2026-10-09 | Closing price | 8.649999618530273 |
| 2026-10-12 | Closing price | 8.539999961853027 |
| 2026-10-13 | Closing price | 8.239999771118164 |
| 2026-10-14 | Closing price | 7.829999923706055 |
| 2026-10-15 | Closing price | 8.289999961853027 |
| 2026-10-16 | Closing price | 8.239999771118164 |
| 2026-10-19 | Closing price | 8.260000228881836 |
| 2026-10-20 | Closing price | 8.199999809265137 |
| 2026-10-21 | Closing price | 8.3100004196167 |
| 2026-10-22 | Closing price | 7.650000095367432 |
| 2026-10-23 | Closing price | 7.46999979019165 |
| 2026-10-26 | Closing price | 7.489999771118164 |
| 2026-10-27 | Closing price | 7.820000171661377 |
| 2026-10-28 | Closing price | 7.96999979019165 |
| 2026-10-29 | Closing price | 7.760000228881836 |
| 2026-10-30 | Closing price | 7.210000038146973 |
| 2026-11-02 | Closing price | 7.230000019073486 |
| 2026-11-03 | Closing price | 7.03000020980835 |
| 2026-11-04 | Closing price | 7.829999923706055 |
| 2026-11-05 | Closing price | 7.590000152587891 |
| 2026-11-06 | Closing price | 7.840000152587891 |
| 2026-11-09 | Closing price | 8.34000015258789 |
| 2026-11-10 | Closing price | 8.069999694824219 |
| 2026-11-11 | Closing price | 8.119999885559082 |
| 2026-11-12 | Closing price | 7.829999923706055 |
On the portal's model the share is 73% above fair value, and EV/EBITDA at current prices is 16.5
On the portal's model, which re-prices EBITDA to current metal prices at the target EV/EBITDA, the share's fair value is 73% below the current market price. This is our own estimate, not a market consensus and not a target price.
The trailing EV/EBITDA multiple is 6.8, P/E is 17.3. But LTM earnings were earned at high prices, so the multiple to them is not indicative. At current prices EV/EBITDA of 16.5 is expensive, and that is the multiple that decides the valuation.
Valuation on the latest reported figures
| Metric | Value |
|---|---|
| Market cap | 2.31 bn USD |
| P/E (LTM) | 17.3 |
| EV/EBITDA (LTM) | 6.8 |
| P/B | 4.77 |
| Net debt / EBITDA (LTM) | -0.11 |
| Operating cash flow (LTM) | 0.15 bn |
| ROE | 14.5% |
Net profit by quarter
| Period | Measure | bn USD |
|---|---|---|
| Q4 2024 | Net profit | 0.0011559999999999988 |
| Q1 2025 | Net profit | −0.0329 |
| Q2 2025 | Net profit | −0.020454999999999997 |
| Q3 2025 | Net profit | −0.041491 |
| Q4 2025 | Net profit | −0.023782 |
| Q1 2026 | Net profit | 0.0649 |
| Q2 2026 | Net profit | 0.0665 |
| Q3 2026 | Net profit | 0.0264 |
Bottom line
The strong side of the report is cash flow: 76.5 million dollars of operating flow in the quarter against 27.3 million of capital spending and net cash of 37.2 million. But almost all of the EBITDA growth is the silver price, not better costs or volumes. The 12.6% gap between price and actual EBITDA shows the company earns less than the metal market implies. At today's prices EBITDA falls to 138.1 million dollars, and EV/EBITDA at current prices is 16.5. Our conclusion: rather unattractive – on the portal's model the share's fair value is 73% below the current price. Our view: the share is rather unattractive at the current price; upside on the portal model -73%.