Freeport-McMoRan: revenue accelerated to +8.2%, but profit lagged behind

Freeport-McMoRan reported results for the third quarter of 2026. Revenue came in at $7,546 million, operating profit at $2,353 million, and net profit at $1,174 million. Year-on-year revenue growth accelerated to +8.2% after a decline of 8.8% a quarter earlier, yet net profit fell 5.9% and the net margin slipped to 15.6% from 17.9%. At the current price the share looks rather unattractive: the EV/EBITDA multiple of 11.1x is 41% above its own three-year average, and the portal's model implies a downside of 37%.
Key takeaways
— Revenue rose 8.2% year on year, an acceleration after a decline of 8.8% a quarter earlier
— Net profit fell 5.9%, and the net margin dropped to 15.6% from 17.9%
— Operating profit of $2,353 million exceeded last year's $1,972 million, but net profit did not hold that level
— Operating cash flow of $1,981 million exceeded net profit, but capital expenditure for the period is not disclosed
— Leverage at 0.73x LTM EBITDA remains moderate
— A dividend yield of 0.9% barely offsets the re-rating risk
— EV/EBITDA of 11.1x is 41% above its own three-year average of 7.9x
Attractiveness
Key figures, USD bn
| Metric | Q3 2025 | Q3 2026 | Change |
|---|---|---|---|
| Revenue | 6.97 | 7.55 | +8.2% |
| EBITDA | 2.60 | — | — |
| Operating profit | 1.97 | 2.35 | +19.3% |
| Net profit | 1.25 | 1.17 | -5.9% |
| Operating cash flow | 1.66 | 1.98 | +19.1% |
| Capex | 1.06 | — | — |
| EBITDA margin | 37.2% | — | — |
| Net margin | 17.9% | 15.6% | -2.3 pp |
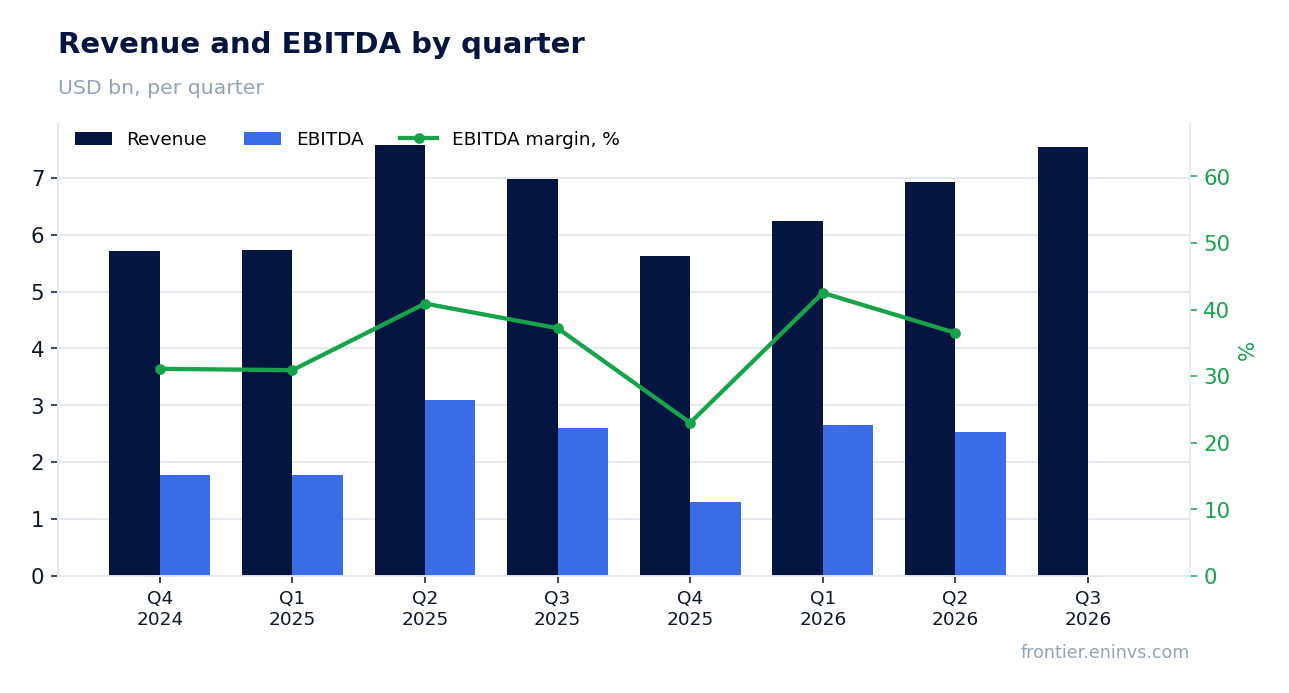
Revenue rose 8.2% year on year, an acceleration after a decline of 8.8% a quarter earlier
In the third quarter of 2026, revenue reached $7,546 million, up 8.2% year on year. In the second quarter the dynamic was negative at minus 8.8%, so the current growth marks a reversal. The acceleration was driven primarily by copper: revenue added more than $600 million quarter on quarter.
For a commodity producer, such a reversal is sensitive to the metal price. The report does not disclose how much of the growth came from volume versus price, so the durability of the improvement cannot yet be assessed. The next quarter will show whether this was a one-off price spike or the start of a cycle.
Net profit fell 5.9%, and the net margin dropped to 15.6% from 17.9%
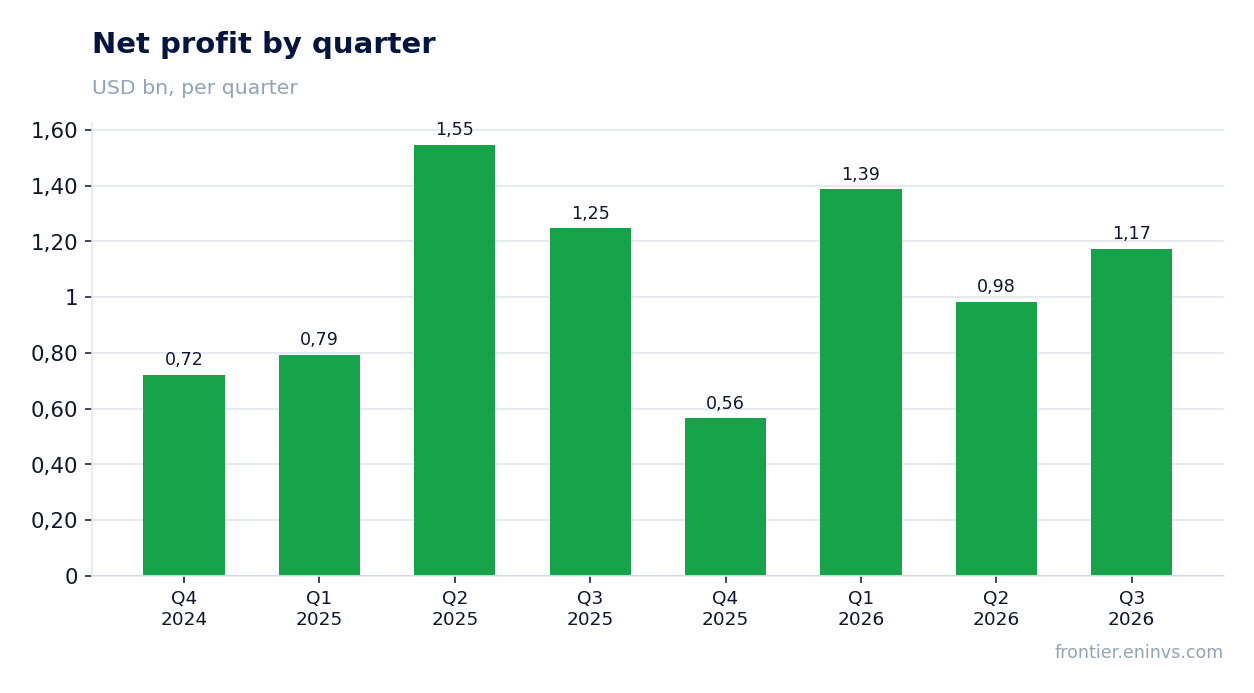
Net profit for the third quarter of 2026 was $1,174 million versus $1,247 million a year earlier, a decline of 5.9%. The net margin fell to 15.6% from 17.9%. This happened despite revenue growth, meaning costs or tax charges rose faster than income.
Operating profit, by contrast, increased to $2,353 million from $1,972 million, so the pressure on the bottom line arose below the operating line. The report does not detail what exactly ate into profit – interest expense, taxes, or one-off items. Without that, it is impossible to say whether this is a one-off or a new normal.
Operating profit of $2,353 million exceeded last year's $1,972 million, but net profit did not hold that level
Operating profit rose to $2,353 million from $1,972 million a year earlier. This means the company is operating better than a year ago, and revenue growth is converting into profit before interest and taxes. Yet net profit declined, and the gap between the two lines points to higher financial or tax costs.
The report does not disclose the structure of this gap. For an investor, what matters is that operating efficiency did not deteriorate, and the weakness is concentrated below the operating line. If the pressure stems from one-off items, net profit could recover as early as next quarter.
Operating cash flow of $1,981 million exceeded net profit, but capital expenditure for the period is not disclosed
Operating cash flow for the third quarter of 2026 was $1,981 million, above net profit of $1,174 million. This means the company generates cash faster than it books profit, typically through depreciation and working capital changes. Over the trailing twelve months, operating cash flow reached $6,217 million.
Capital expenditure for the reporting quarter is not disclosed in the facts, so free cash flow cannot be assessed. In prior quarters, capex was significant – for example, $1,104 million in the second quarter of 2026. Without this figure, it is impossible to judge how much cash remains for dividends and debt reduction.
Leverage at 0.73x LTM EBITDA remains moderate
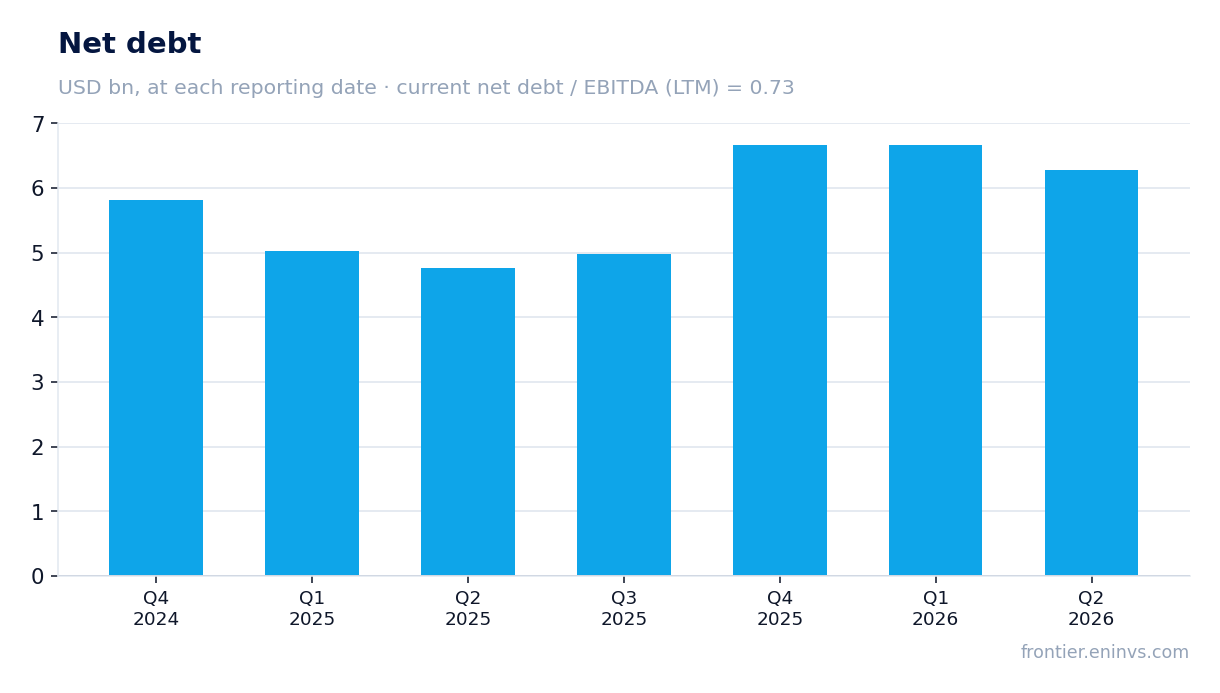
Net debt at the latest balance sheet date was $6,668 million, and the ratio of net debt to trailing twelve-month EBITDA was 0.73. This is a moderate level for a commodity company, leaving room to manoeuvre if metal prices fall.
The direction of change in this ratio is not disclosed in the facts, so it cannot be claimed that leverage is rising or falling. All that is known is that absolute net debt of $6,668 million is comparable to trailing twelve-month EBITDA of $9,105 million. Such a cushion matters if revenue turns down again.
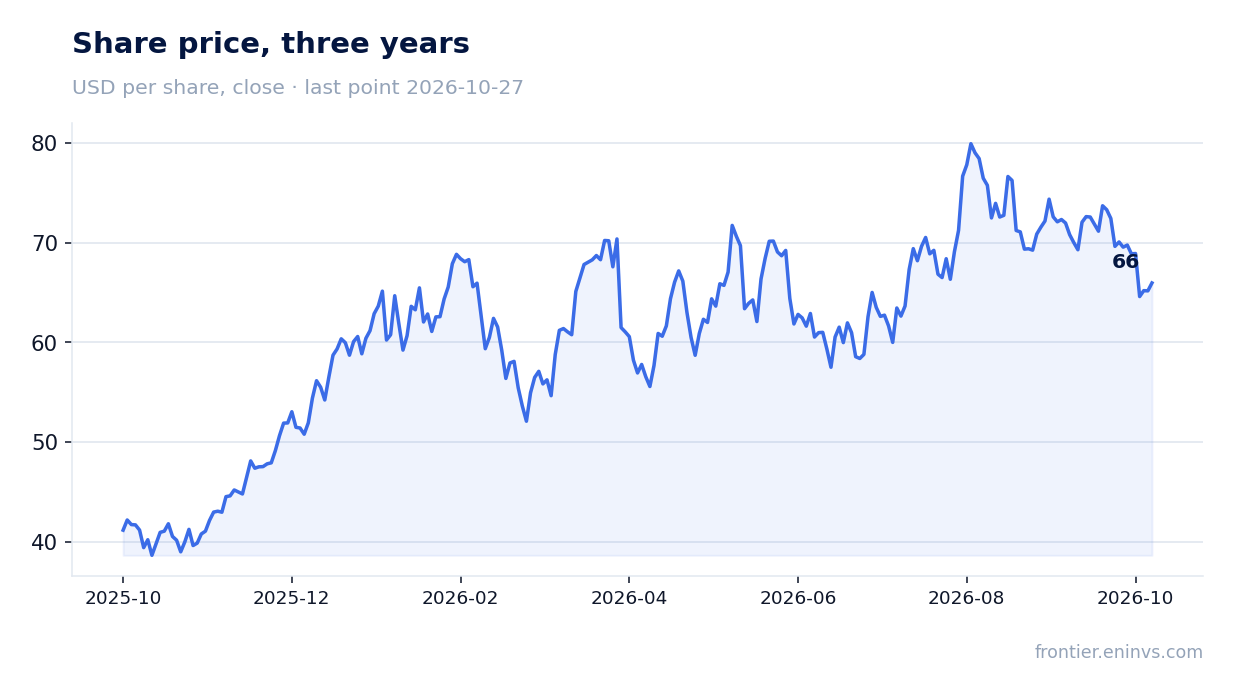
A dividend yield of 0.9% barely offsets the re-rating risk
The trailing twelve-month dividend yield is 0.9%. This is a modest level that provides little support for the share. At the current price, the dividend covers only a small fraction of what an investor could earn from risk-free instruments.
The facts do not include the current-year payout or the dividend policy, so the sustainability of the payment cannot be assessed. If profit continues to decline while capital expenditure remains high, the dividend could be revised. For a commodity company with cyclical revenue, this is an additional risk.
EV/EBITDA of 11.1x is 41% above its own three-year average of 7.9x
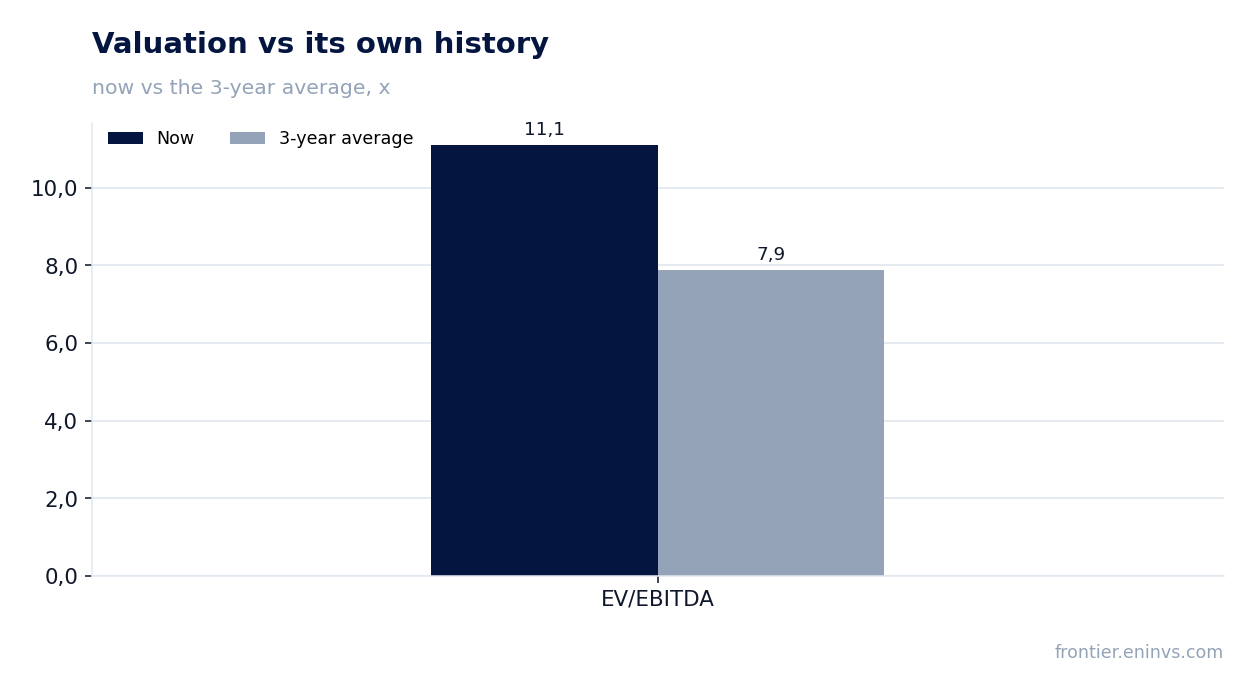
The trailing twelve-month EV/EBITDA multiple is 11.1x, while its own three-year average is 7.9x. The share trades 41% above where it has typically been over the past three years. This means the market has already priced in a profit recovery that is not yet visible in the report.
The portal's model, which re-prices EBITDA at current commodity prices at the target multiple, implies a downside of 37% to the current market capitalisation. This is not a consensus but our own estimate, and it points to overvaluation. For comparison, the trailing twelve-month P/E is 23.0 – also not cheap for a company with falling net profit.
Valuation on the latest reported figures
| Metric | Value |
|---|---|
| Market cap | 94.5 bn USD |
| P/E (LTM) | 23.0 |
| EV/EBITDA (LTM) | 11.1 |
| P/B | 5.00 |
| Net debt / EBITDA (LTM) | 0.73 |
| Operating cash flow (LTM) | 6.22 bn |
| ROE | 19.9% |
| Dividend yield (12m) | 0.9% |
| EV/EBITDA, 3-year average | 7.9 |
Bottom line
The strong point of the report was the revenue reversal: growth of 8.2% after a decline of 8.8% a quarter earlier, and operating profit rising to $2,353 million. However, net profit fell 5.9% and the margin dropped to 15.6% – the operating success did not reach the bottom line. Leverage at 0.73x EBITDA remains moderate, but a dividend yield of 0.9% provides no support. The key question for a holder is whether the current valuation of 11.1x EBITDA against a three-year average of 7.9x and a 37% downside on the portal's model is justified. The verdict is rather unattractive.
Open the company's financial profile FCX →
See also: market overview · valuation map · stock screeners