First Quantum Minerals: revenue up 55% on copper prices, but 2.89x EBITDA leverage and the portal model point to 51% downside to fair value
First Quantum Minerals reported third-quarter 2026 results in early November: revenue of $2,086.0 million, EBITDA of $782.0 million, and net profit of $207.0 million. Revenue grew 55.0% year on year after 24.1% in the second quarter, and the EBITDA margin rose to 37.5% from 31.1% a year earlier. Leverage nonetheless stands at 2.89x trailing-twelve-month EBITDA, and on the portal's model the share trades 51% above fair value, so at the current price the stock looks unattractive.
Key takeaways
— Revenue accelerated to 55.0% year on year, and the entire gain came from the copper price, not volumes
— EBITDA rose 86.6% and the margin climbed to 37.5% from 31.1% – operating leverage worked on higher prices
— Net profit of $207.0 million at a 9.9% margin lags far behind EBITDA because of interest and depreciation
— Leverage of 2.89x trailing-twelve-month EBITDA remains the main constraint on equity value
— Operating cash flow of $600.0 million for the quarter goes to debt service and construction
— The EV/EBITDA multiple of 14.8x is above the company's own three-year average – the market has already priced in a cycle peak
— On the portal's model fair value is 51% below the current price, and that is the main argument against buying
Attractiveness
Key figures, USD bn
| Metric | Q3 2025 | Q3 2026 | Change |
|---|---|---|---|
| Revenue | 1.35 | 2.09 | +55.0% |
| EBITDA | 0.42 | 0.78 | +86.6% |
| Operating profit | 0.22 | 0.55 | +146.2% |
| Net profit | — | 0.21 | — |
| Operating cash flow | 1.20 | 0.60 | -49.8% |
| EBITDA margin | 31.1% | 37.5% | +6.4 pp |
| Net margin | — | 9.9% | — |
Revenue accelerated to 55.0% year on year, and the entire gain came from the copper price, not volumes
Revenue in the third quarter of 2026 was $2,086.0 million against $1,346.0 million a year earlier – growth of 55.0%. That is markedly faster than the 24.1% in the second quarter, when revenue was $1,522.0 million. The acceleration is almost entirely explained by the copper price: production volumes are not disclosed in the facts as a driver, and there is no data on shipment growth.
For comparison, revenue grew 18.0% in the first quarter of 2026, 24.1% in the second, and 55.0% in the third. This dynamic shows the company is operating in a price-rally mode rather than expanding capacity. If the copper price reverses, revenue could fall as quickly as it rose.
Trailing-twelve-month revenue was $5,200.0 million. That is the level the company achieved on high prices over the year, and it sets the base for comparison in the next quarter.
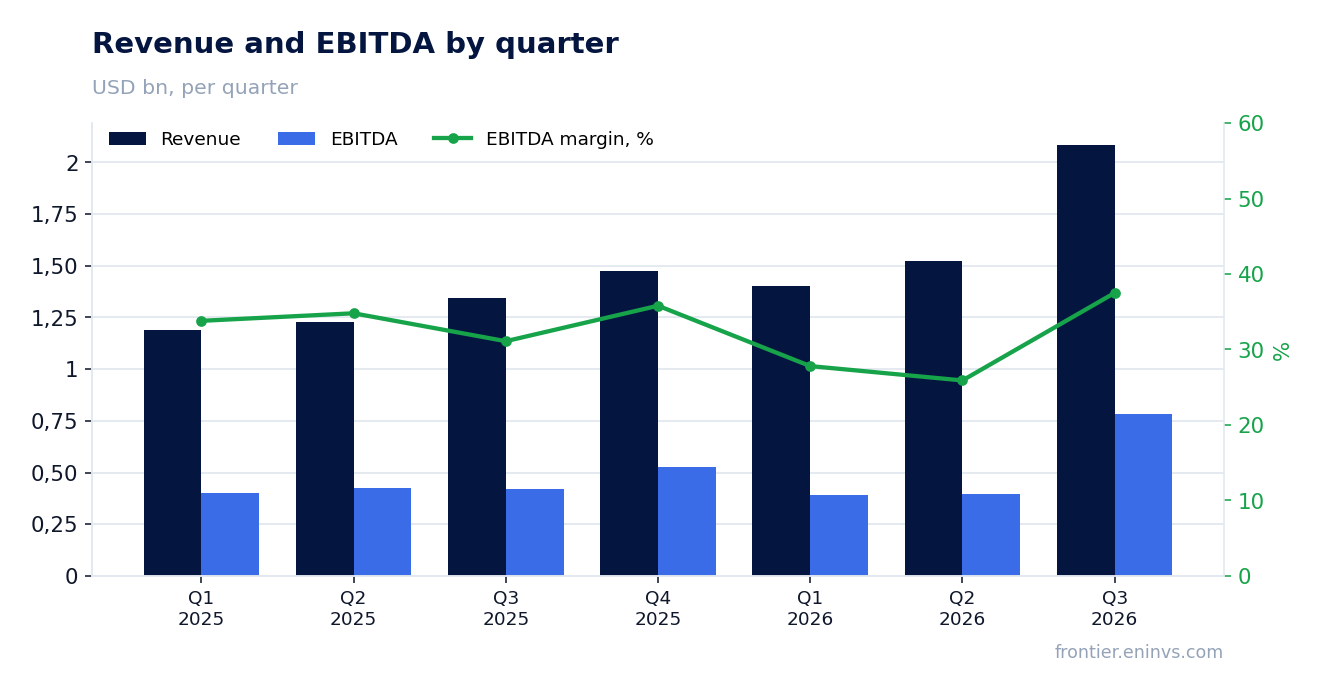
EBITDA rose 86.6% and the margin climbed to 37.5% from 31.1% – operating leverage worked on higher prices
EBITDA in the third quarter of 2026 was $782.0 million, 86.6% more than a year earlier. The EBITDA margin rose to 37.5% from 31.1% in the third quarter of 2025. Operating profit was $549.0 million, meaning depreciation and other non-cash items accounted for about $233.0 million.
A 6.4 percentage-point margin expansion on 55.0% revenue growth means costs are rising more slowly than revenue. This is the classic operating-leverage effect: with fixed costs, each additional tonne of copper sold at a high price brings disproportionately large profit. The facts do not break down cost lines, so it is impossible to say which line drove it.
Trailing-twelve-month EBITDA was $1,795.4 million. That level matters for leverage and the multiple, but it reflects the prices of the last four quarters, not the current moment.
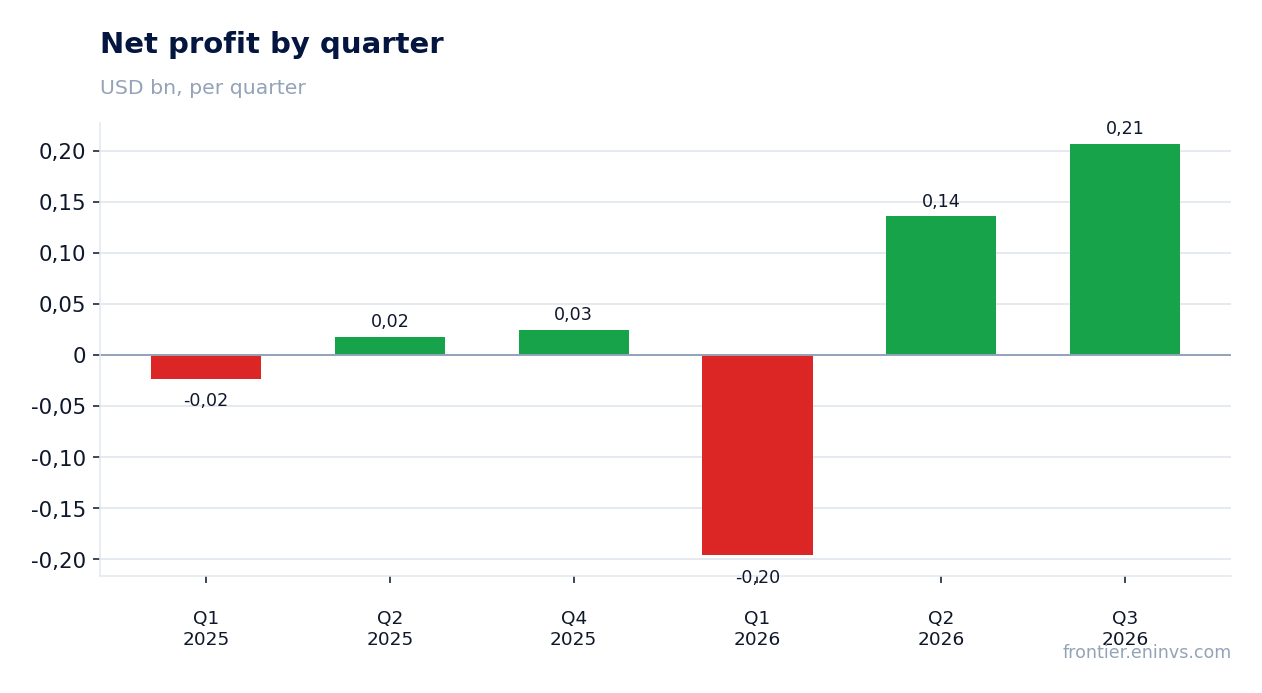
Net profit of $207.0 million at a 9.9% margin lags far behind EBITDA because of interest and depreciation
Net profit in the third quarter of 2026 was $207.0 million on revenue of $2,086.0 million, a net margin of 9.9%. That is 3.8 times less than EBITDA. The gap is explained by depreciation, interest on debt, and taxes.
For comparison, net profit was $136.0 million in the second quarter of 2026 and a loss of $196.0 million in the first. The recovery in the third quarter is tied to higher revenue and margin, but the absolute level is still small relative to debt. With debt of $5,192.0 million and interest rates not disclosed in the facts, interest expense remains a heavy burden.
Return on equity (ROE) is 4.86% – a low figure for a mining company in a high-copper-price phase. This means equity capital is working inefficiently, and most of the profit goes to creditors.
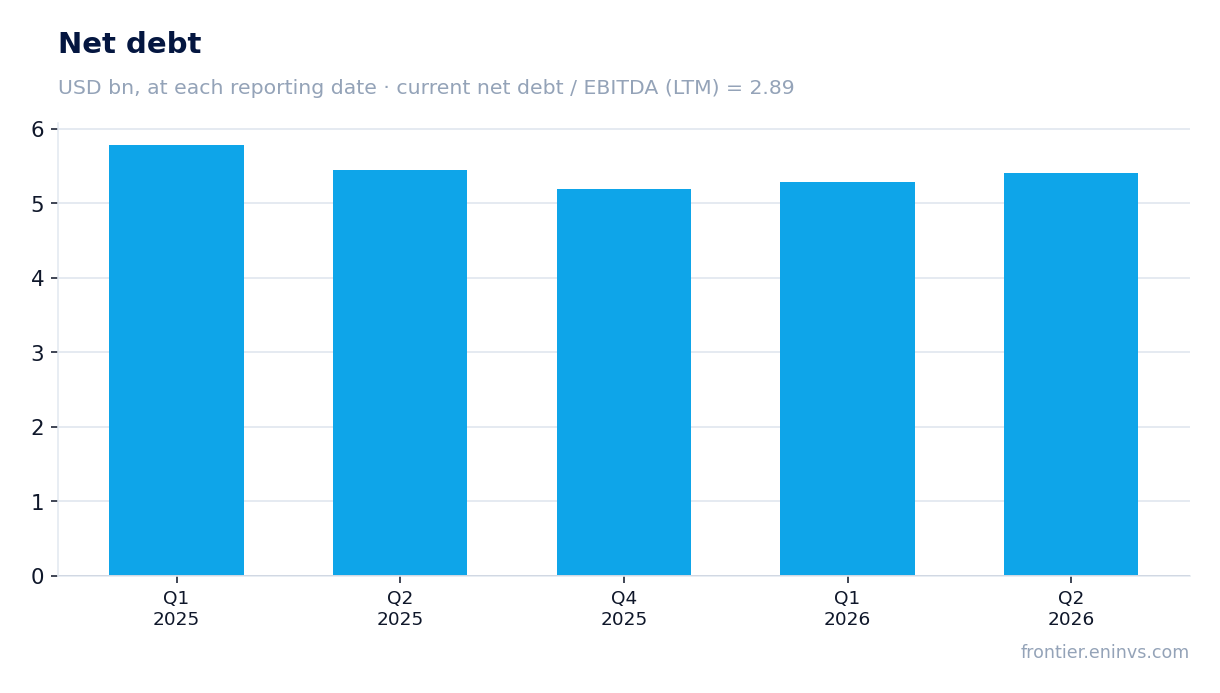
Leverage of 2.89x trailing-twelve-month EBITDA remains the main constraint on equity value
Net debt at the latest balance-sheet date is $5,192.0 million, and the ratio of net debt to trailing-twelve-month EBITDA is 2.89x. This level limits the company's ability to pay dividends and buy back shares. The facts do not contain an earlier value of this ratio, so it is impossible to say whether leverage rose or fell.
Debt service consumes a significant portion of operating profit. With quarterly EBITDA of $782.0 million and interest expense not disclosed, the company must direct free cash flow to debt repayment rather than development or shareholder returns.
Reducing debt below 2.0x EBITDA would be a signal for a re-rating of the shares. For now, the 2.89x ratio remains high for a company with a market capitalisation of $21.3 billion and volatile revenue.
Operating cash flow of $600.0 million for the quarter goes to debt service and construction
Operating cash flow in the third quarter of 2026 was $600.0 million. That is less than in the second quarter ($130.0 million) but more than in the first ($420.0 million). Over the last twelve months operating cash flow was $984.0 million.
Capital expenditure in the third quarter is not disclosed in the facts, but it was $322.0 million in the second quarter and $266.0 million in the first. Assuming a similar level, free cash flow after capex in the third quarter could have been around $280.0 million. These funds go to debt service and maintaining production.
For shareholders, it matters that even with record revenue free cash flow does not cover the company's ambitious development plans. This means dividends or buybacks are possible only after debt reduction or further copper-price gains.
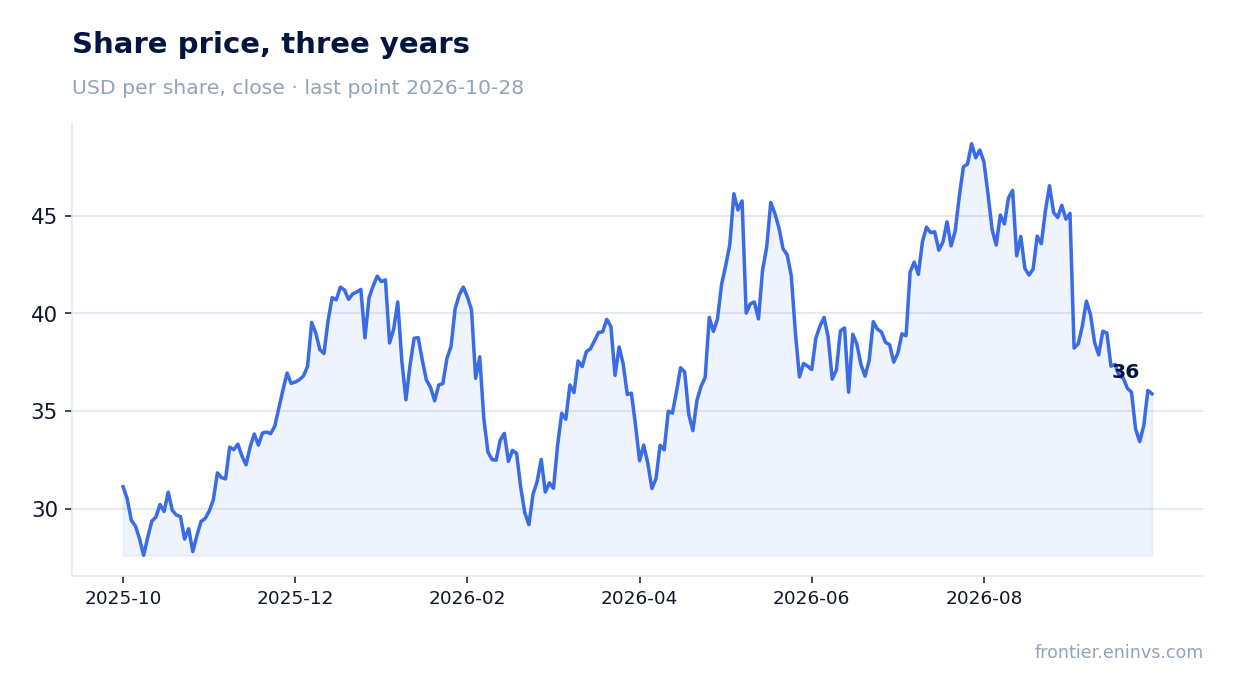
The EV/EBITDA multiple of 14.8x is above the company's own three-year average – the market has already priced in a cycle peak
EV/EBITDA on a trailing-twelve-month basis is 14.76x. That is a high level for a mining company, and it is above First Quantum Minerals' own three-year average. The market values the company on current high copper prices rather than cycle averages.
Market capitalisation is $21.3 billion, net debt is $5,192.0 million. With trailing-twelve-month EBITDA of $1,795.4 million, an EV/EBITDA of 14.76x means investors pay almost 15 times each dollar of annual EBITDA. That is justified only if copper prices stay high or rise further.
On the portal's model, which re-prices EBITDA at current commodity prices and a target multiple, fair value is 51% below the current price. This is our own calculation, not a market consensus, but it shows the current valuation embeds an overly optimistic scenario.
On the portal's model fair value is 51% below the current price, and that is the main argument against buying
Our model re-prices EBITDA at current copper prices and applies a target EV/EBITDA multiple. The result is a fair value 51% below the current market price. This means the market values the company significantly above what the model implies at current commodity prices.
The model is not a share-price forecast and does not account for possible changes in capital structure, but it provides a benchmark for attractiveness. At the current price the stock trades at a premium to fair value, which limits upside.
To change the verdict, either the share price would need to fall closer to fair value, or copper prices would need to rise enough to lift EBITDA and justify the current valuation. Neither has happened yet.
Valuation on the latest reported figures
| Metric | Value |
|---|---|
| Market cap | 21.3 bn USD |
| EV/EBITDA (LTM) | 14.8 |
| P/B | 1.91 |
| Net debt / EBITDA (LTM) | 2.89 |
| Operating cash flow (LTM) | 0.98 bn |
| ROE | 4.9% |
Bottom line
The quarter was strong on revenue and EBITDA: growth of 55.0% and 86.6% respectively, with the margin rising to 37.5%. However, all of this growth is due to copper prices rather than volumes, and it does not translate into net profit proportionally: the net margin is just 9.9%, ROE is 4.86%. Leverage of 2.89x EBITDA and an EV/EBITDA multiple of 14.76x, above its own history, leave little room for valuation growth. On the portal's model fair value is 51% below the current price, so at the current price the stock looks unattractive. A re-rating would require either a substantial rise in copper prices or a reduction in leverage below 2.0x EBITDA.
Open the company's financial profile FQM →
See also: market overview · valuation map · stock screeners