Fortuna Mining: silver rose 57.6%, yet EBITDA came in $82.0m below what the price allowed
Contents
On 11 November Fortuna Mining reported third-quarter 2026 results. The average silver price in the period was $62.8 versus $39.9 a year earlier (+57.6%), gold rose to $4,268 from $3,459 (+23.4%). Revenue grew 16.7% to $293.4m, EBITDA 17.4% to $162.3m, while net profit fell 61.3% to $47.8m. At the year-ago volumes and costs, our calculation shows those prices should have delivered $357.4m of revenue and $244.3m of EBITDA – the company came in $64.0m and $82.0m short respectively. Our conclusion: rather unattractive – on the portal's model the share stands 71% below fair value. Our view: the share is rather unattractive at the current price; upside on the portal model -71%.
Our view: is there upside
Our view in numbers
| Metric | Our read |
|---|---|
| Verdict | Rather unattractive |
| Upside on the portal model | -71% |
| How the model works | spot model: EBITDA re-priced to current commodity prices at the target EV/EBITDA, against market cap |
| Net debt / EBITDA | -0.36 – net cash |
| Strongest case for | Net cash of $295.1m and $61.7m of free cash flow for the quarter give the company a cushion most silver producers do not have. |
| Strongest case against | With silver up 57.6% year on year, EBITDA grew only 17.4%, and our calculation shows an $82.0m shortfall to the price-implied benchmark – the price rise does not reach profit. |
| What would change the view | A return of silver above $62.8 an ounce or at least a halving of the gap to price-implied EBITDA would move the verdict one step up, to neutral. |
Key takeaways
— Silver averaged $62.8 in the reported quarter – 57.6% above a year earlier, but already 14.1% below the previous quarter
— At the year-ago volumes and costs, our calculation shows those prices should have delivered $244.3m of EBITDA – the company earned $162.3m, $82.0m less
— Revenue grew 16.7% year on year but decelerated from 38.2% in the previous quarter – prices no longer pull it with the same force
— The EBITDA margin held at 55.3% versus 55.0% a year earlier, while the net margin collapsed from 49.2% to 16.3% – profit was eaten by a one-off in last year's base
— Net cash of $295.1m and net debt to EBITDA of minus 0.36 – there is no debt burden
— Free cash flow of $61.7m for the quarter on $50.6m of capex – the mine still pays for itself
— On the portal's model, annual EBITDA at today's prices is $533m against $767m over the last twelve months, and EV/EBITDA is 4.9
Key figures, USD bn
| Metric | Q3 2025 | Q3 2026 | Change |
|---|---|---|---|
| Revenue | 0.25 | 0.29 | +16.7% |
| EBITDA | 0.14 | 0.16 | +17.4% |
| Operating profit | 0.09 | 0.11 | +27.5% |
| Net profit | 0.12 | 0.05 | -61.3% |
| Operating cash flow | 0.11 | 0.11 | +1.9% |
| Capex | 0.05 | 0.05 | +5.3% |
| EBITDA margin | 55.0% | 55.3% | +0.3 pp |
| Net margin | 49.2% | 16.3% | -32.9 pp |
Silver averaged $62.8 in the reported quarter – 57.6% above a year earlier, but already 14.1% below the previous quarter
Silver accounts for 55% of Fortuna Mining's sales, and its average price in the third quarter of 2026 was $62.8 per ounce versus $39.9 a year earlier – a rise of 57.6%. Gold, which brings 45% of revenue, averaged $4,268 versus $3,459, up 23.4%.
Both metals fell against the previous quarter: silver by 14.1% from $73.1, gold by 5.5% from $4,514. As of 11 November 2026, spot silver is $52.3, 16.8% below the reported-period average, and gold is $4,045, 5.2% below.
For the company this means the quarter ran at peak prices, while the next report will come at a more modest backdrop. Reserve life is 4.4 years at the current production rate – the volume cushion is limited.
Commodity prices: period average and now
| Benchmark | Year ago | Q3 2026 | YoY | Spot 2026-11-11 |
|---|---|---|---|---|
| Silver, USD | 39,9 | 62,8 | +57,6% | 52,3 |
| Gold, USD | 3 459 | 4 268 | +23,4% | 4 045 |
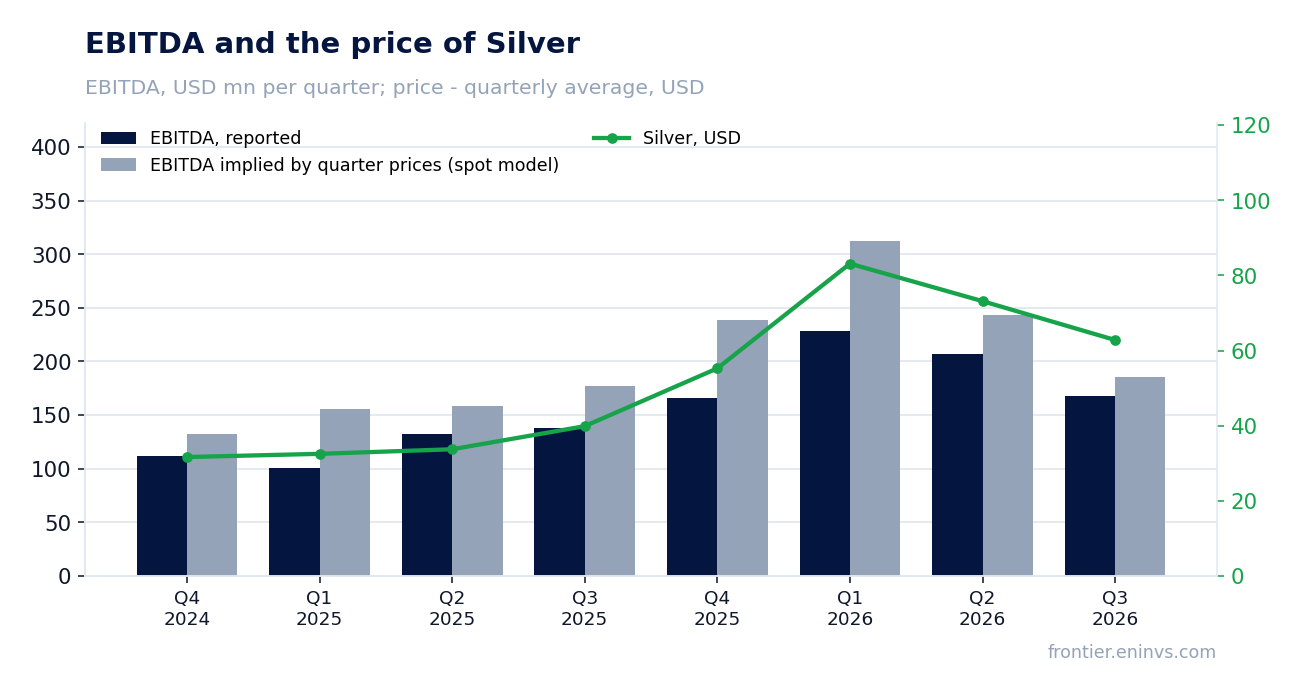
At the year-ago volumes and costs, our calculation shows those prices should have delivered $244.3m of EBITDA – the company earned $162.3m, $82.0m less
Holding third-quarter 2025 volumes and non-commodity costs and moving only silver and gold prices, revenue would have been $357.4m and EBITDA $244.3m. The company actually reported $293.4m of revenue and $162.3m of EBITDA: $64.0m (−17.9%) and $82.0m (−33.6%) below the calculation.
Against the previous quarter the picture is reversed: at second-quarter 2026 volumes and costs, prices implied $285.8m of revenue and $174.6m of EBITDA, while the actual $293.4m and $162.3m came in $7.6m (+2.7%) above on revenue and $12.3m (−7.1%) below on EBITDA.
The portal's spot model, built from the average of the previous four quarters, expected $297.8m of revenue and $185.2m of EBITDA – the actual was 1.5% below on revenue and 12.3% below on EBITDA. In the four preceding quarters the EBITDA deviation from the model ranged from −15.9% to −29.0%, so the company systematically undershoots the price-implied benchmark.
The gap is explained by volumes, the realised price against the benchmark and unit costs; the facts do not allow it to be split between these causes. The very existence of the gap against such a price rise is the main question for the report.
What the prices implied and what the company earned
| Base (Q3 2025) | Implied at period prices | Reported | Reported vs implied | |
|---|---|---|---|---|
| Revenue, USD mn | 251,4 | 357,4 | 293,4 | -17,9% |
| EBITDA, USD mn | 138,2 | 244,3 | 162,3 | -33,6% |
| EBITDA, portal spot model, USD mn | — | 185,2 | 162,3 | -12,3% |
Revenue and EBITDA by quarter
| Period | Measure | bn USD |
|---|---|---|
| Q4 2024 | Revenue | 0.30077099999999996 |
| Q1 2025 | Revenue | 0.19503700000000002 |
| Q2 2025 | Revenue | 0.230419 |
| Q3 2025 | Revenue | 0.251362 |
| Q4 2025 | Revenue | 0.270241 |
| Q1 2026 | Revenue | 0.342471 |
| Q2 2026 | Revenue | 0.318413 |
| Q3 2026 | Revenue | 0.293435 |
| Q4 2024 | EBITDA | 0.11208 |
| Q1 2025 | EBITDA | 0.100539 |
| Q2 2025 | EBITDA | 0.132065 |
| Q3 2025 | EBITDA | 0.13824 |
| Q4 2025 | EBITDA | 0.165643 |
| Q1 2026 | EBITDA | 0.228092 |
| Q2 2026 | EBITDA | 0.207208 |
| Q3 2026 | EBITDA | 0.167624 |
EBITDA margin
| Period | Measure | % |
|---|---|---|
| Q4 2024 | EBITDA margin | 37.3 |
| Q1 2025 | EBITDA margin | 51.5 |
| Q2 2025 | EBITDA margin | 57.3 |
| Q3 2025 | EBITDA margin | 55.0 |
| Q4 2025 | EBITDA margin | 61.3 |
| Q1 2026 | EBITDA margin | 66.6 |
| Q2 2026 | EBITDA margin | 65.1 |
| Q3 2026 | EBITDA margin | 57.1 |
Revenue grew 16.7% year on year but decelerated from 38.2% in the previous quarter – prices no longer pull it with the same force
Third-quarter 2026 revenue was $293.4m, 16.7% more than a year earlier. That is markedly slower than the 38.2% of the second quarter: the deceleration reflects silver falling 14.1% and gold 5.5% against the previous quarter.
Year on year, growth came from prices: silver +57.6%, gold +23.4%. But against the second-quarter peak the company is already operating at a lower backdrop, and the next report will come with spot silver at $52.3 – a further 16.8% below the reported-period average.
Operating profit was $108.7m versus $85.2m a year earlier, growing faster than revenue – unit costs, judging by that ratio, were not inflating.
The EBITDA margin held at 55.3% versus 55.0% a year earlier, while the net margin collapsed from 49.2% to 16.3% – profit was eaten by a one-off in last year's base
Third-quarter EBITDA was $162.3m on $293.4m of revenue, a 55.3% margin versus 55.0% a year earlier. The margin did not move despite higher prices: unit-cost inflation or lower volumes absorbed the price gain.
Net profit was $47.8m versus $123.6m a year earlier, down 61.3%. The net margin fell from 49.2% to 16.3%. With the EBITDA margin almost unchanged, such a collapse is explained by a one-off in last year's base: profit was inflated then, and this time it normalised.
For a holder this means the mine's operating economics did not deteriorate as much as net profit suggests. But the price rise is not converting into profit either: EBITDA grew only 17.4% while silver rose 57.6%.
Net cash of $295.1m and net debt to EBITDA of minus 0.36 – there is no debt burden
As of 30 September 2026 the company had net cash of $295.1m: cash exceeds debt. Net debt to EBITDA over the last twelve months is minus 0.36.
Operating cash flow for the quarter was $112.4m, capex $50.6m, so free cash flow was $61.7m. The mine funds itself and still builds cash.
With such a cushion, interest costs do not weigh on profit, and debt risk in the reported period is minimal. This is the main argument for the share.
Free cash flow of $61.7m for the quarter on $50.6m of capex – the mine still pays for itself
Operating cash flow of $112.4m minus $50.6m of capex gives $61.7m of free cash flow for the third quarter. Capex is 17.3% of revenue – reinvestment that keeps production at the current level.
With a 4.4-year reserve life, sustaining production requires constant spending, and $50.6m a quarter is the price the company pays for a stable volume. If prices move to spot, free cash flow will compress faster than EBITDA because capex is fixed.
Over the last twelve months operating cash flow was $819.9m – the level that underpins both dividend capacity and the cushion against falling prices.
Share price, three years
close, last point 2026-11-10
| Period | Measure | USD per share |
|---|---|---|
| 2025-11-10 | Closing price | 8.420000076293945 |
| 2025-11-11 | Closing price | 8.399999618530273 |
| 2025-11-12 | Closing price | 8.630000114440918 |
| 2025-11-13 | Closing price | 8.399999618530273 |
| 2025-11-14 | Closing price | 8.350000381469727 |
| 2025-11-17 | Closing price | 8.239999771118164 |
| 2025-11-18 | Closing price | 8.3100004196167 |
| 2025-11-19 | Closing price | 8.510000228881836 |
| 2025-11-20 | Closing price | 8.069999694824219 |
| 2025-11-21 | Closing price | 8.229999542236328 |
| 2025-11-24 | Closing price | 9.069999694824219 |
| 2025-11-25 | Closing price | 9.3100004196167 |
| 2025-11-26 | Closing price | 9.760000228881836 |
| 2025-11-28 | Closing price | 10.119999885559082 |
| 2025-12-01 | Closing price | 9.920000076293945 |
| 2025-12-02 | Closing price | 9.729999542236328 |
| 2025-12-03 | Closing price | 9.550000190734863 |
| 2025-12-04 | Closing price | 9.300000190734863 |
| 2025-12-05 | Closing price | 9.260000228881836 |
| 2025-12-08 | Closing price | 9.220000267028809 |
| 2025-12-09 | Closing price | 9.5 |
| 2025-12-10 | Closing price | 9.539999961853027 |
| 2025-12-11 | Closing price | 9.779999732971191 |
| 2025-12-12 | Closing price | 9.779999732971191 |
| 2025-12-15 | Closing price | 9.579999923706055 |
| 2025-12-16 | Closing price | 9.529999732971191 |
| 2025-12-17 | Closing price | 9.760000228881836 |
| 2025-12-18 | Closing price | 9.600000381469727 |
| 2025-12-19 | Closing price | 9.850000381469727 |
| 2025-12-22 | Closing price | 10.170000076293945 |
| 2025-12-23 | Closing price | 10.180000305175781 |
| 2025-12-24 | Closing price | 10.119999885559082 |
| 2025-12-26 | Closing price | 10.34000015258789 |
| 2025-12-29 | Closing price | 9.930000305175781 |
| 2025-12-30 | Closing price | 9.949999809265137 |
| 2025-12-31 | Closing price | 9.8100004196167 |
| 2026-01-02 | Closing price | 9.539999961853027 |
| 2026-01-05 | Closing price | 9.970000267028809 |
| 2026-01-06 | Closing price | 10.420000076293945 |
| 2026-01-07 | Closing price | 10.050000190734863 |
| 2026-01-08 | Closing price | 9.960000038146973 |
| 2026-01-09 | Closing price | 10.260000228881836 |
| 2026-01-12 | Closing price | 10.479999542236328 |
| 2026-01-13 | Closing price | 10.369999885559082 |
| 2026-01-14 | Closing price | 10.300000190734863 |
| 2026-01-15 | Closing price | 10.270000457763672 |
| 2026-01-16 | Closing price | 10.420000076293945 |
| 2026-01-20 | Closing price | 10.800000190734863 |
| 2026-01-21 | Closing price | 10.8100004196167 |
| 2026-01-22 | Closing price | 11.399999618530273 |
| 2026-01-23 | Closing price | 11.649999618530273 |
| 2026-01-26 | Closing price | 11.479999542236328 |
| 2026-01-27 | Closing price | 11.569999694824219 |
| 2026-01-28 | Closing price | 11.869999885559082 |
| 2026-01-29 | Closing price | 11.489999771118164 |
| 2026-01-30 | Closing price | 9.779999732971191 |
| 2026-02-02 | Closing price | 9.800000190734863 |
| 2026-02-03 | Closing price | 10.260000228881836 |
| 2026-02-04 | Closing price | 10.569999694824219 |
| 2026-02-05 | Closing price | 9.75 |
| 2026-02-06 | Closing price | 10.380000114440918 |
| 2026-02-09 | Closing price | 11.020000457763672 |
| 2026-02-10 | Closing price | 11.09000015258789 |
| 2026-02-11 | Closing price | 11.40999984741211 |
| 2026-02-12 | Closing price | 10.390000343322754 |
| 2026-02-13 | Closing price | 11.050000190734863 |
| 2026-02-17 | Closing price | 10.350000381469727 |
| 2026-02-18 | Closing price | 10.4399995803833 |
| 2026-02-19 | Closing price | 10.899999618530273 |
| 2026-02-20 | Closing price | 12.270000457763672 |
| 2026-02-23 | Closing price | 13.34000015258789 |
| 2026-02-24 | Closing price | 13.579999923706055 |
| 2026-02-25 | Closing price | 13.220000267028809 |
| 2026-02-26 | Closing price | 13.619999885559082 |
| 2026-02-27 | Closing price | 13.65999984741211 |
| 2026-03-02 | Closing price | 13.5600004196167 |
| 2026-03-03 | Closing price | 12.260000228881836 |
| 2026-03-04 | Closing price | 12.380000114440918 |
| 2026-03-05 | Closing price | 11.739999771118164 |
| 2026-03-06 | Closing price | 11.520000457763672 |
| 2026-03-09 | Closing price | 11.630000114440918 |
| 2026-03-10 | Closing price | 11.739999771118164 |
| 2026-03-11 | Closing price | 11.34000015258789 |
| 2026-03-12 | Closing price | 11.039999961853027 |
| 2026-03-13 | Closing price | 10.289999961853027 |
| 2026-03-16 | Closing price | 10.300000190734863 |
| 2026-03-17 | Closing price | 10.300000190734863 |
| 2026-03-18 | Closing price | 9.640000343322754 |
| 2026-03-19 | Closing price | 9.0 |
| 2026-03-20 | Closing price | 8.569999694824219 |
| 2026-03-23 | Closing price | 9.079999923706055 |
| 2026-03-24 | Closing price | 9.210000038146973 |
| 2026-03-25 | Closing price | 9.520000457763672 |
| 2026-03-26 | Closing price | 9.149999618530273 |
| 2026-03-27 | Closing price | 9.510000228881836 |
| 2026-03-30 | Closing price | 9.359999656677246 |
| 2026-03-31 | Closing price | 9.930000305175781 |
| 2026-04-01 | Closing price | 10.430000305175781 |
| 2026-04-02 | Closing price | 10.270000457763672 |
| 2026-04-06 | Closing price | 10.270000457763672 |
| 2026-04-07 | Closing price | 10.380000114440918 |
| 2026-04-08 | Closing price | 10.5600004196167 |
| 2026-04-09 | Closing price | 10.4399995803833 |
| 2026-04-10 | Closing price | 10.479999542236328 |
| 2026-04-13 | Closing price | 10.4399995803833 |
| 2026-04-14 | Closing price | 10.75 |
| 2026-04-15 | Closing price | 10.4399995803833 |
| 2026-04-16 | Closing price | 10.430000305175781 |
| 2026-04-17 | Closing price | 10.859999656677246 |
| 2026-04-20 | Closing price | 10.649999618530273 |
| 2026-04-21 | Closing price | 10.079999923706055 |
| 2026-04-22 | Closing price | 10.350000381469727 |
| 2026-04-23 | Closing price | 10.119999885559082 |
| 2026-04-24 | Closing price | 10.270000457763672 |
| 2026-04-27 | Closing price | 10.069999694824219 |
| 2026-04-28 | Closing price | 9.600000381469727 |
| 2026-04-29 | Closing price | 9.329999923706055 |
| 2026-04-30 | Closing price | 9.649999618530273 |
| 2026-05-01 | Closing price | 9.479999542236328 |
| 2026-05-04 | Closing price | 9.220000267028809 |
| 2026-05-05 | Closing price | 9.239999771118164 |
| 2026-05-06 | Closing price | 9.84000015258789 |
| 2026-05-07 | Closing price | 10.460000038146973 |
| 2026-05-08 | Closing price | 10.760000228881836 |
| 2026-05-11 | Closing price | 10.880000114440918 |
| 2026-05-12 | Closing price | 10.819999694824219 |
| 2026-05-13 | Closing price | 10.6899995803833 |
| 2026-05-14 | Closing price | 10.329999923706055 |
| 2026-05-15 | Closing price | 9.550000190734863 |
| 2026-05-18 | Closing price | 9.489999771118164 |
| 2026-05-19 | Closing price | 9.130000114440918 |
| 2026-05-20 | Closing price | 9.430000305175781 |
| 2026-05-21 | Closing price | 9.420000076293945 |
| 2026-05-22 | Closing price | 9.350000381469727 |
| 2026-05-26 | Closing price | 9.779999732971191 |
| 2026-05-27 | Closing price | 9.520000457763672 |
| 2026-05-28 | Closing price | 9.8100004196167 |
| 2026-05-29 | Closing price | 10.0600004196167 |
| 2026-06-01 | Closing price | 9.880000114440918 |
| 2026-06-02 | Closing price | 9.819999694824219 |
| 2026-06-03 | Closing price | 9.420000076293945 |
| 2026-06-04 | Closing price | 9.449999809265137 |
| 2026-06-05 | Closing price | 8.6899995803833 |
| 2026-06-08 | Closing price | 8.770000457763672 |
| 2026-06-09 | Closing price | 8.59000015258789 |
| 2026-06-10 | Closing price | 8.09000015258789 |
| 2026-06-11 | Closing price | 8.609999656677246 |
| 2026-06-12 | Closing price | 8.930000305175781 |
| 2026-06-15 | Closing price | 9.449999809265137 |
| 2026-06-16 | Closing price | 9.6899995803833 |
| 2026-06-17 | Closing price | 9.430000305175781 |
| 2026-06-18 | Closing price | 9.260000228881836 |
| 2026-06-22 | Closing price | 9.050000190734863 |
| 2026-06-23 | Closing price | 8.600000381469727 |
| 2026-06-24 | Closing price | 8.329999923706055 |
| 2026-06-25 | Closing price | 8.40999984741211 |
| 2026-06-26 | Closing price | 8.510000228881836 |
| 2026-06-29 | Closing price | 8.369999885559082 |
| 2026-06-30 | Closing price | 8.449999809265137 |
| 2026-07-01 | Closing price | 8.350000381469727 |
| 2026-07-02 | Closing price | 8.720000267028809 |
| 2026-07-06 | Closing price | 8.680000305175781 |
| 2026-07-07 | Closing price | 8.420000076293945 |
| 2026-07-08 | Closing price | 8.130000114440918 |
| 2026-07-09 | Closing price | 8.569999694824219 |
| 2026-07-10 | Closing price | 8.520000457763672 |
| 2026-07-13 | Closing price | 8.369999885559082 |
| 2026-07-14 | Closing price | 8.510000228881836 |
| 2026-07-15 | Closing price | 8.479999542236328 |
| 2026-07-16 | Closing price | 8.229999542236328 |
| 2026-07-17 | Closing price | 8.15999984741211 |
| 2026-07-20 | Closing price | 8.029999732971191 |
| 2026-07-21 | Closing price | 8.470000267028809 |
| 2026-07-22 | Closing price | 8.609999656677246 |
| 2026-07-23 | Closing price | 8.420000076293945 |
| 2026-07-24 | Closing price | 8.550000190734863 |
| 2026-07-27 | Closing price | 8.5600004196167 |
| 2026-07-28 | Closing price | 8.420000076293945 |
| 2026-07-29 | Closing price | 8.369999885559082 |
| 2026-07-30 | Closing price | 8.770000457763672 |
| 2026-07-31 | Closing price | 8.430000305175781 |
| 2026-08-03 | Closing price | 8.670000076293945 |
| 2026-08-04 | Closing price | 9.050000190734863 |
| 2026-08-05 | Closing price | 9.600000381469727 |
| 2026-08-06 | Closing price | 9.5600004196167 |
| 2026-08-07 | Closing price | 10.390000343322754 |
| 2026-08-10 | Closing price | 10.729999542236328 |
| 2026-08-11 | Closing price | 10.829999923706055 |
| 2026-08-12 | Closing price | 10.84000015258789 |
| 2026-08-13 | Closing price | 10.489999771118164 |
| 2026-08-14 | Closing price | 10.670000076293945 |
| 2026-08-17 | Closing price | 10.770000457763672 |
| 2026-08-18 | Closing price | 10.449999809265137 |
| 2026-08-19 | Closing price | 11.630000114440918 |
| 2026-08-20 | Closing price | 11.899999618530273 |
| 2026-08-21 | Closing price | 12.069999694824219 |
| 2026-08-24 | Closing price | 12.1899995803833 |
| 2026-08-25 | Closing price | 12.449999809265137 |
| 2026-08-26 | Closing price | 12.40999984741211 |
| 2026-08-27 | Closing price | 12.8100004196167 |
| 2026-08-28 | Closing price | 12.260000228881836 |
| 2026-08-31 | Closing price | 12.079999923706055 |
| 2026-09-01 | Closing price | 11.75 |
| 2026-09-02 | Closing price | 12.260000228881836 |
| 2026-09-03 | Closing price | 12.65999984741211 |
| 2026-09-04 | Closing price | 12.3100004196167 |
| 2026-09-08 | Closing price | 12.15999984741211 |
| 2026-09-09 | Closing price | 12.329999923706055 |
| 2026-09-10 | Closing price | 12.050000190734863 |
| 2026-09-11 | Closing price | 11.989999771118164 |
| 2026-09-14 | Closing price | 11.630000114440918 |
| 2026-09-15 | Closing price | 11.640000343322754 |
| 2026-09-16 | Closing price | 11.489999771118164 |
| 2026-09-17 | Closing price | 11.920000076293945 |
| 2026-09-18 | Closing price | 11.949999809265137 |
| 2026-09-21 | Closing price | 11.760000228881836 |
| 2026-09-22 | Closing price | 12.210000038146973 |
| 2026-09-23 | Closing price | 11.65999984741211 |
| 2026-09-24 | Closing price | 11.5 |
| 2026-09-25 | Closing price | 11.6899995803833 |
| 2026-09-28 | Closing price | 11.210000038146973 |
| 2026-09-29 | Closing price | 11.350000381469727 |
| 2026-09-30 | Closing price | 11.239999771118164 |
| 2026-10-01 | Closing price | 11.170000076293945 |
| 2026-10-02 | Closing price | 11.25 |
| 2026-10-05 | Closing price | 11.140000343322754 |
| 2026-10-06 | Closing price | 11.180000305175781 |
| 2026-10-07 | Closing price | 10.119999885559082 |
| 2026-10-08 | Closing price | 10.609999656677246 |
| 2026-10-09 | Closing price | 10.920000076293945 |
| 2026-10-12 | Closing price | 10.760000228881836 |
| 2026-10-13 | Closing price | 10.579999923706055 |
| 2026-10-14 | Closing price | 10.170000076293945 |
| 2026-10-15 | Closing price | 10.539999961853027 |
| 2026-10-16 | Closing price | 10.710000038146973 |
| 2026-10-19 | Closing price | 10.59000015258789 |
| 2026-10-20 | Closing price | 10.390000343322754 |
| 2026-10-21 | Closing price | 10.34000015258789 |
| 2026-10-22 | Closing price | 9.520000457763672 |
| 2026-10-23 | Closing price | 9.180000305175781 |
| 2026-10-26 | Closing price | 9.300000190734863 |
| 2026-10-27 | Closing price | 9.5600004196167 |
| 2026-10-28 | Closing price | 9.649999618530273 |
| 2026-10-29 | Closing price | 9.369999885559082 |
| 2026-10-30 | Closing price | 8.880000114440918 |
| 2026-11-02 | Closing price | 9.100000381469727 |
| 2026-11-03 | Closing price | 8.84000015258789 |
| 2026-11-04 | Closing price | 9.59000015258789 |
| 2026-11-05 | Closing price | 9.479999542236328 |
| 2026-11-06 | Closing price | 9.619999885559082 |
| 2026-11-09 | Closing price | 10.069999694824219 |
| 2026-11-10 | Closing price | 9.53499984741211 |
On the portal's model, annual EBITDA at today's prices is $533m against $767m over the last twelve months, and EV/EBITDA is 4.9
The last twelve months delivered $824.2m of EBITDA, but that money was earned at past, higher prices. On the portal's spot model, annual EBITDA at today's prices is $533m – 30.5% less. EV/EBITDA on that base is 4.9, and net debt to EBITDA is minus 0.55.
Market capitalisation is $2,915.4m, P/E over the last twelve months 9.6, EV/EBITDA 3.4, return on equity 10.7%. On the portal's model the share stands 71% below fair value calculated from current metal prices.
That figure decides the verdict: at EV/EBITDA 4.9 on current EBITDA the market already prices in a further fall, but the model says the cushion is negative. A reversal is possible only if silver recovers above $62.8.
Valuation on the latest reported figures
| Metric | Value |
|---|---|
| Market cap | 2.92 bn USD |
| P/E (LTM) | 9.6 |
| EV/EBITDA (LTM) | 3.4 |
| P/B | 2.08 |
| Net debt / EBITDA (LTM) | -0.36 |
| Operating cash flow (LTM) | 0.82 bn |
| ROE | 10.7% |
Net profit by quarter
| Period | Measure | bn USD |
|---|---|---|
| Q4 2024 | Net profit | 0.011345000000000027 |
| Q1 2025 | Net profit | 0.058503 |
| Q2 2025 | Net profit | 0.037314 |
| Q3 2025 | Net profit | 0.123589 |
| Q4 2025 | Net profit | 0.068062 |
| Q1 2026 | Net profit | 0.111008 |
| Q2 2026 | Net profit | 0.075504 |
| Q3 2026 | Net profit | 0.047826 |
Bottom line
The balance sheet remains the strong point: net cash of $295.1m and $61.7m of free cash flow for the quarter. But with silver up 57.6% year on year, EBITDA grew only 17.4%, and our calculation puts the shortfall to the price-implied benchmark at $82.0m – not a one-off but a recurring pattern. Net profit fell 61.3% on an inflated year-ago base, which is not a deterioration of the mine but no reason for growth either. On the portal's model the share stands 71% below fair value, and that gap outweighs the healthy balance sheet. Our conclusion: rather unattractive – minus 71% on the portal's model. Our view: the share is rather unattractive at the current price; upside on the portal model -71%.