Gerdau: EBITDA up 41.4%, but the multiple is already above its own history
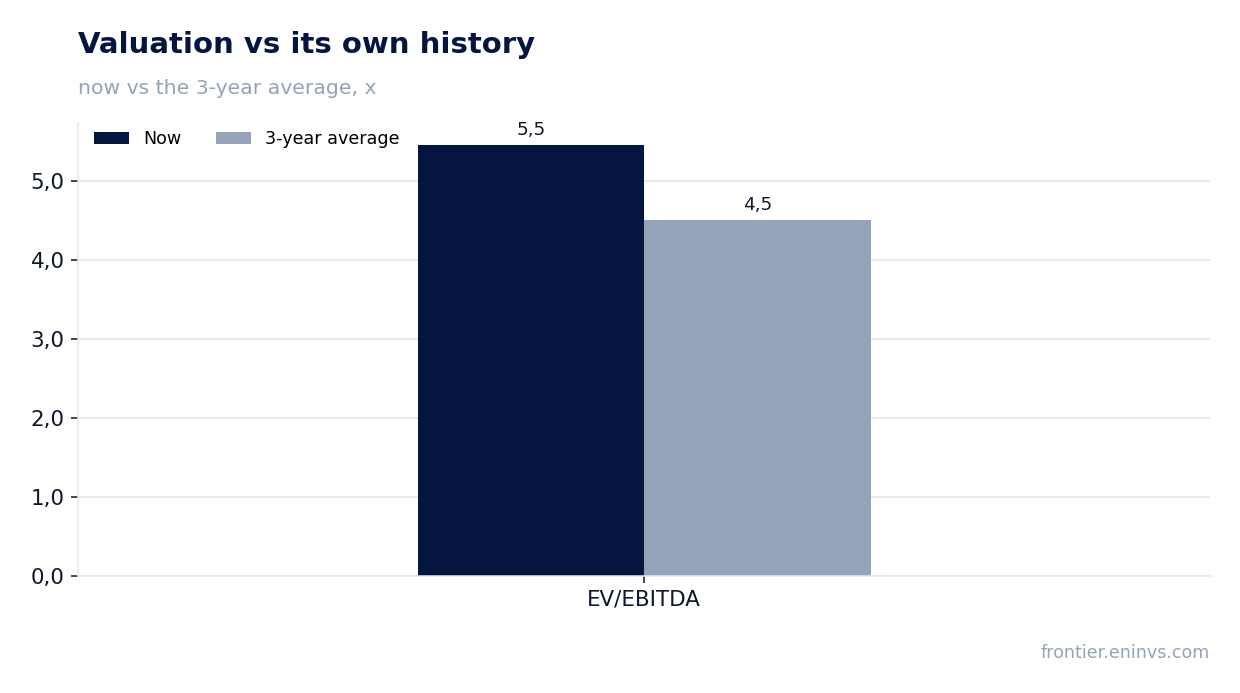
Gerdau reported third-quarter 2026 revenue of USD 3,629.6 mn, EBITDA of USD 681.9 mn and net profit of USD 301.8 mn. Year on year revenue rose 8.6%, EBITDA 41.4% and net profit 49.0%, while the EBITDA margin climbed to 18.8% from 14.4%. Yet EV/EBITDA over the last twelve months stands at 5.5x, 21% above its own three-year average of 4.5x, so at the current price the share looks neutral: operating growth and low leverage are already largely priced in.
Key takeaways
— Revenue rose 8.6% year on year, but growth decelerated from 12.0% a quarter earlier
— EBITDA rose 41.4% on an 18.8% margin versus 14.4% a year earlier
— Net profit rose 49.0%, lifting the net margin to 8.3% from 6.1%
— Leverage at 0.82x EBITDA remains low, and net debt barely changed over the year
— Free cash flow after capex covers the 2.2% dividend yield
— EV/EBITDA at 5.5x is 21% above its own three-year average of 4.5x
Attractiveness
Key figures, USD bn
| Metric | Q3 2025 | Q3 2026 | Change |
|---|---|---|---|
| Revenue | 3.34 | 3.63 | +8.6% |
| EBITDA | 0.48 | 0.68 | +41.4% |
| Operating profit | 0.31 | 0.52 | +70.1% |
| Net profit | 0.20 | 0.30 | +49.0% |
| Operating cash flow | 0.54 | 0.52 | -3.6% |
| Capex | 0.33 | — | — |
| EBITDA margin | 14.4% | 18.8% | +4.4 pp |
| Net margin | 6.1% | 8.3% | +2.2 pp |
Revenue rose 8.6% year on year, but growth decelerated from 12.0% a quarter earlier
In the third quarter of 2026 Gerdau's revenue reached USD 3,629.6 mn, 8.6% above the same quarter a year earlier. Growth continued but decelerated: in the second quarter the year-on-year rate was 12.0%. The slowdown comes off a high base – the year-earlier quarter was already growing 10.8%.
The quarterly sequence is uneven: 6.2% in Q2 2025, 10.8% in Q3, 13.8% in Q4, 7.8% in Q1 2026, 12.0% in Q2 and 8.6% in Q3. That pattern points to demand sensitive to the external environment rather than a smooth trend.
What matters more than the rate itself is that revenue has held above USD 3.5 bn for three consecutive quarters. That supports capacity utilisation and price pass-through into margin, which is visible in the profit line.
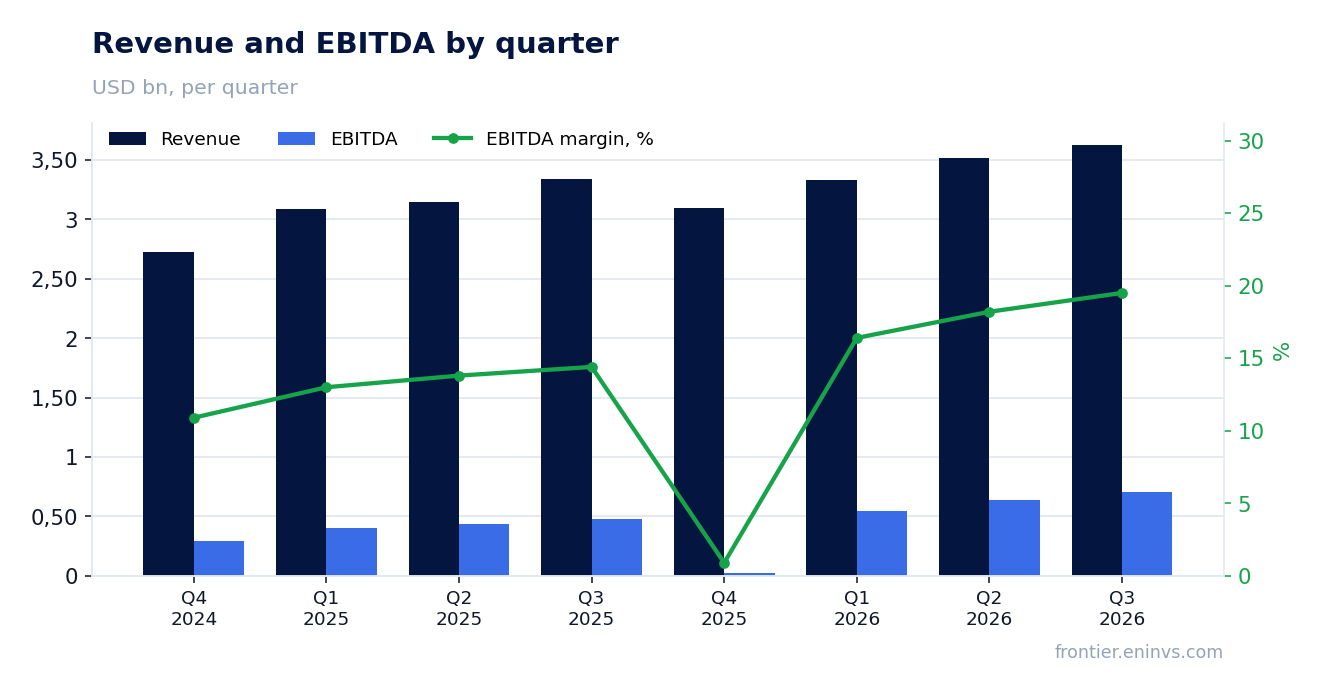
EBITDA rose 41.4% on an 18.8% margin versus 14.4% a year earlier
EBITDA for the third quarter of 2026 was USD 681.9 mn, 41.4% above the year-earlier level. The EBITDA margin rose to 18.8% from 14.4%, so profit growth outpaces revenue growth almost fivefold.
Operating profit was USD 524.1 mn. The USD 157.8 mn gap between EBITDA and operating profit is depreciation, which does not scale with revenue. That is why the margin expands faster than pricing alone would allow.
The durability of that margin is the main question for the report. If the expansion came from product prices, it can reverse with the market. If it came from utilisation and cost structure, it will hold longer. The report does not break this out, so the next quarter will show whether 18.8% is a new benchmark or a peak.
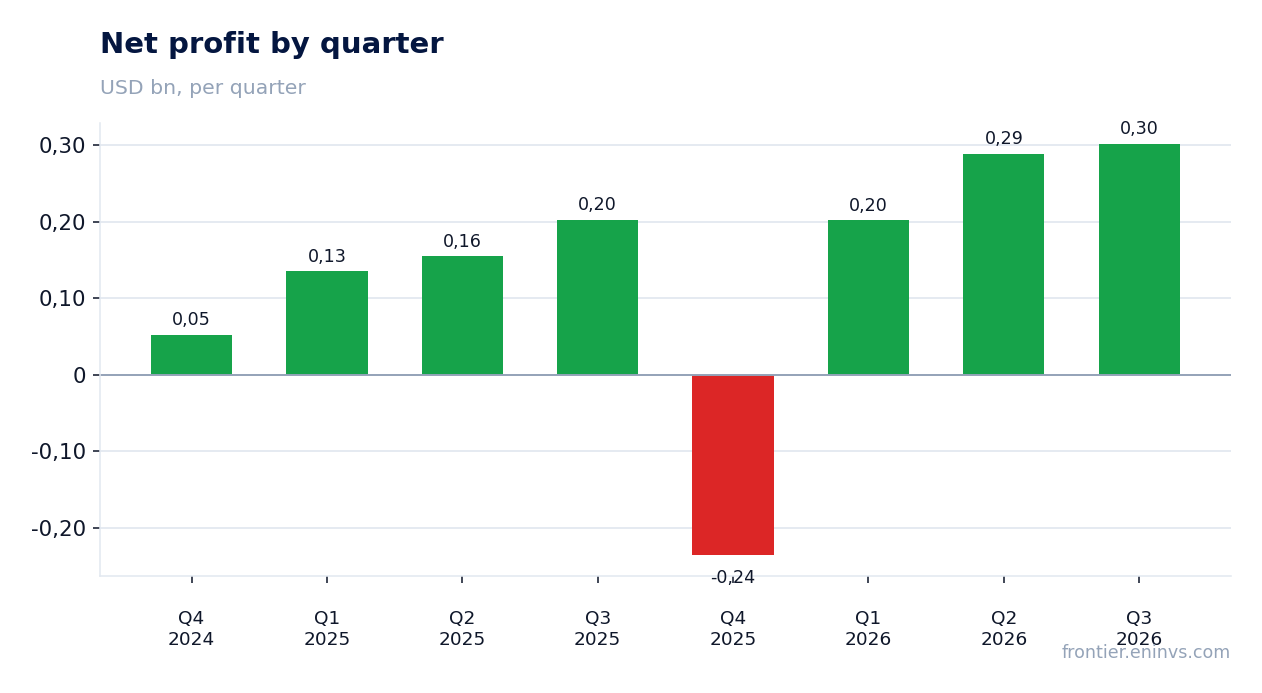
Net profit rose 49.0%, lifting the net margin to 8.3% from 6.1%
Net profit for the third quarter of 2026 was USD 301.8 mn, 49.0% above the year-earlier figure. The net margin rose to 8.3% from 6.1%.
Profit growing faster than EBITDA reflects financial costs and taxes not scaling proportionally with the operating result. With net profit of USD 301.8 mn and EBITDA of USD 681.9 mn, interest, taxes and other items account for USD 380.1 mn – less than half of EBITDA.
Over the last twelve months net profit was USD 354.3 mn on revenue of USD 13,600.0 mn. The quarterly result of USD 301.8 mn is the bulk of the annual profit, underlining how important the third quarter was for the full-year outcome.
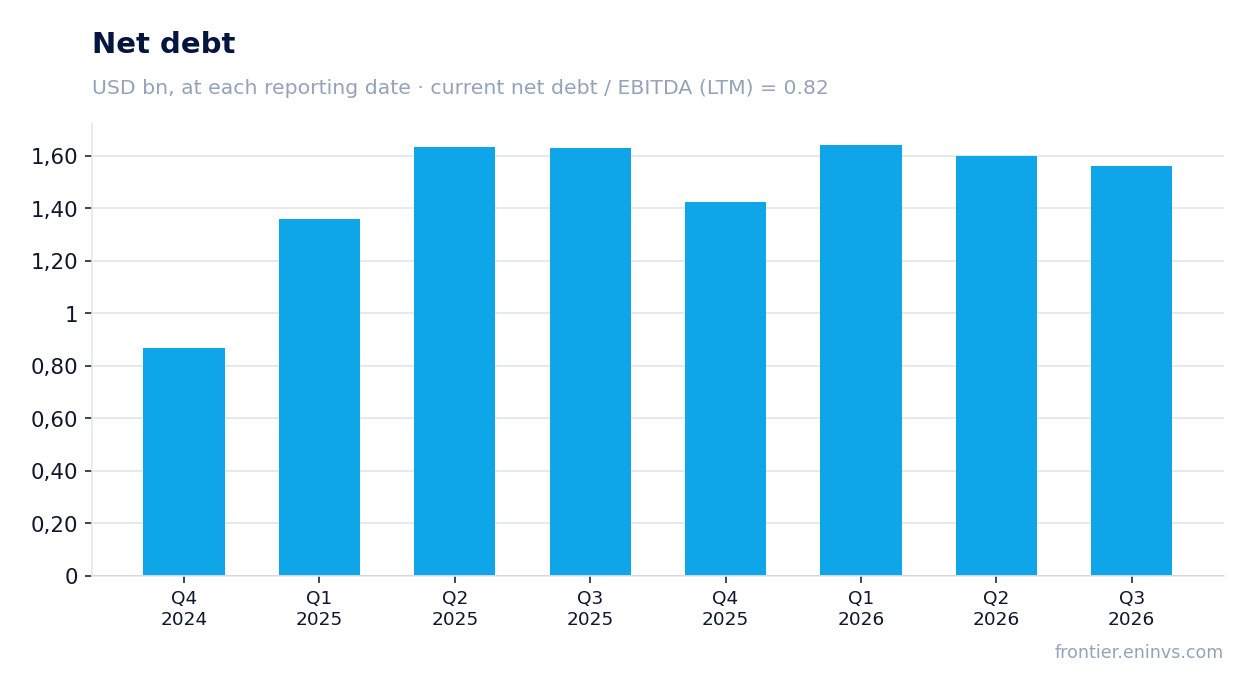
Leverage at 0.82x EBITDA remains low, and net debt barely changed over the year
Net debt at 30 September 2026 was USD 1,560.0 mn. The ratio of net debt to EBITDA over the last twelve months is 0.82, a comfortable level for a steel producer with cyclical demand.
Net debt barely moved over the quarter: from USD 1,598.6 mn at 30 June 2026 to USD 1,560.0 mn at 30 September, a reduction of USD 38.5 mn. Over twelve months it went from USD 1,629.6 mn at 30 September 2025 to USD 1,560.0 mn, a reduction of USD 69.6 mn. Debt is being serviced but not rapidly reduced.
Operating cash flow for the third quarter was USD 523.7 mn, comparable to EBITDA. Working capital is not consuming profit, leaving room for investment and shareholder returns.
Free cash flow after capex covers the 2.2% dividend yield
Operating cash flow for the third quarter of 2026 was USD 523.7 mn. Capex for the quarter is not disclosed in the facts, but recent quarters have ranged from USD 217 mn to USD 333 mn: USD 217.1 mn in Q2 2026 and USD 240.2 mn in Q1.
On that range, free cash flow for the quarter stays positive and runs into the hundreds of millions of dollars. That is enough to fund dividends without adding debt.
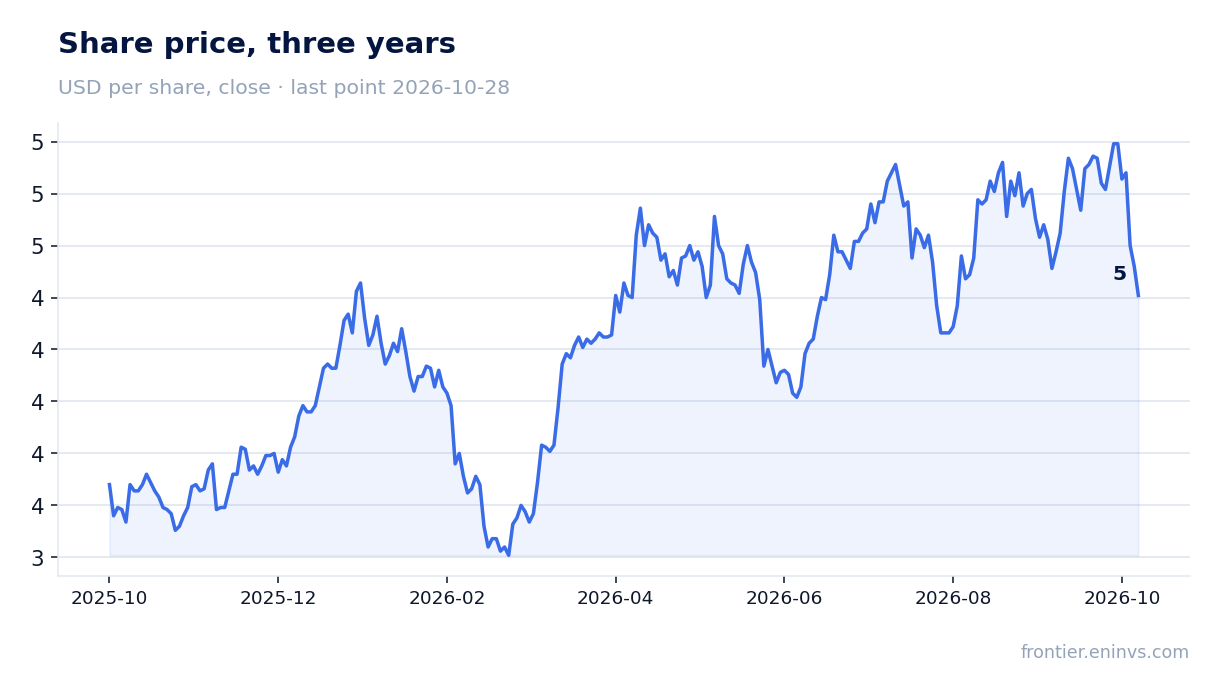
The trailing twelve-month dividend yield is 2.2%. Against a market capitalisation of USD 8,907.9 mn, payouts are about USD 197 mn. That is modest relative to quarterly cash flow, but the yield is also low relative to the risk-free rate.
The dividend policy is not in the facts, so the sustainability of the payout depends on cash flow holding at current levels. If EBITDA halves, free cash flow after capex could fall to zero and the payout would come under question.
EV/EBITDA at 5.5x is 21% above its own three-year average of 4.5x
EV/EBITDA over the last twelve months is 5.5x against its own three-year average of 4.5x. The share trades 21% above its usual level relative to its own history. That is the main argument against buying at the current level.
P/E over the last twelve months is 25.1x. With net profit of USD 354.3 mn and a market capitalisation of USD 8,907.9 mn, that reflects profit that was strong in the third quarter but modest for the year overall. The market is paying for the quarterly result, not the annual one.
Return on equity is 11.4%. That is decent for a steel company but not the level that justifies a premium to its own history. For the multiple to return to its average, either EBITDA must grow or the price must fall.
Valuation on the latest reported figures
| Metric | Value |
|---|---|
| Market cap | 8.91 bn USD |
| P/E (LTM) | 25.1 |
| EV/EBITDA (LTM) | 5.5 |
| P/B | 0.91 |
| Net debt / EBITDA (LTM) | 0.82 |
| Operating cash flow (LTM) | 1.70 bn |
| ROE | 11.4% |
| Dividend yield (12m) | 2.2% |
| EV/EBITDA, 3-year average | 4.5 |
Bottom line
The quarter was strong: EBITDA rose 41.4%, the margin climbed to 18.8% and net profit rose 49.0%. Leverage at 0.82x EBITDA and operating cash flow of USD 523.7 mn confirm that growth converts into cash. But revenue growth decelerated from 12.0% to 8.6%, and EV/EBITDA at 5.5x is already 21% above its own three-year average. At the current price the share looks neutral: the operating achievements are real, but the valuation leaves little cushion if the margin reverses.
Open the company's financial profile GGB →
See also: market overview · valuation map · stock screeners