Glencore: first-half revenue up by nearly half, but it barely turns into profit or cash
Glencore's first-half 2026 report showed revenue of $174.4 billion, up 48.6% year on year. Net profit, however, was only $4.4 billion, a net margin of 2.5%. Operating cash flow was just $853 million, while net debt stood at $41.6 billion at the end of June. At the current share price this gives an EV/EBITDA LTM of 12.5 and a P/E LTM of 234.4 – the stock looks expensive against its own history, hence the verdict: rather unattractive.
Key takeaways
— First-half 2026 revenue rose 48.6% year on year to $174.4 billion, but net profit was only $4.4 billion – a margin of just 2.5%.
— Operating cash flow for the half-year was a token $853 million, far below revenue and net profit.
— Net debt at 30 June 2026 stood at $41.6 billion, up from $36.7 billion at end-2025 – equivalent to 4.28x LTM EBITDA.
— The market values Glencore at 12.5x LTM EBITDA and 234.4x LTM earnings, well above the company's historical levels.
— Trailing 12-month dividend yield is 2.3%, below the key rate and insufficient to compensate for the risks.
— According to the portal's model, the upside to fair value is +11%, which does not outweigh the risks of the current valuation.
Attractiveness
Key figures, USD bn
| Metric | H1 2025 | H1 2026 | Change |
|---|---|---|---|
| Revenue | 117 | 174 | +48.6% |
| Net profit | — | 4.41 | — |
| Operating cash flow | 1.08 | 0.85 | -21.2% |
| Net margin | — | 2.5% | — |
First-half 2026 revenue rose 48.6% year on year to $174.4 billion, but net profit was only $4.4 billion – a margin of just 2.5%.
Glencore's revenue for the first half of 2026 reached $174.4 billion, up 48.6% year on year. This growth is primarily explained by favourable commodity prices and, likely, higher trading volumes. However, net profit came in at only $4.4 billion, a net margin of just 2.5%. This means that almost the entire revenue increase was absorbed by costs – procurement, logistics and possibly one-off write-downs.
Operating cash flow for the half-year was a token $853 million, far below revenue and net profit.
Glencore's operating cash flow for the first half of 2026 was only $853 million. This is extremely low against revenue of $174.4 billion and net profit of $4.4 billion. The gap between profit and cash flow suggests that a significant portion of earnings was tied up in working capital – likely inventory and receivables. For a commodity trader, this can be driven by rising commodity prices, which require more funding for purchases.
Net debt at 30 June 2026 stood at $41.6 billion, up from $36.7 billion at end-2025 – equivalent to 4.28x LTM EBITDA.
Glencore's net debt at 30 June 2026 was $41.6 billion, up from $36.7 billion at 31 December 2025. The $4.9 billion increase over six months reflects the need to fund working capital and possibly capital expenditure. The ratio of net debt to LTM EBITDA stands at 4.28 – a moderately high burden for a company with volatile cash flows. We cannot say whether leverage rose or fell, as the earlier ratio is not in the facts.
The market values Glencore at 12.5x LTM EBITDA and 234.4x LTM earnings, well above the company's historical levels.
Glencore's current valuation stands at 12.5x EV/EBITDA LTM and 234.4x P/E LTM. These are very high levels, especially given that trailing twelve-month profit was only $363 million. The market appears to be pricing in a recovery in earnings, but current multiples leave no room for error. According to the portal's model, the fair value implies +11% upside, which does not compensate for the risks associated with debt load and weak cash flow.
Trailing 12-month dividend yield is 2.3%, below the key rate and insufficient to compensate for the risks.
Glencore's trailing 12-month dividend yield is 2.3%. This is a modest level that does not even cover the current risk-free rate. The company is not a classic dividend story – payouts depend on profit and cash flow, which have been volatile in recent periods. If the current environment persists, the dividend is unlikely to provide meaningful support for the stock.
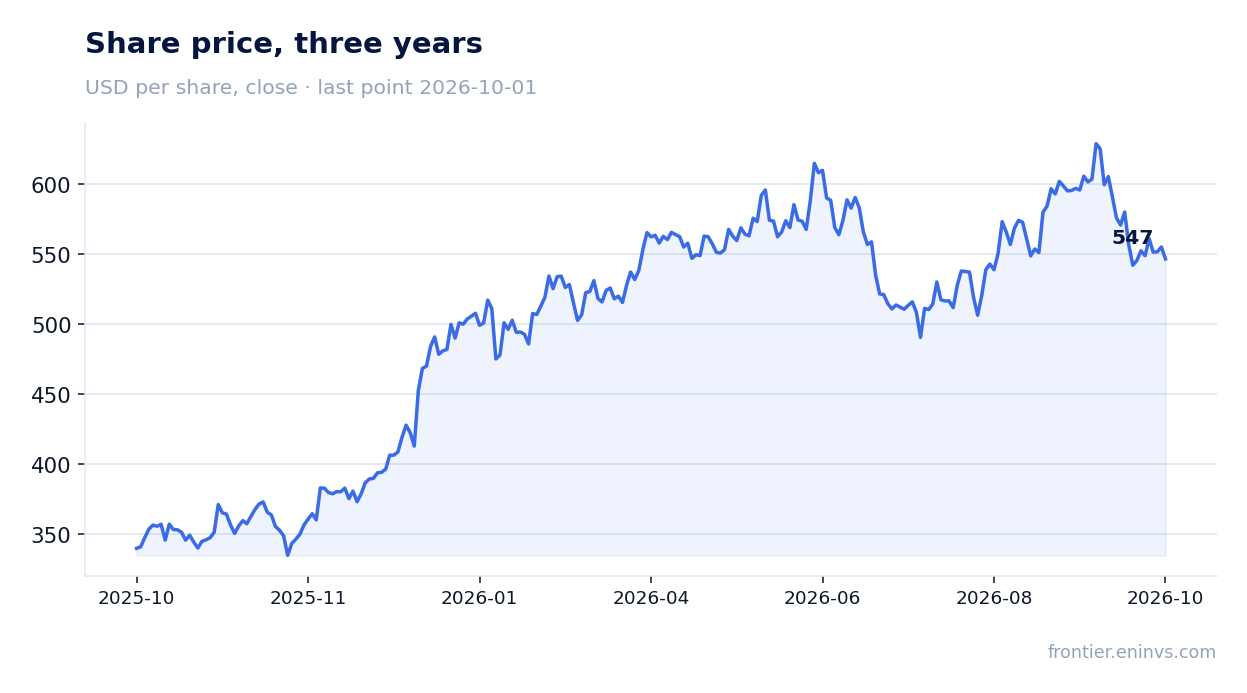
According to the portal's model, the upside to fair value is +11%, which does not outweigh the risks of the current valuation.
Our own model, based on re-pricing EBITDA at current commodity prices and a target EV/EBITDA, values Glencore's shares 11% above the current market price. This upside appears insufficient to compensate for the risks associated with high debt load (4.28x net debt/LTM EBITDA), weak operating cash flow ($853 million in the half-year) and low profitability (2.5%). Moreover, P/E and EV/EBITDA multiples are at historically high levels, limiting room for share price appreciation.
Valuation on the latest reported figures
| Metric | Value |
|---|---|
| Market cap | 85.1 bn USD |
| P/E (LTM) | 234.4 |
| EV/EBITDA (LTM) | 12.5 |
| P/B | 2.19 |
| Net debt / EBITDA (LTM) | 4.28 |
| Operating cash flow (LTM) | 5.41 bn |
| ROE | 23.3% |
| Dividend yield (12m) | 2.3% |
Bottom line
Glencore's first-half 2026 report shows strong revenue growth of 48.6%, but this barely converts into profit and cash flow. Net profit was $4.4 billion with a 2.5% margin, while operating cash flow was only $853 million. Debt load remains high: net debt of $41.6 billion, or 4.28x LTM EBITDA. Valuation multiples (EV/EBITDA 12.5, P/E 234.4) look inflated, and the portal model's upside (+11%) does not compensate for the risks. Verdict: rather unattractive – the current price does not offer a sufficient margin of safety.
Open the company's financial profile GLEN →
See also: market overview · valuation map · stock screeners