Genco Shipping & Trading: revenue up 90%, but leverage at 1.69x EBITDA absorbs the upside
On 4 November Genco Shipping & Trading reported third-quarter 2026 results. Revenue rose 90.0% year on year to USD 151.9m, EBITDA by 210.6% to USD 67.6m, and net profit reached USD 38.0m against a loss a year earlier. Growth accelerated from +68.5% in the second quarter, but net debt at 30 September stood at USD 281.3m, or 1.69x trailing-twelve-month EBITDA, and the portal's model puts the share 35% below its current price – so the stock looks rather unattractive.
Key takeaways
— Revenue added 90.0% year on year, accelerating from +68.5% in the second quarter
— EBITDA rose 210.6% and the margin climbed to 44.5% from 27.2% a year earlier
— Net profit of USD 38.0m came on operating cash flow of USD 66.5m and capex of just USD 1.1m
— Net debt stayed at USD 0.3bn between 30 June and 30 September, up from USD 0.1bn a year earlier
— Trailing-twelve-month dividend yield is 7.3%, and the payout rests on quarterly profit
— At P/E 13.5 and EV/EBITDA 7.3 the stock is priced above its own history, and the portal's model implies -35%
Attractiveness
Key figures, USD bn
| Metric | Q3 2025 | Q3 2026 | Change |
|---|---|---|---|
| Revenue | 0.08 | 0.15 | +90.0% |
| EBITDA | 0.02 | 0.07 | +210.6% |
| Operating profit | 0.00 | 0.04 | +1693.7% |
| Net profit | -0.00 | 0.04 | to profit |
| Operating cash flow | 0.01 | 0.07 | +764.7% |
| Capex | 0.00 | 0.00 | -12.2% |
| EBITDA margin | 27.2% | 44.5% | +17.3 pp |
| Net margin | -1.3% | 25.0% | +26.3 pp |
Revenue added 90.0% year on year, accelerating from +68.5% in the second quarter
Third-quarter 2026 revenue came in at USD 151.9m, 90.0% above the same quarter a year earlier. In the second quarter growth was slower at +68.5%, so the acceleration is clear: quarterly revenue added USD 15.4m sequentially.
A year earlier revenue was falling: in the third quarter of 2025 it declined 19.5%. The current growth is a recovery from a weak base rather than an extension of a long trend. Over the trailing twelve months revenue was USD 512.6m, and the third quarter alone contributed almost a third of that.
The facts do not disclose what drove the revenue. All that is clear is that growth has accelerated for three quarters in a row: +60.6% in the first, +68.5% in the second and +90.0% in the third. The key question for the next report is whether that pace holds once the comparison base stops being so low.
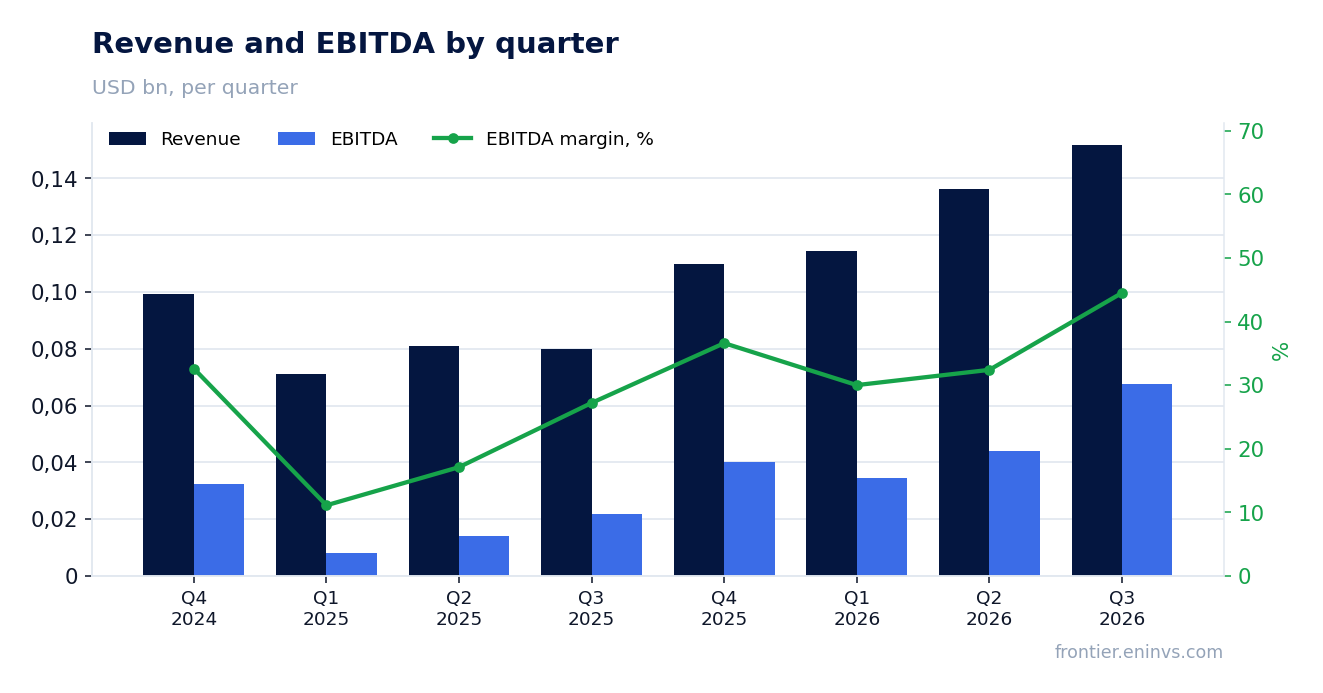
EBITDA rose 210.6% and the margin climbed to 44.5% from 27.2% a year earlier
Third-quarter 2026 EBITDA came to USD 67.6m, 210.6% more than a year earlier. The EBITDA margin rose to 44.5% from 27.2% in the third quarter of 2025 – revenue is outpacing costs.
Operating profit reached USD 44.3m, against just USD 2.5m a year earlier. The gap between EBITDA and operating profit – about USD 23.4m – is depreciation, which does not move with revenue.
Net profit was USD 38.0m, and the net margin 25.0% against -1.3% a year earlier. The swing is explained not by one-off items but by operating leverage: with revenue up 90.0%, costs rose far less. Over the trailing twelve months EBITDA was USD 166.9m.
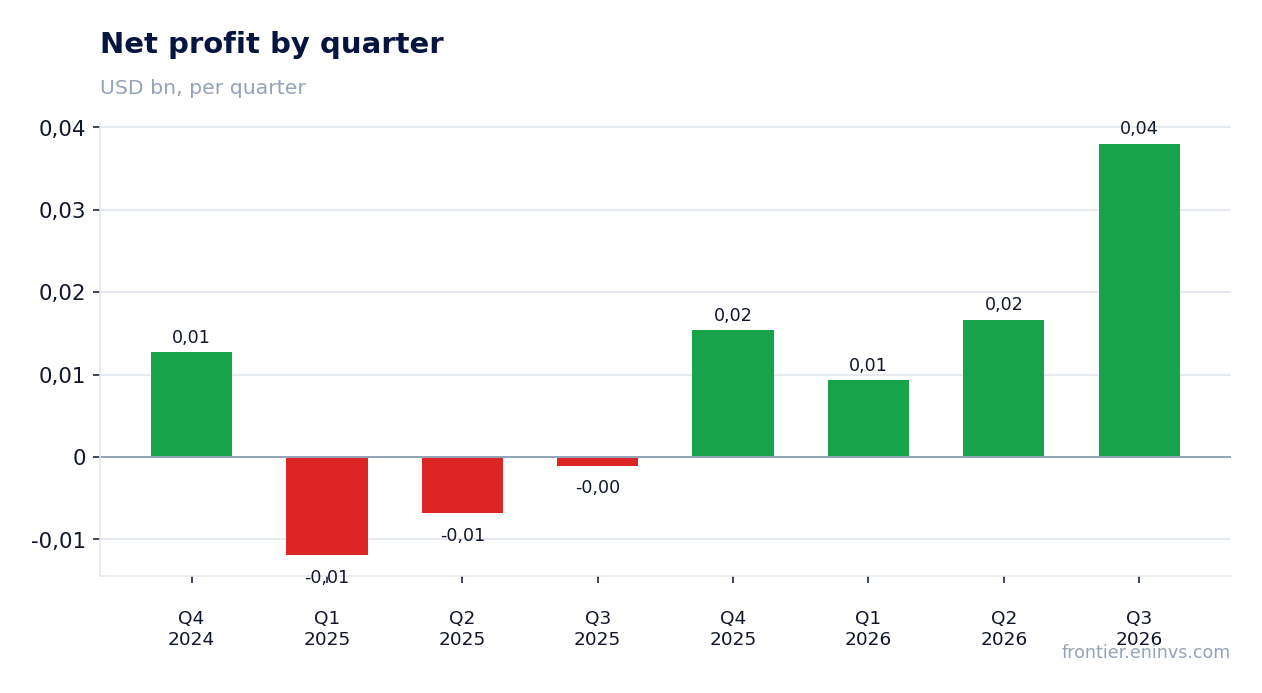
Net profit of USD 38.0m came on operating cash flow of USD 66.5m and capex of just USD 1.1m
Third-quarter 2026 operating cash flow was USD 66.5m, well above net profit of USD 38.0m. The gap is mostly depreciation, which reduces profit but not cash.
Capital expenditure was minimal at USD 1.1m. Free cash flow is therefore close to operating cash flow: almost all the cash earned in the quarter stays in the company. A year earlier the picture was different: in the fourth quarter of 2025 capex reached USD 73.8m.
Over the trailing twelve months operating cash flow was USD 131.3m. With a quarterly flow of USD 66.5m, the third quarter alone produced half the annual figure – further evidence of how strong this particular period was.
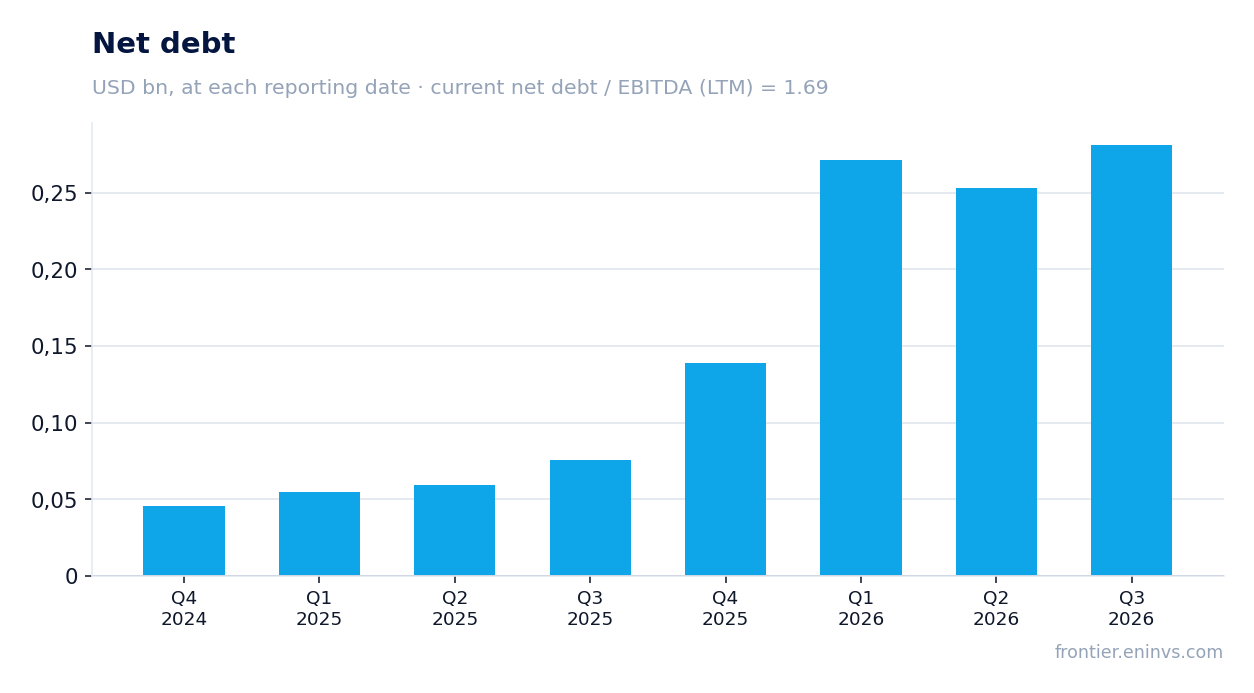
Net debt stayed at USD 0.3bn between 30 June and 30 September, up from USD 0.1bn a year earlier
Net debt at 30 September 2026 was USD 281.3m, or USD 0.3bn. It was unchanged from 30 June – USD 0.3bn on both dates. Over the year it rose: from USD 0.1bn at 30 September 2025 to USD 0.3bn at 30 September 2026, a change of USD 0.2bn.
The ratio of net debt to trailing-twelve-month EBITDA is 1.69x. That is a moderate level for a capital-intensive carrier, but it is well above a year ago, when debt was three times smaller. Quarterly profit partly offset the rise in debt but did not eliminate it.
Interest and the repayment schedule are not disclosed in the facts. All that is known is that with trailing-twelve-month EBITDA of USD 166.9m, debt of USD 281.3m is covered in under two years. That is not critical, but it leaves little room for large investment without new financing.
Trailing-twelve-month dividend yield is 7.3%, and the payout rests on quarterly profit
The trailing-twelve-month dividend yield is 7.3%. The company pays dividends, and with quarterly net profit of USD 38.0m the payout looks covered: trailing-twelve-month profit is USD 79.4m.
Our estimate for the current year's dividend is about 7% on the current price, and it rests on two things: the payout ratio and the profit base. If third-quarter profit is not repeated in the fourth, the payout could be smaller. Capex of USD 1.1m for the quarter does not stand in the way, but the USD 0.2bn rise in net debt over the year limits freedom.
A yield of 7.3% is above what we would consider fair for a carrier with debt at 1.69x EBITDA, but not enough to offset the portal model's valuation. For a holder the dividend is the main argument for the stock, and it is vulnerable to a fall in profit.
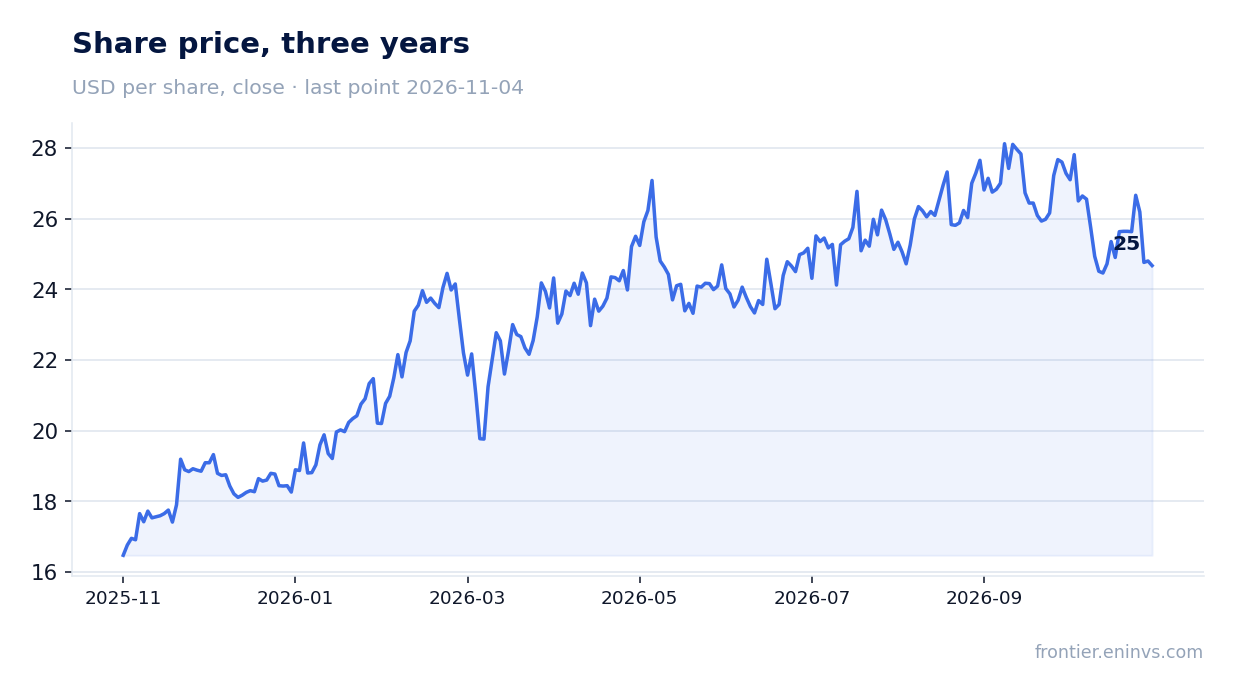
At P/E 13.5 and EV/EBITDA 7.3 the stock is priced above its own history, and the portal's model implies -35%
Trailing-twelve-month P/E is 13.5, EV/EBITDA 7.3. Both multiples are above their three-year averages, meaning the market has already priced in the strong quarter. Market capitalisation is USD 1.08bn, and EV/EBITDA of 7.3 on EBITDA of USD 166.9m implies an enterprise value of about USD 1.22bn.
On the portal's model, which reprices EBITDA at current commodity prices at the target EV/EBITDA, the share is valued 35% below its current price. This is our own estimate, not a market consensus. It rests on current EBITDA being above a sustainable level and the multiple already stretched.
The price reaction was muted: the share lost 0.5% on the release day and another 0.5% from then to 4 November. The market saw nothing in the report to justify a re-rating. Two triggers matter for the next report: holding the margin above 40% and reducing debt.
Valuation on the latest reported figures
| Metric | Value |
|---|---|
| Market cap | 1.08 bn USD |
| P/E (LTM) | 13.5 |
| EV/EBITDA (LTM) | 7.3 |
| P/B | 1.20 |
| Net debt / EBITDA (LTM) | 1.69 |
| Operating cash flow (LTM) | 0.13 bn |
| ROE | 17.1% |
| Dividend yield (12m) | 7.3% |
Bottom line
What was strong in the report was all operating: revenue +90.0%, EBITDA +210.6%, margin 44.5%, operating cash flow of USD 66.5m on capex of USD 1.1m. But growth accelerated from a low base, and net debt rose from USD 0.1bn to USD 0.3bn over the year. The 7.3% dividend supports the stock, yet P/E 13.5 and EV/EBITDA 7.3 are above its own history, and the portal model implies -35%. The verdict is rather unattractive: the quarter was strong, but the price already reflects it.
Open the company's financial profile GNK →
See also: market overview · valuation map · stock screeners