Gulfport Energy: quarterly profit fell 13.5% while net debt rose by $0.4bn over the year
On 4 November Gulfport Energy reported third-quarter 2026 results. Net profit came in at $96.4m, down 13.5% year on year; operating cash flow reached $183.6m, capital expenditure $111.7m, and net debt at the end of September rose to $1.07bn. At the same time the trailing-twelve-month EV/EBITDA multiple of 4.4 sits below its own three-year average of 5.3, and the portal's model puts the upside at 20% – at the current price the share looks rather attractive, though rising debt and the absence of quarterly revenue data temper the call.
Key takeaways
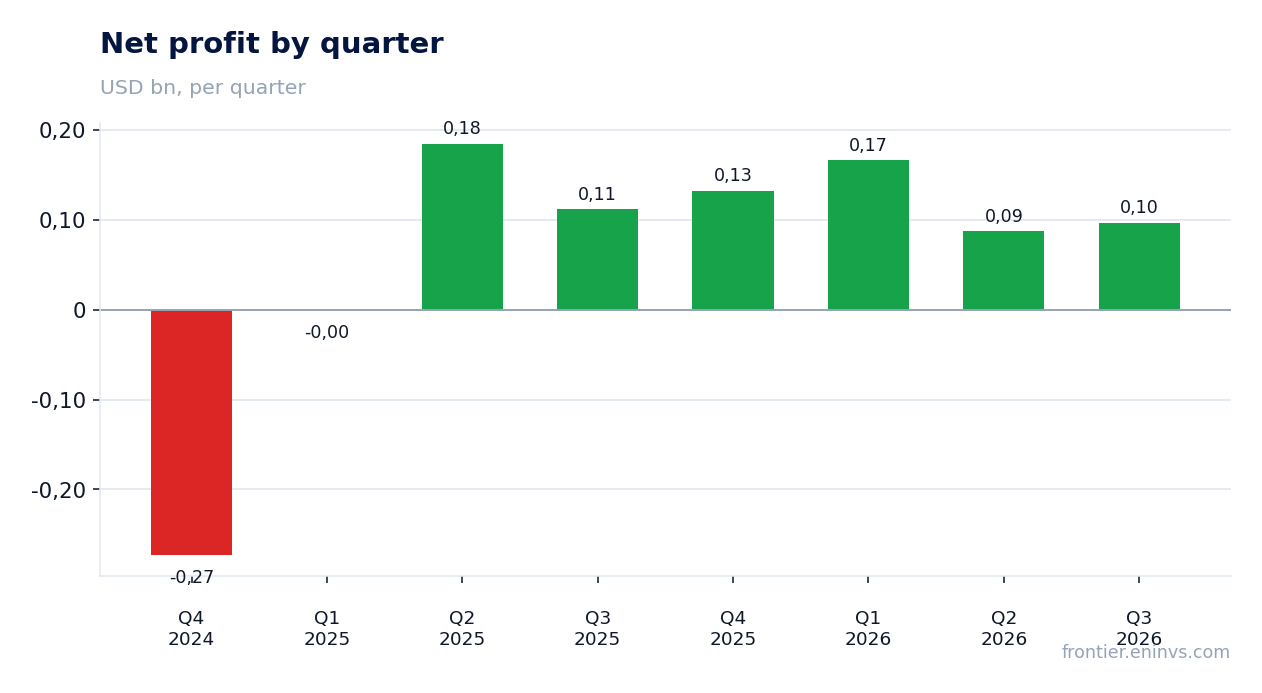
— Third-quarter 2026 profit fell 13.5% year on year to $96.4m
— Operating cash flow of $183.6m comfortably covered capital expenditure of $111.7m
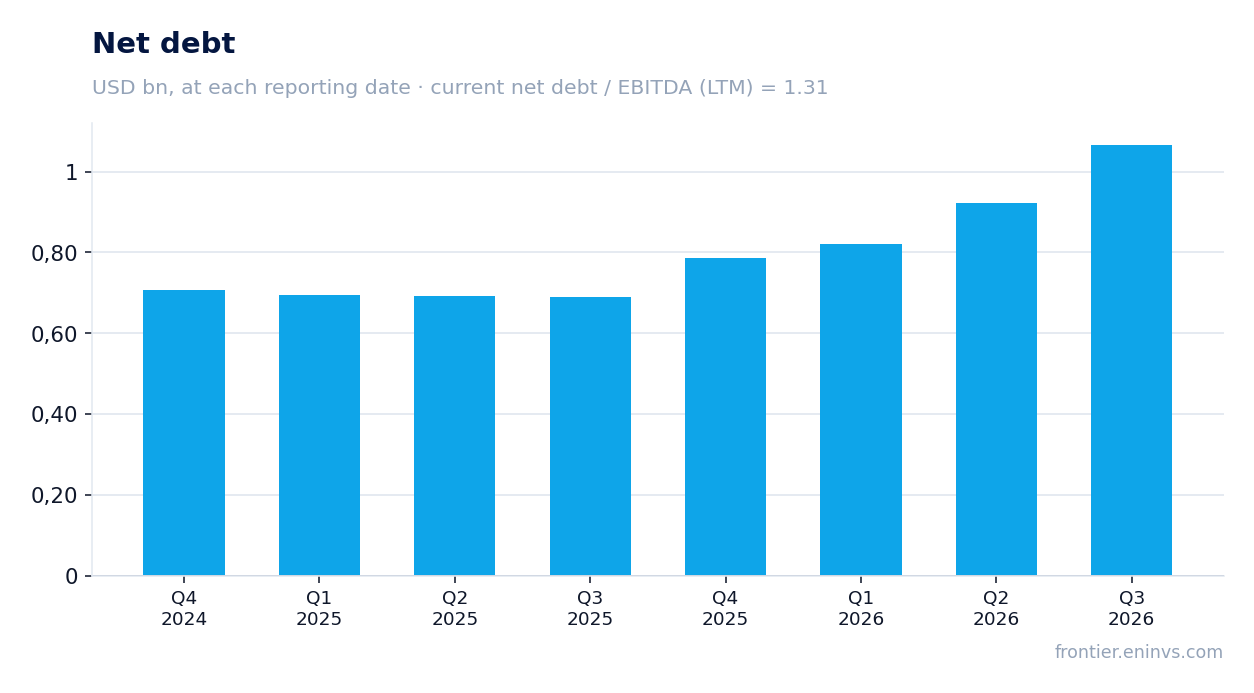
— Net debt rose from $0.7bn on 30 September 2025 to $1.1bn on 30 September 2026
— Leverage at 1.31x trailing-twelve-month EBITDA remains moderate
— EV/EBITDA of 4.4 is 17% below its own three-year average of 5.3
— The portal's model puts the share's upside at 20% to fair value
Attractiveness
Key figures, USD bn
| Metric | Q3 2025 | Q3 2026 | Change |
|---|---|---|---|
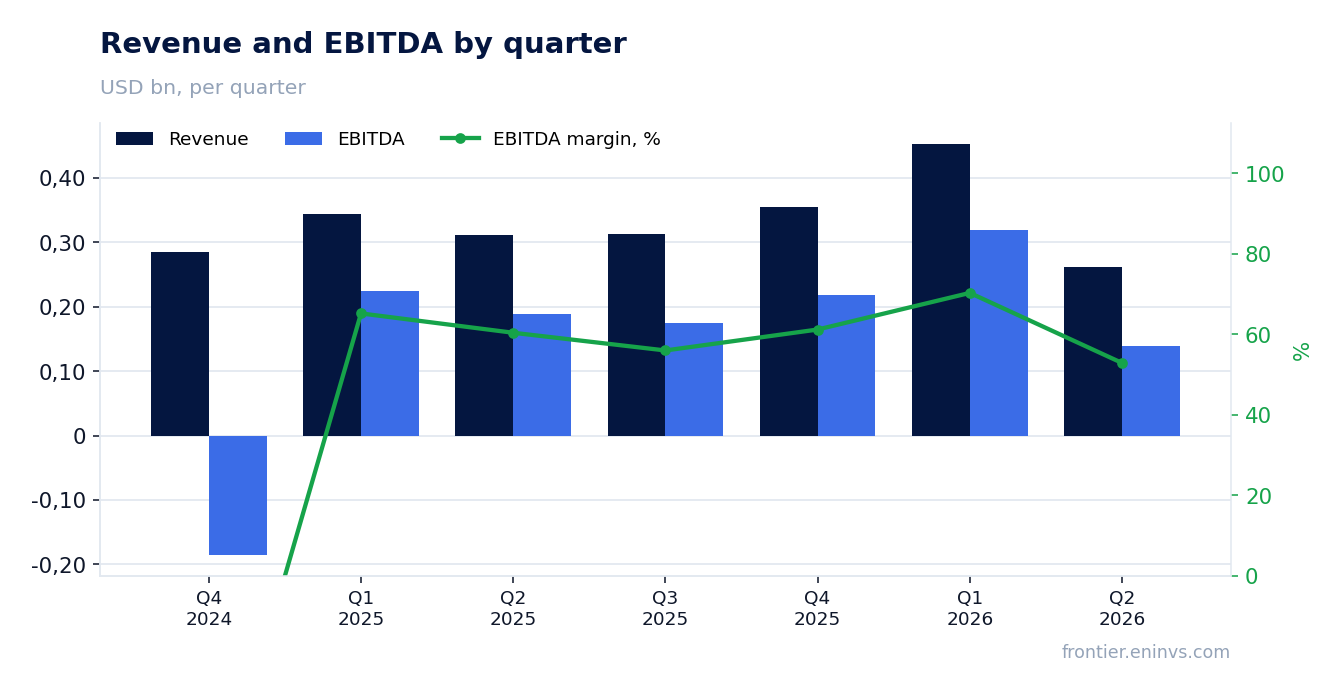
| Revenue | 0.31 | — | — |
| EBITDA | 0.18 | — | — |
| Operating profit | 0.09 | — | — |
| Net profit | 0.11 | 0.10 | -13.5% |
| Operating cash flow | 0.21 | 0.18 | -12.2% |
| Capex | 0.13 | 0.11 | -14.0% |
| EBITDA margin | 56.0% | — | — |
| Net margin | 35.6% | — | — |
Third-quarter 2026 profit fell 13.5% year on year to $96.4m
Gulfport Energy's net profit for the third quarter of 2026 was $96.4m against $111.4m a year earlier – a decline of 13.5%. This is the only reported-period figure disclosed in the facts: revenue, EBITDA and operating profit for the quarter are not given, so the change in profit cannot be broken down by line.
Over the trailing twelve months net profit was $481.7m and return on equity 19.2%. The quarterly profit is well below the average pace implied by that LTM figure, but without third-quarter revenue and cost data the cause cannot be named.
For a holder what matters more than the level of profit is its durability: with capital expenditure of $111.7m and operating cash flow of $183.6m, the quarter remains profitable on a cash basis, not just an accounting one.
Operating cash flow of $183.6m comfortably covered capital expenditure of $111.7m
Operating cash flow for the third quarter of 2026 was $183.6m, capital expenditure $111.7m. The $71.9m difference stayed with the company after investment, and this is the main argument in favour of the quality of the report.
Over the trailing twelve months operating cash flow reached $811.9m, while quarterly capital expenditure has ranged from $108m to $175m. The investment programme does not absorb the entire cash flow, leaving room to service debt.
Free cash flow for the quarter was positive but smaller than operating cash flow: about 40% of the flow goes to capital expenditure. That is a normal burden for an upstream company, yet it limits the pace at which debt can be reduced.
Net debt rose from $0.7bn on 30 September 2025 to $1.1bn on 30 September 2026
Gulfport Energy's net debt on 30 September 2026 was $1.07bn against $0.69bn on 30 September 2025 – an increase of $0.4bn over the year. In the third quarter debt added $0.1bn: on 30 June 2026 it stood at $0.92bn.
Rising debt alongside positive free cash flow means the company funded investment and, likely, other payments through borrowing. The facts contain no data on dividends or buybacks, so the specific line that absorbed the cash cannot be named.
The ratio of net debt to trailing-twelve-month EBITDA is 1.31. That is a moderate level for an upstream company: debt is serviced by profit in less than a year and a half. The direction of change in this ratio is not disclosed in the facts, so we state the level only.
Leverage at 1.31x trailing-twelve-month EBITDA remains moderate
The ratio of net debt to trailing-twelve-month EBITDA is 1.31. With LTM EBITDA of $812.7m and net debt of $1.07bn, the company could repay its debt in about a year and a half of operating profit.
For the upstream sector this level is considered comfortable: it leaves headroom to covenants and allows borrowing to be increased if needed. However, the rise in absolute debt of $0.4bn over the year against quarterly profit of $96.4m means debt is growing faster than the company services it.
Interest expense is not disclosed in the facts, so it is impossible to assess how much profit goes to debt service. Indirectly, the burden is signalled by the fact that quarterly profit fell 13.5% while debt rose – a combination that warrants attention in the next report.
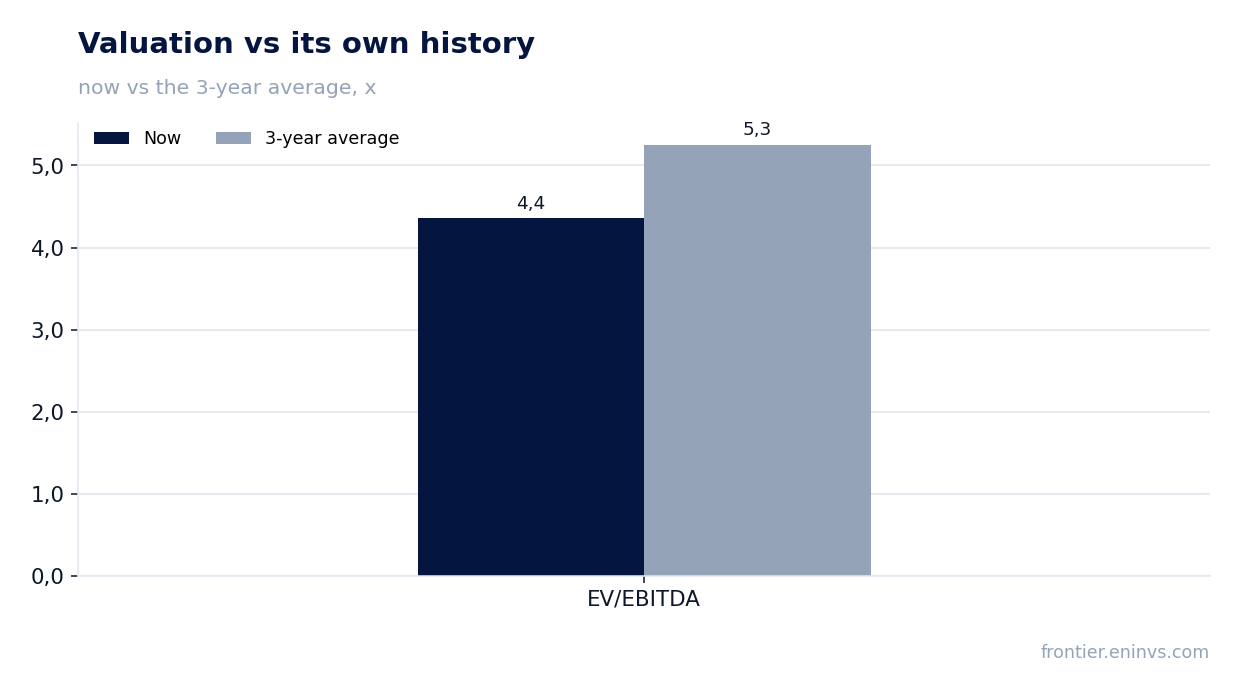
EV/EBITDA of 4.4 is 17% below its own three-year average of 5.3
The trailing-twelve-month EV/EBITDA multiple is 4.4 against its own three-year average of 5.3. The share trades 17% below its historical valuation on this multiple, making it cheap relative to its own past.
The trailing-twelve-month P/E is 5.8, which alongside a return on equity of 19.2% points to a high return on invested capital. Market capitalisation is $2.79bn, and with net debt of $1.07bn enterprise value is about $3.85bn.
On the portal's model, which re-prices EBITDA at current commodity prices at the target EV/EBITDA, fair value is 20% above the current price. This is our own estimate, not a market consensus, and it rests on the assumption that current commodity prices hold.
The portal's model puts the share's upside at 20% to fair value
The portal's model re-prices EBITDA at current commodity prices and applies a target EV/EBITDA, then compares the result with market capitalisation. At the current price the model implies 20% upside to fair value.
The estimate rests on two assumptions: current commodity prices hold and the target multiple is met. If oil and gas prices fall, EBITDA will be revised down and the upside will shrink. If the market re-rates the company closer to its three-year average of 5.3, the share will gain additional support.
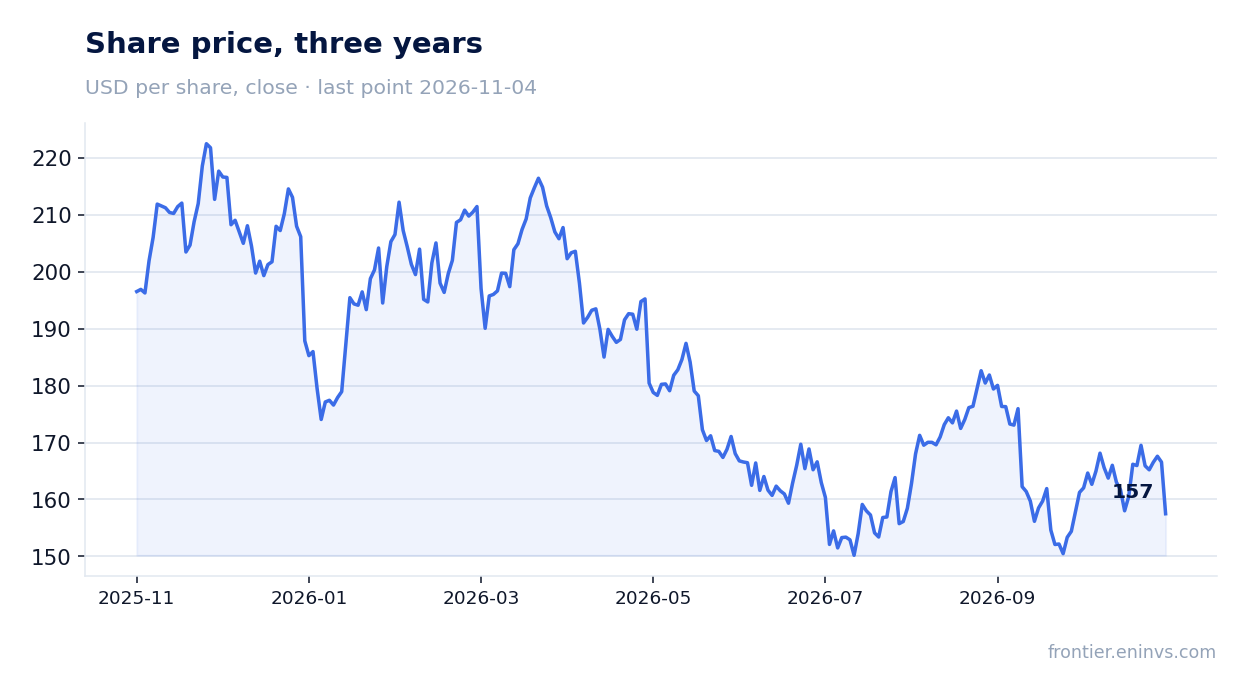
The market's reaction to the report was negative: the share lost 5.4% on the publication day and has stayed there through 4 November – 5.4% below the closing price before the report. The market reacted to the profit decline and rising debt, not to the multiples.
Valuation on the latest reported figures
| Metric | Value |
|---|---|
| Market cap | 2.79 bn USD |
| P/E (LTM) | 5.8 |
| EV/EBITDA (LTM) | 4.4 |
| P/B | 1.52 |
| Net debt / EBITDA (LTM) | 1.31 |
| Operating cash flow (LTM) | 0.81 bn |
| ROE | 19.2% |
| EV/EBITDA, 3-year average | 5.3 |
Tracked metrics of the idea
The metrics we track our idea "Gulfport, US gas producers" of 2026-07-24 by - at the idea date and now. The share price moved +0% over the period. Original write-up: https://frontier.eninvs.com/region/commodities/article/natgas
Idea: at publication and now
| Metric | 2026-07-24, price 157 | Now, price 157 |
|---|---|---|
| Fundamental value created, share of market cap | +53% | -41% |
| Upside on the commodity model (conservative price: midpoint of spot and 3-year average) | +18% | +20% |
Bottom line
The report's strength remains cash flow: $183.6m of operating cash flow against $111.7m of capital expenditure, producing positive free cash flow. The weak spot is profit, down 13.5%, and debt, up $0.4bn over the year to $1.07bn. The EV/EBITDA multiple of 4.4 is below its own three-year average of 5.3, and the portal's model implies 20% upside, so at the current price the share looks rather attractive. The key question for a holder is whether the company can sustain cash flow and halt debt growth while profit is falling.
Open the company's financial profile GPOR →
See also: market overview · valuation map · stock screeners