Green Thumb Industries: revenue accelerated to 11.3%, but profit turned negative as EBITDA margin fell

On November 4, Green Thumb Industries reported results for the third quarter of 2026. Revenue rose 11.3% year on year to $324.4 million, EBITDA fell 11.3% to $59.3 million, and net loss was $4.8 million versus a profit of $23.3 million a year earlier. Accelerating sales did not offset the margin decline: EBITDA margin fell to 18.3% from 22.9%. At an EV/EBITDA of 7.0 against its own three-year average of 8.3, the stock looks cheaper than its history, but weak profitability and a loss keep the rating from improving – a neutral verdict.
Key takeaways
— Revenue accelerated to 11.3% year on year, but the entire gain was eaten by the falling margin
— EBITDA fell 11.3%, and its margin dropped to 18.3% from 22.9%
— Net loss of $4.8 million versus a profit of $23.3 million a year earlier
— Operating cash flow of $58.3 million covered capital expenditures of $20.2 million
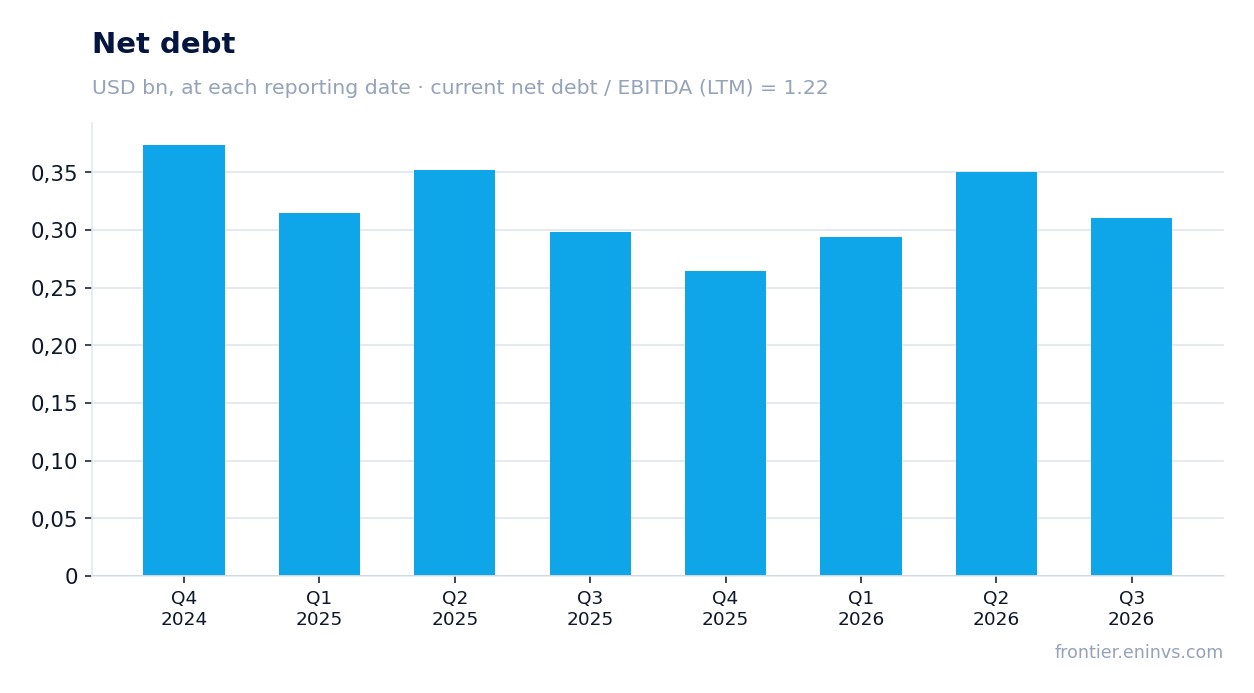
— Net debt of $310.5 million – 1.22x EBITDA over the last twelve months
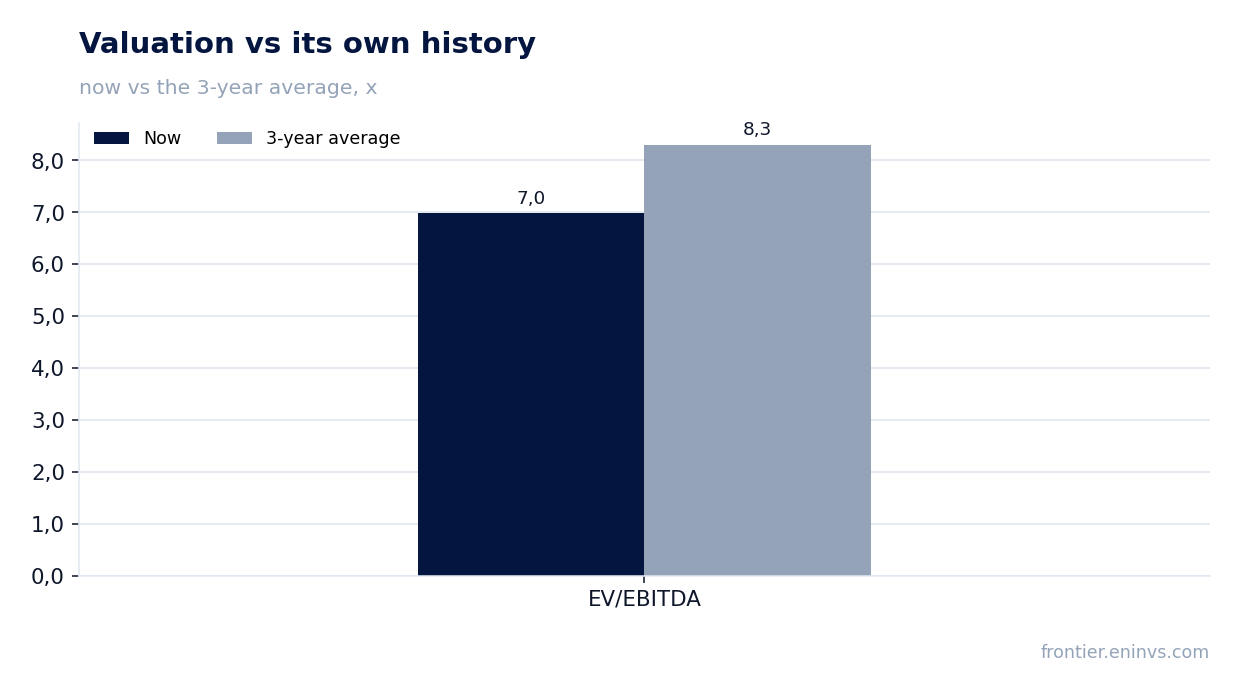
— EV/EBITDA of 7.0 is 16% below its own three-year average of 8.3
— On the portal's model, the upside to fair value is +20%
Attractiveness
Key figures, USD bn
| Metric | Q3 2025 | Q3 2026 | Change |
|---|---|---|---|
| Revenue | 0.29 | 0.32 | +11.3% |
| EBITDA | 0.07 | 0.06 | -11.3% |
| Operating profit | 0.04 | 0.03 | -31.7% |
| Net profit | 0.02 | -0.00 | -120.7% |
| Operating cash flow | 0.07 | 0.06 | -21.4% |
| Capex | 0.02 | 0.02 | +15.4% |
| EBITDA margin | 22.9% | 18.3% | -4.6 pp |
| Net margin | 8.0% | -1.5% | -9.5 pp |
Revenue accelerated to 11.3% year on year, but the entire gain was eaten by the falling margin
In the third quarter of 2026, revenue was $324.4 million, up 11.3% year on year. This is a marked acceleration from the second quarter, when growth was 4.6%. The company is growing sales faster than in previous periods.
However, the revenue acceleration did not translate into profit growth. EBITDA for the quarter fell 11.3% to $59.3 million, and operating profit was $25.1 million. Sales growth was accompanied by a decline in profitability, pointing to higher costs or lower prices.
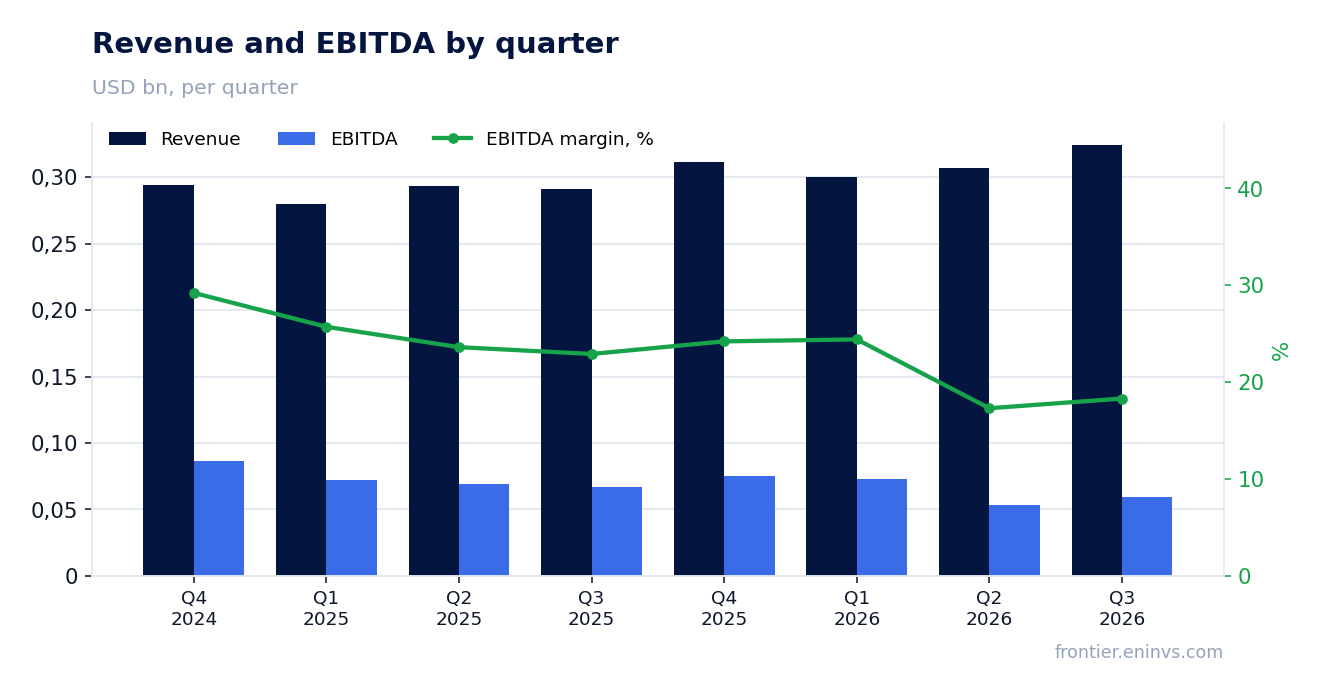
EBITDA fell 11.3%, and its margin dropped to 18.3% from 22.9%
EBITDA for the third quarter of 2026 was $59.3 million versus $66.8 million a year earlier. The 11.3% decline occurred alongside 11.3% revenue growth, meaning the business's profitability deteriorated markedly.
EBITDA margin fell to 18.3% from 22.9% in the third quarter of 2025. That is a drop of 4.6 percentage points. Operating profit also declined, to $25.1 million from $36.7 million a year earlier. The reasons for this movement are not disclosed in the provided data, but it points to cost pressure.
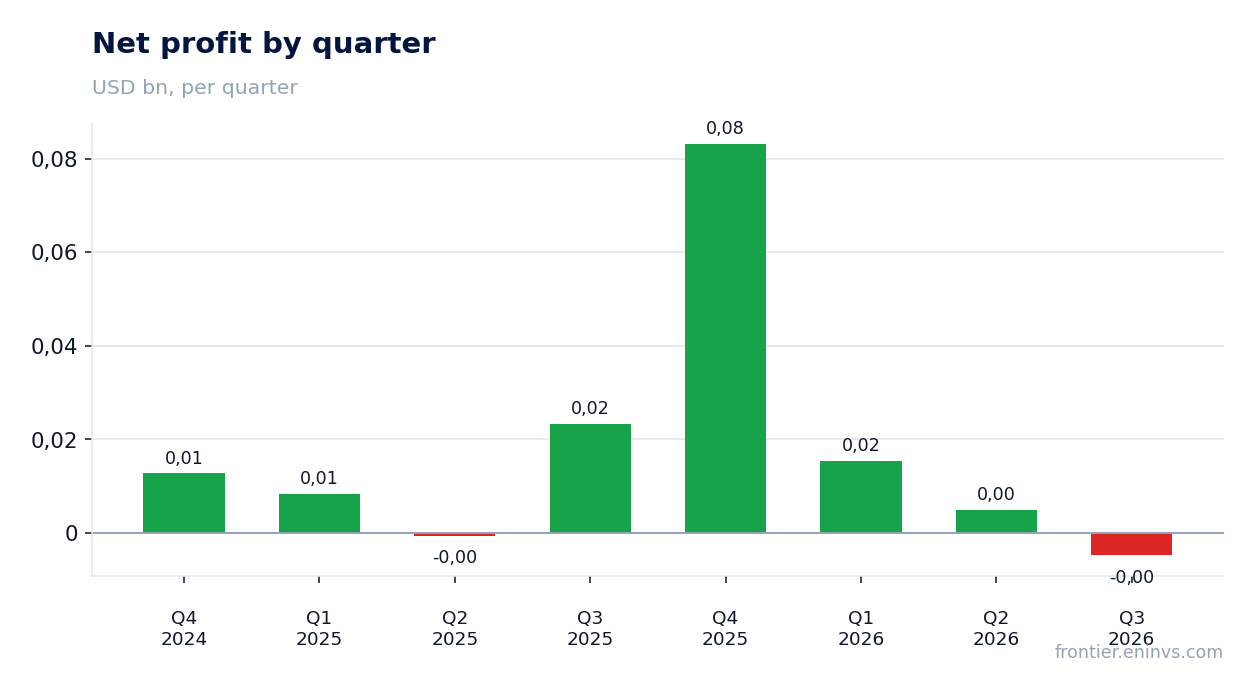
Net loss of $4.8 million versus a profit of $23.3 million a year earlier
Net loss in the third quarter of 2026 was $4.8 million, compared with a profit of $23.3 million a year earlier. The 120.7% decline resulted in a negative net margin of -1.5% versus 8.0% a year earlier.
The loss formed against the backdrop of falling operating profit and likely higher financial expenses, although their dynamics are not detailed in the provided data. Over the last twelve months, net profit remains positive at $98.7 million, but the quarterly result signals pressure on profitability.
Operating cash flow of $58.3 million covered capital expenditures of $20.2 million
Operating cash flow in the third quarter of 2026 was $58.3 million, down from $74.1 million a year earlier but still substantial. Capital expenditures were $20.2 million, so free cash flow before interest and taxes remains positive.
Over the last twelve months, operating cash flow was $253.2 million. The company generates enough funds to finance investments, supporting business resilience even amid a quarterly loss.
Net debt of $310.5 million – 1.22x EBITDA over the last twelve months
Net debt as of September 30, 2026, was $310.5 million. Compared with June 30, 2026, it decreased from $350.8 million, and compared with September 30, 2025, it remained at $298.4 million. The ratio of net debt to EBITDA over the last twelve months is 1.22, a moderate level.
Leverage does not create immediate risks, but its level requires monitoring. Interest expenses are not disclosed, but at current EBITDA the company can service its debt.
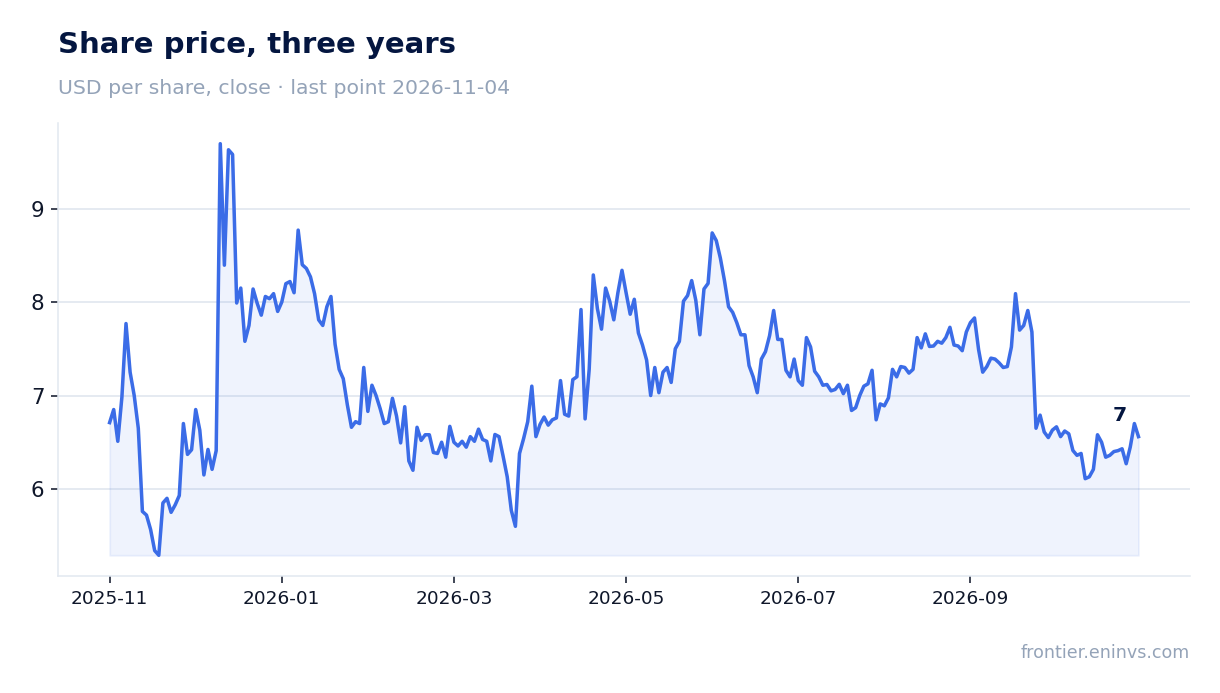
EV/EBITDA of 7.0 is 16% below its own three-year average of 8.3
The EV/EBITDA multiple over the last twelve months is 7.0, 16% below its own three-year average of 8.3. This indicates the stock is trading cheaper than usual relative to its history.
The P/E over the last twelve months is 15.3. Market capitalization is $1.51 billion. The lower multiple may reflect both the overall deterioration in profitability and market expectations. For an investor, this creates a potential entry point but requires confirmation of margin stabilization.
On the portal's model, the upside to fair value is +20%
On the portal's model, which reprices EBITDA at current commodity prices at the target EV/EBITDA, the upside to fair value is estimated at +20%. This is the portal's own estimate, not a market consensus.
The model assumes the current price does not fully reflect the fundamental value of the business. However, realizing this potential depends on margin recovery and cash flow sustainability.
Valuation on the latest reported figures
| Metric | Value |
|---|---|
| Market cap | 1.51 bn USD |
| P/E (LTM) | 15.3 |
| EV/EBITDA (LTM) | 7.0 |
| P/B | 0.79 |
| Net debt / EBITDA (LTM) | 1.22 |
| Operating cash flow (LTM) | 0.25 bn |
| ROE | -1.0% |
| EV/EBITDA, 3-year average | 8.3 |
Bottom line
Green Thumb Industries' revenue accelerated to 11.3% year on year, but this growth was not accompanied by improved profitability: EBITDA fell 11.3%, margin dropped to 18.3%, and the quarter ended with a loss of $4.8 million. Operating cash flow remains strong at $58.3 million, covering capital expenditures. Leverage is moderate at 1.22x EBITDA. The EV/EBITDA multiple of 7.0 is below its own three-year average of 8.3, making the stock cheaper than its history, but weak margin and the loss keep the rating in check. Verdict – neutral: the portal model's upside is +20%, but realizing it requires a recovery in profitability.
Open the company's financial profile GTBIF →
See also: market overview · valuation map · stock screeners