Gran Tierra Energy: Brent up 34% yet EBITDA turned negative – quality discounts and lower output got in the way
Contents

On November 6 Gran Tierra Energy released its third-quarter 2026 results. Average Brent in the period was $91.3 per barrel versus $68 a year earlier (+34.2%), yet revenue rose only 12.8% to $168.3 million and EBITDA came out negative at –$3.6 million. At the year-ago volumes and costs and today's oil price, our calculation puts EBITDA at $84.8 million – the company left $88.4 million on the table. Our verdict: the share is rather unattractive – EV/EBITDA of 6.9 at current prices offers no cushion, and the gap between the oil price and actual earnings is too wide. Our view: the share is rather unattractive at the current price.
Our view: is there upside
Our view in numbers
| Metric | Our read |
|---|---|
| Verdict | Rather unattractive |
| Upside on the portal model | no portal model for this share |
| Strongest case for | The $1.33 billion sale of the Colombia and Ecuador businesses promises about $315 million net cash and turns the company into a debt-free structure – a sum comparable to its $336.8 million market cap. |
| Strongest case against | At year-ago volumes and costs and today's oil price EBITDA should have been $84.8 million but came in at –$3.6 million – an $88.4 million gap showing the company is not converting the price into earnings. |
| What would change the view | Closing the sale before year-end and announcing buyback terms would move the verdict one step up; delayed approvals or Brent below $80 would move it one step down. |
Key takeaways
— Brent rose 34.2% but revenue added only 12.8% – quality and transport discounts ate most of the price gain
— At year-ago volumes and costs, our calculation puts EBITDA at $84.8 million; reported was –$3.6 million
— Output fell 6.5% year on year and 3.8% quarter on quarter – Colombia and Canada drag
— Operating cost per barrel was almost flat, but Colombia's rose 12.8% to $23.7
— The $42.4 million loss came from non-cash items: $30 million stock-based compensation and $29 million derivative revaluation
— At current prices EBITDA is estimated at $114.3 million, EV/EBITDA at 6.9 and net debt at 3.92 EBITDA
— The $1.33 billion sale of the Colombia and Ecuador businesses promises about $315 million net cash – the main case for the share
Key figures, USD bn
| Metric | Q3 2025 | Q3 2026 | Change |
|---|---|---|---|
| Revenue | 0.15 | 0.17 | +12.8% |
| EBITDA | 0.03 | -0.00 | -110.7% |
| Operating profit | -0.03 | -0.07 | — |
| Net profit | -0.02 | -0.04 | — |
| Operating cash flow | 0.05 | 0.03 | -44.8% |
| Capex | 0.06 | 0.05 | -29.0% |
| EBITDA margin | 22.6% | -2.1% | -24.7 pp |
| Net margin | -13.4% | -25.2% | -11.8 pp |
Brent rose 34.2% but revenue added only 12.8% – quality and transport discounts ate most of the price gain
Average Brent in Q3 2026 was $91.3 per barrel versus $68 a year earlier, up 34.2%. Against the previous quarter the price fell 5.6% from $96.8. Spot now stands at $91.8, just 0.6% above the period average, so the price backdrop for the next quarter is almost unchanged.
Revenue for the quarter was $168.3 million, up 12.8% year on year but well short of what the price rise alone implies. The average realised price before royalties rose 28.7% to $55.9 per boe, lagging Brent. The reason is quality and transport discounts: in South America they widened to $15.83 per barrel versus $10.80 a year earlier and $10.31 in the prior quarter. The Castilla differential jumped to $13.73 from $4.88, Vasconia to $6.68 from $1.88 and Oriente to $10.32 from $7.20.
The company names the cause: the closed Colombia–Ecuador border forces Putumayo crude onto alternative routes, costing about $3.7 million in the quarter and $13.6 million year to date. In Ecuador pricing is on an M-1 basis: at $85.43 that cut revenue by about $5 million. The realised price was 0.61 of Brent versus 0.64 a year earlier – the discount widened.
Commodity prices: period average and now
| Benchmark | Year ago | Q3 2026 | YoY | Spot 2026-11-11 |
|---|---|---|---|---|
| Brent, USD | 68,0 | 91,3 | +34,2% | 91,8 |
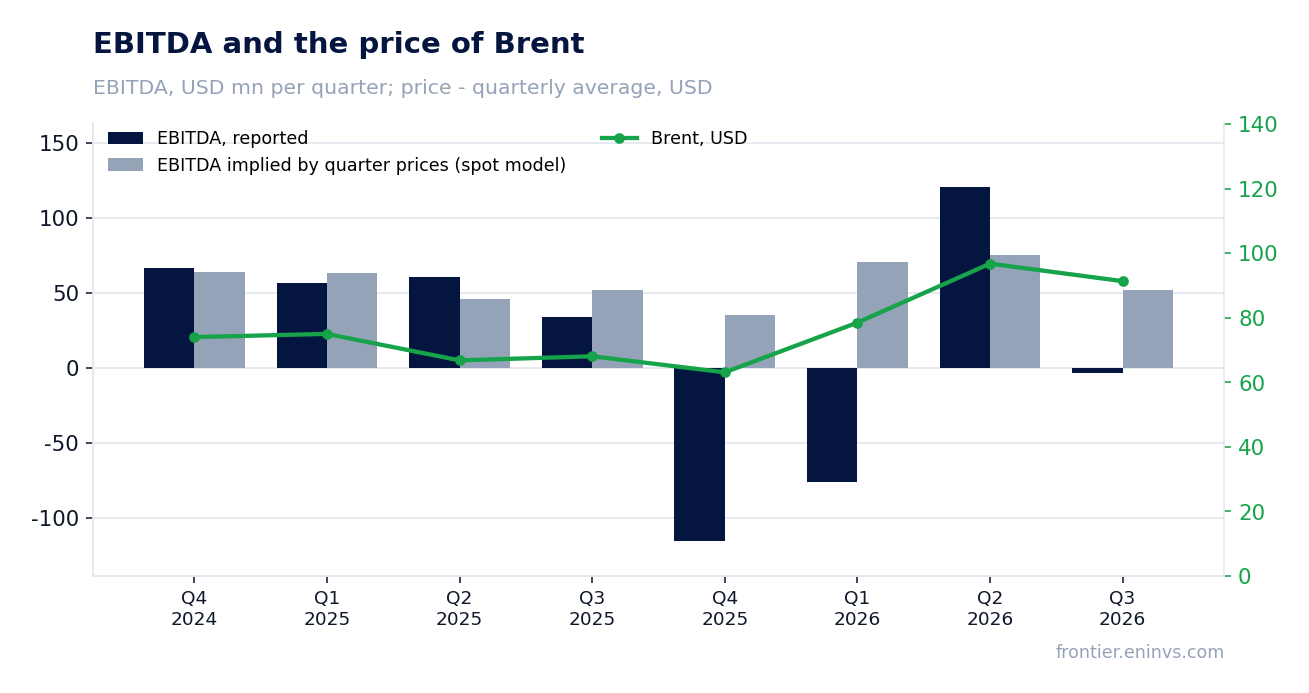
At year-ago volumes and costs, our calculation puts EBITDA at $84.8 million; reported was –$3.6 million
Holding Q3 2025 volumes and non-commodity costs and moving only the oil price, revenue would have been $200.3 million and EBITDA $84.8 million. Actual revenue was $168.3 million, $32.0 million less, and EBITDA –$3.6 million, $88.4 million worse. Against the prior quarter the picture is the same: at its volumes and costs and today's price EBITDA should have been $110.4 million, but came in at –$3.6 million, a gap of $114.0 million.
The gap has three causes named in the facts and the release. First, output fell 6.5% year on year. Second, wider quality and transport discounts left the realised price behind Brent. Third, Colombian operating cost per barrel rose 12.8% to $23.7 while the total was almost flat at $16.9 versus $16.8.
The portal's spot model, re-priced to the period's prices, expected EBITDA of $51.9 million and revenue of $191 million. Actual EBITDA missed the model by 106.9% and revenue by 11.9%. Deviations from the model in the four prior periods ranged from –34.6% to +62.5%, so this is the deepest miss in that stretch.
What the prices implied and what the company earned
| Base (Q3 2025) | Implied at period prices | Reported | Reported vs implied | |
|---|---|---|---|---|
| Revenue, USD mn | 149,3 | 200,3 | 168,3 | -16,0% |
| EBITDA, USD mn | 33,8 | 84,8 | -3,60 | -104,2% |
| EBITDA, portal spot model, USD mn | — | 51,9 | -3,60 | -106,9% |
Revenue and EBITDA by quarter
| Period | Measure | bn USD |
|---|---|---|
| Q4 2024 | Revenue | 0.14729 |
| Q1 2025 | Revenue | 0.168173 |
| Q2 2025 | Revenue | 0.152481 |
| Q3 2025 | Revenue | 0.149254 |
| Q4 2025 | Revenue | 0.132559 |
| Q1 2026 | Revenue | 0.172057 |
| Q2 2026 | Revenue | 0.18718100000000001 |
| Q3 2026 | Revenue | 0.168306 |
| Q4 2024 | EBITDA | 0.066448 |
| Q1 2025 | EBITDA | 0.056475 |
| Q2 2025 | EBITDA | 0.060542 |
| Q3 2025 | EBITDA | 0.03375499999999999 |
| Q4 2025 | EBITDA | −0.1157 |
| Q1 2026 | EBITDA | −0.075893 |
| Q2 2026 | EBITDA | 0.120862 |
| Q3 2026 | EBITDA | −0.0035989999999999894 |
EBITDA margin
| Period | Measure | % |
|---|---|---|
| Q4 2024 | EBITDA margin | 45.1 |
| Q1 2025 | EBITDA margin | 33.6 |
| Q2 2025 | EBITDA margin | 39.7 |
| Q3 2025 | EBITDA margin | 22.6 |
| Q4 2025 | EBITDA margin | −87.3 |
| Q1 2026 | EBITDA margin | −44.1 |
| Q2 2026 | EBITDA margin | 64.6 |
| Q3 2026 | EBITDA margin | −2.1 |
Output fell 6.5% year on year and 3.8% quarter on quarter – Colombia and Canada drag
Average daily output in Q3 was 39,904 boe/d versus 42,685 a year earlier (–6.5%) and 41,501 in the prior quarter (–3.8%). Colombia fell 15.0% year on year to 19,305 boe/d and Canada 20.2% to 12,852. Ecuador doubled to 7,747 boe/d, but its share is too small to offset the decline.
The company attributes the Colombian drop to a contractual reduction in its working interest in the Suroriente block at high oil prices and to lower output at the Cohembi field. In Canada the June 2026 sale of the Simonette and Lodgepole areas weighed. Ecuador was helped by the Charapa and Chanangue blocks and by the Perico block acquired in December 2025.
At current output the reserve life is 6.7 years. That is a short horizon and makes next quarter's volumes especially important: without a recovery, the price gain barely reaches revenue.
Production, realised price and unit cost (company release)
| Metric | Year ago | Reported period | YoY |
|---|---|---|---|
| Average Daily Production (WI, before royalties), total, boe/d | 42 685 | 39 904 | -6,5% |
| Average Daily Production (WI, before royalties), Colombia, boe/d | 22 701 | 19 305 | -15,0% |
| Average Realized Price before Royalties, total (before hedges), $/boe | 43,43 | 55,90 | +28,7% |
| Average Realized Price, total (before hedges), $/boe | 36,81 | 44,36 | +20,5% |
| Average Realized Price, Colombia (before hedges), $/boe | 48,12 | 57,89 | +20,3% |
| Operating Expenses per boe, total, $/boe | 16,81 | 16,92 | +0,7% |
| Operating Expenses per boe, Colombia, $/boe | 21,04 | 23,73 | +12,8% |
| Operating Expenses per boe, Ecuador, $/boe | 20,20 | 14,50 | -28,2% |
| Operating Expenses per boe, Canada, $/boe | 9,72 | 8,31 | -14,5% |
Operating cost per barrel was almost flat, but Colombia's rose 12,8% to $23.7
Total operating cost per barrel was $16.9 versus $16.8 a year earlier – a change within 1%. Behind that flat number the regions diverge. Colombia rose 12.8% to $23.7 per barrel, Ecuador fell 28.2% to $14.5 and Canada 14.5% to $8.31.
The Colombian increase is attributed to heavier workover activity and higher lifting costs on inventory built at the end of the prior quarter and sold in this one, plus a stronger Colombian peso. Ecuador reflects two liftings versus one in the prior quarter. Canada reflects the Simonette and Lodgepole sale and lower personnel and maintenance costs.
Transport costs rose 42% quarter on quarter to $5.5 million on higher pipeline volumes. Cash G&A before stock compensation fell to $3.11 per barrel from $3.49. Overall cash netback per barrel dropped to $8.34 from $15.90 in the prior quarter, mainly on realised derivative losses and FX.
The $42.4 million loss came from non-cash items: $30 million stock-based compensation and $29 million derivative revaluation
The net loss for the quarter was $42.4 million, or $1.20 per share, versus a $20.0 million loss ($0.57 per share) a year earlier and $24.9 million of profit in the prior quarter. The net margin was –25.2% versus –13.4% a year earlier. EBITDA on our basis (operating loss of $68.0 million plus $64.4 million of DD&A) was –$3.6 million.
The company names the causes: $30 million of non-cash stock-based compensation driven by the share-price rise in the quarter and $29 million of derivative losses, partly offset by a $30 million deferred tax recovery. The first two sit outside EBITDA: the derivative result is booked below operating income, within other income and expenses.
Cash settlement on derivatives was a loss of $4.80 per barrel versus a $1.84 gain a year earlier. That too sits below operating income, so it does not affect EBITDA but explains the fall in net profit and cash netback. Stripping out one-offs would flatter the picture, but the operating economics remain weak.
At current prices EBITDA is estimated at $114.3 million, EV/EBITDA at 6.9 and net debt at 3.92 EBITDA
Under the portal's spot model, at today's commodity prices annual EBITDA would be $114.3 million versus $62.6 million over the last twelve months – up 82.6%. That is the valuation base: LTM reflects past prices, not current ones. On that EBITDA the EV/EBITDA multiple is 6.9 and net debt is 3.92 EBITDA.
Net debt at September 30, 2026 was $447.9 million against a market cap of $336.8 million. Net debt at 3.92 EBITDA is high for a company with a 6.7-year reserve life. Return on equity is negative at –152.5%, reflecting both the loss and a small equity base.
The multiple cannot be compared with its own three-year history: no such average is in the facts. But 6.9 with negative EBITDA in the reported period and falling output does not look cheap. The main case for the share is not current earnings but the sale of the Colombia and Ecuador businesses: $1.33 billion total consideration and about $315 million net cash, of which $250 million in cash including the $50 million deposit already received.
Share price, three years
close, last point 2026-11-10
| Period | Measure | USD per share |
|---|---|---|
| 2025-11-10 | Closing price | 4.440000057220459 |
| 2025-11-11 | Closing price | 4.340000152587891 |
| 2025-11-12 | Closing price | 4.449999809265137 |
| 2025-11-13 | Closing price | 4.389999866485596 |
| 2025-11-14 | Closing price | 4.369999885559082 |
| 2025-11-17 | Closing price | 4.139999866485596 |
| 2025-11-18 | Closing price | 4.360000133514404 |
| 2025-11-19 | Closing price | 4.449999809265137 |
| 2025-11-20 | Closing price | 4.489999771118164 |
| 2025-11-21 | Closing price | 4.380000114440918 |
| 2025-11-24 | Closing price | 4.369999885559082 |
| 2025-11-25 | Closing price | 4.260000228881836 |
| 2025-11-26 | Closing price | 4.409999847412109 |
| 2025-11-28 | Closing price | 4.53000020980835 |
| 2025-12-01 | Closing price | 4.610000133514404 |
| 2025-12-02 | Closing price | 4.519999980926514 |
| 2025-12-03 | Closing price | 4.659999847412109 |
| 2025-12-04 | Closing price | 4.699999809265137 |
| 2025-12-05 | Closing price | 4.710000038146973 |
| 2025-12-08 | Closing price | 4.710000038146973 |
| 2025-12-09 | Closing price | 4.659999847412109 |
| 2025-12-10 | Closing price | 4.679999828338623 |
| 2025-12-11 | Closing price | 4.03000020980835 |
| 2025-12-12 | Closing price | 3.9000000953674316 |
| 2025-12-15 | Closing price | 3.9000000953674316 |
| 2025-12-16 | Closing price | 3.759999990463257 |
| 2025-12-17 | Closing price | 4.070000171661377 |
| 2025-12-18 | Closing price | 3.930000066757202 |
| 2025-12-19 | Closing price | 3.8499999046325684 |
| 2025-12-22 | Closing price | 4.010000228881836 |
| 2025-12-23 | Closing price | 4.199999809265137 |
| 2025-12-24 | Closing price | 4.230000019073486 |
| 2025-12-26 | Closing price | 4.150000095367432 |
| 2025-12-29 | Closing price | 4.150000095367432 |
| 2025-12-30 | Closing price | 4.300000190734863 |
| 2025-12-31 | Closing price | 4.239999771118164 |
| 2026-01-02 | Closing price | 4.230000019073486 |
| 2026-01-05 | Closing price | 4.099999904632568 |
| 2026-01-06 | Closing price | 3.9800000190734863 |
| 2026-01-07 | Closing price | 3.880000114440918 |
| 2026-01-08 | Closing price | 4.289999961853027 |
| 2026-01-09 | Closing price | 4.389999866485596 |
| 2026-01-12 | Closing price | 4.619999885559082 |
| 2026-01-13 | Closing price | 4.71999979019165 |
| 2026-01-14 | Closing price | 4.949999809265137 |
| 2026-01-15 | Closing price | 4.840000152587891 |
| 2026-01-16 | Closing price | 4.920000076293945 |
| 2026-01-20 | Closing price | 5.050000190734863 |
| 2026-01-21 | Closing price | 5.110000133514404 |
| 2026-01-22 | Closing price | 4.920000076293945 |
| 2026-01-23 | Closing price | 5.25 |
| 2026-01-26 | Closing price | 5.460000038146973 |
| 2026-01-27 | Closing price | 5.670000076293945 |
| 2026-01-28 | Closing price | 5.710000038146973 |
| 2026-01-29 | Closing price | 6.25 |
| 2026-01-30 | Closing price | 5.429999828338623 |
| 2026-02-02 | Closing price | 5.130000114440918 |
| 2026-02-03 | Closing price | 5.460000038146973 |
| 2026-02-04 | Closing price | 5.75 |
| 2026-02-05 | Closing price | 5.320000171661377 |
| 2026-02-06 | Closing price | 5.480000019073486 |
| 2026-02-09 | Closing price | 5.699999809265137 |
| 2026-02-10 | Closing price | 5.769999980926514 |
| 2026-02-11 | Closing price | 5.960000038146973 |
| 2026-02-12 | Closing price | 5.420000076293945 |
| 2026-02-13 | Closing price | 5.570000171661377 |
| 2026-02-17 | Closing price | 5.440000057220459 |
| 2026-02-18 | Closing price | 5.880000114440918 |
| 2026-02-19 | Closing price | 6.090000152587891 |
| 2026-02-20 | Closing price | 6.75 |
| 2026-02-23 | Closing price | 6.230000019073486 |
| 2026-02-24 | Closing price | 6.179999828338623 |
| 2026-02-25 | Closing price | 5.889999866485596 |
| 2026-02-26 | Closing price | 5.929999828338623 |
| 2026-02-27 | Closing price | 6.039999961853027 |
| 2026-03-02 | Closing price | 6.510000228881836 |
| 2026-03-03 | Closing price | 6.579999923706055 |
| 2026-03-04 | Closing price | 6.889999866485596 |
| 2026-03-05 | Closing price | 7.369999885559082 |
| 2026-03-06 | Closing price | 7.869999885559082 |
| 2026-03-09 | Closing price | 7.849999904632568 |
| 2026-03-10 | Closing price | 7.849999904632568 |
| 2026-03-11 | Closing price | 7.800000190734863 |
| 2026-03-12 | Closing price | 8.15999984741211 |
| 2026-03-13 | Closing price | 8.210000038146973 |
| 2026-03-16 | Closing price | 8.430000305175781 |
| 2026-03-17 | Closing price | 8.720000267028809 |
| 2026-03-18 | Closing price | 8.100000381469727 |
| 2026-03-19 | Closing price | 8.579999923706055 |
| 2026-03-20 | Closing price | 8.640000343322754 |
| 2026-03-23 | Closing price | 8.079999923706055 |
| 2026-03-24 | Closing price | 8.609999656677246 |
| 2026-03-25 | Closing price | 8.59000015258789 |
| 2026-03-26 | Closing price | 8.720000267028809 |
| 2026-03-27 | Closing price | 9.069999694824219 |
| 2026-03-30 | Closing price | 9.239999771118164 |
| 2026-03-31 | Closing price | 8.970000267028809 |
| 2026-04-01 | Closing price | 8.180000305175781 |
| 2026-04-02 | Closing price | 8.529999732971191 |
| 2026-04-06 | Closing price | 8.670000076293945 |
| 2026-04-07 | Closing price | 8.670000076293945 |
| 2026-04-08 | Closing price | 7.570000171661377 |
| 2026-04-09 | Closing price | 7.590000152587891 |
| 2026-04-10 | Closing price | 7.53000020980835 |
| 2026-04-13 | Closing price | 7.980000019073486 |
| 2026-04-14 | Closing price | 7.849999904632568 |
| 2026-04-15 | Closing price | 7.840000152587891 |
| 2026-04-16 | Closing price | 8.0600004196167 |
| 2026-04-17 | Closing price | 7.519999980926514 |
| 2026-04-20 | Closing price | 8.029999732971191 |
| 2026-04-21 | Closing price | 8.319999694824219 |
| 2026-04-22 | Closing price | 8.9399995803833 |
| 2026-04-23 | Closing price | 8.949999809265137 |
| 2026-04-24 | Closing price | 8.640000343322754 |
| 2026-04-27 | Closing price | 8.800000190734863 |
| 2026-04-28 | Closing price | 8.90999984741211 |
| 2026-04-29 | Closing price | 9.260000228881836 |
| 2026-04-30 | Closing price | 9.260000228881836 |
| 2026-05-01 | Closing price | 9.220000267028809 |
| 2026-05-04 | Closing price | 9.510000228881836 |
| 2026-05-05 | Closing price | 9.390000343322754 |
| 2026-05-06 | Closing price | 8.739999771118164 |
| 2026-05-07 | Closing price | 8.760000228881836 |
| 2026-05-08 | Closing price | 9.149999618530273 |
| 2026-05-11 | Closing price | 8.880000114440918 |
| 2026-05-12 | Closing price | 9.220000267028809 |
| 2026-05-13 | Closing price | 9.050000190734863 |
| 2026-05-14 | Closing price | 9.010000228881836 |
| 2026-05-15 | Closing price | 9.170000076293945 |
| 2026-05-18 | Closing price | 9.449999809265137 |
| 2026-05-19 | Closing price | 9.170000076293945 |
| 2026-05-20 | Closing price | 8.75 |
| 2026-05-21 | Closing price | 8.470000267028809 |
| 2026-05-22 | Closing price | 8.5 |
| 2026-05-26 | Closing price | 8.170000076293945 |
| 2026-05-27 | Closing price | 7.889999866485596 |
| 2026-05-28 | Closing price | 8.039999961853027 |
| 2026-05-29 | Closing price | 7.769999980926514 |
| 2026-06-01 | Closing price | 8.390000343322754 |
| 2026-06-02 | Closing price | 8.300000190734863 |
| 2026-06-03 | Closing price | 8.15999984741211 |
| 2026-06-04 | Closing price | 8.229999542236328 |
| 2026-06-05 | Closing price | 7.619999885559082 |
| 2026-06-08 | Closing price | 7.610000133514404 |
| 2026-06-09 | Closing price | 7.409999847412109 |
| 2026-06-10 | Closing price | 7.980000019073486 |
| 2026-06-11 | Closing price | 7.989999771118164 |
| 2026-06-12 | Closing price | 8.140000343322754 |
| 2026-06-15 | Closing price | 7.739999771118164 |
| 2026-06-16 | Closing price | 7.550000190734863 |
| 2026-06-17 | Closing price | 7.619999885559082 |
| 2026-06-18 | Closing price | 7.369999885559082 |
| 2026-06-22 | Closing price | 7.210000038146973 |
| 2026-06-23 | Closing price | 7.099999904632568 |
| 2026-06-24 | Closing price | 6.199999809265137 |
| 2026-06-25 | Closing price | 6.03000020980835 |
| 2026-06-26 | Closing price | 6.25 |
| 2026-06-29 | Closing price | 6.210000038146973 |
| 2026-06-30 | Closing price | 6.25 |
| 2026-07-01 | Closing price | 5.960000038146973 |
| 2026-07-02 | Closing price | 5.909999847412109 |
| 2026-07-06 | Closing price | 5.96999979019165 |
| 2026-07-07 | Closing price | 6.239999771118164 |
| 2026-07-08 | Closing price | 6.590000152587891 |
| 2026-07-09 | Closing price | 6.28000020980835 |
| 2026-07-10 | Closing price | 6.25 |
| 2026-07-13 | Closing price | 6.679999828338623 |
| 2026-07-14 | Closing price | 6.570000171661377 |
| 2026-07-15 | Closing price | 6.53000020980835 |
| 2026-07-16 | Closing price | 6.320000171661377 |
| 2026-07-17 | Closing price | 6.590000152587891 |
| 2026-07-20 | Closing price | 6.650000095367432 |
| 2026-07-21 | Closing price | 6.909999847412109 |
| 2026-07-22 | Closing price | 7.269999980926514 |
| 2026-07-23 | Closing price | 7.699999809265137 |
| 2026-07-24 | Closing price | 7.340000152587891 |
| 2026-07-27 | Closing price | 6.730000019073486 |
| 2026-07-28 | Closing price | 6.389999866485596 |
| 2026-07-29 | Closing price | 6.679999828338623 |
| 2026-07-30 | Closing price | 6.690000057220459 |
| 2026-07-31 | Closing price | 7.489999771118164 |
| 2026-08-03 | Closing price | 6.96999979019165 |
| 2026-08-04 | Closing price | 6.829999923706055 |
| 2026-08-05 | Closing price | 9.4399995803833 |
| 2026-08-06 | Closing price | 9.470000267028809 |
| 2026-08-07 | Closing price | 8.960000038146973 |
| 2026-08-10 | Closing price | 8.949999809265137 |
| 2026-08-11 | Closing price | 9.529999732971191 |
| 2026-08-12 | Closing price | 9.350000381469727 |
| 2026-08-13 | Closing price | 9.5 |
| 2026-08-14 | Closing price | 9.1899995803833 |
| 2026-08-17 | Closing price | 9.380000114440918 |
| 2026-08-18 | Closing price | 9.5 |
| 2026-08-19 | Closing price | 9.8100004196167 |
| 2026-08-20 | Closing price | 9.760000228881836 |
| 2026-08-21 | Closing price | 9.90999984741211 |
| 2026-08-24 | Closing price | 9.949999809265137 |
| 2026-08-25 | Closing price | 9.619999885559082 |
| 2026-08-26 | Closing price | 10.09000015258789 |
| 2026-08-27 | Closing price | 10.109999656677246 |
| 2026-08-28 | Closing price | 9.869999885559082 |
| 2026-08-31 | Closing price | 10.149999618530273 |
| 2026-09-01 | Closing price | 10.34000015258789 |
| 2026-09-02 | Closing price | 10.1899995803833 |
| 2026-09-03 | Closing price | 10.109999656677246 |
| 2026-09-04 | Closing price | 10.100000381469727 |
| 2026-09-08 | Closing price | 10.239999771118164 |
| 2026-09-09 | Closing price | 10.470000267028809 |
| 2026-09-10 | Closing price | 11.010000228881836 |
| 2026-09-11 | Closing price | 10.789999961853027 |
| 2026-09-14 | Closing price | 10.569999694824219 |
| 2026-09-15 | Closing price | 10.989999771118164 |
| 2026-09-16 | Closing price | 10.630000114440918 |
| 2026-09-17 | Closing price | 10.239999771118164 |
| 2026-09-18 | Closing price | 10.300000190734863 |
| 2026-09-21 | Closing price | 9.90999984741211 |
| 2026-09-22 | Closing price | 9.789999961853027 |
| 2026-09-23 | Closing price | 9.970000267028809 |
| 2026-09-24 | Closing price | 10.180000305175781 |
| 2026-09-25 | Closing price | 9.619999885559082 |
| 2026-09-28 | Closing price | 9.649999618530273 |
| 2026-09-29 | Closing price | 9.75 |
| 2026-09-30 | Closing price | 9.859999656677246 |
| 2026-10-01 | Closing price | 10.010000228881836 |
| 2026-10-02 | Closing price | 10.4399995803833 |
| 2026-10-05 | Closing price | 10.479999542236328 |
| 2026-10-06 | Closing price | 10.460000038146973 |
| 2026-10-07 | Closing price | 10.369999885559082 |
| 2026-10-08 | Closing price | 10.489999771118164 |
| 2026-10-09 | Closing price | 10.579999923706055 |
| 2026-10-12 | Closing price | 10.520000457763672 |
| 2026-10-13 | Closing price | 10.619999885559082 |
| 2026-10-14 | Closing price | 10.75 |
| 2026-10-15 | Closing price | 10.609999656677246 |
| 2026-10-16 | Closing price | 10.899999618530273 |
| 2026-10-19 | Closing price | 11.380000114440918 |
| 2026-10-20 | Closing price | 11.3100004196167 |
| 2026-10-21 | Closing price | 11.579999923706055 |
| 2026-10-22 | Closing price | 11.350000381469727 |
| 2026-10-23 | Closing price | 11.729999542236328 |
| 2026-10-26 | Closing price | 11.489999771118164 |
| 2026-10-27 | Closing price | 11.520000457763672 |
| 2026-10-28 | Closing price | 11.569999694824219 |
| 2026-10-29 | Closing price | 11.3100004196167 |
| 2026-10-30 | Closing price | 11.329999923706055 |
| 2026-11-02 | Closing price | 10.279999732971191 |
| 2026-11-03 | Closing price | 10.260000228881836 |
| 2026-11-04 | Closing price | 10.050000190734863 |
| 2026-11-05 | Closing price | 9.390000343322754 |
| 2026-11-06 | Closing price | 9.420000076293945 |
| 2026-11-09 | Closing price | 9.579999923706055 |
| 2026-11-10 | Closing price | 9.520000457763672 |
The $1.33 billion sale of the Colombia and Ecuador businesses promises about $315 million net cash – the main case for the share
On August 5, 2026 Gran Tierra signed an agreement to sell its Colombian and Ecuadorian businesses to Maurel & Prom for $1.33 billion, subject to adjustment. Expected net cash proceeds are about $315 million, of which $250 million in cash including the $50 million deposit already in the cash balance, and $65 million under an unsecured note 364 days after closing. Stockholders approved the sale on October 9, with closing targeted before year-end subject to approvals in Colombia and Ecuador.
After closing the company expects to be debt-free and to use part of the proceeds to buy back shares. The structure, size and terms will be set by the board separately and depend on completion. That is the key fork for a holder: if the sale closes, the $447.9 million of net debt goes with the business, leaving Canada and Azerbaijan.
In parallel the company is developing Azerbaijan: on October 5 parliament ratified the EDPSA with SOCAR for the Guba-Khazaryani region, and the airborne survey is complete – 5,775 line-km over 4,815 km². Over the nine months of 2026 it repurchased $24.2 million face value of the 2031 notes at an 11% discount. These steps reduce leverage, but uncertainty remains until the sale closes.
Valuation on the latest reported figures
| Metric | Value |
|---|---|
| Market cap | 0.34 bn USD |
| P/B | 1.47 |
| Operating cash flow (LTM) | 0.41 bn |
| ROE | -152.5% |
Net profit by quarter
| Period | Measure | bn USD |
|---|---|---|
| Q4 2024 | Net profit | −0.034210000000000004 |
| Q1 2025 | Net profit | −0.019280000000000002 |
| Q2 2025 | Net profit | −0.012740999999999999 |
| Q3 2025 | Net profit | −0.01995 |
| Q4 2025 | Net profit | −0.141148 |
| Q1 2026 | Net profit | −0.119172 |
| Q2 2026 | Net profit | 0.024861 |
| Q3 2026 | Net profit | −0.042415 |
Bottom line
The quarter's strong point remains the price: Brent rose 34.2%, and without quality and transport discounts revenue would have been notably higher. But the company left $88.4 million of EBITDA on the table versus what the price implied at year-ago volumes and costs – the gap is explained by lower output, wider discounts and higher Colombian costs. The $42.4 million loss came from non-cash items, yet even without them the operating economics are weak. The main case for the share is the $1.33 billion sale of the businesses with about $315 million net cash and the promise of becoming debt-free. Our verdict: the share is rather unattractive – EV/EBITDA of 6.9 at current prices offers no cushion, and without the sale closing the uncertainty is too great. Our view: the share is rather unattractive at the current price.