Warrior Met Coal: revenue up 54.6%, but deceleration and quarter-on-quarter profit decline demand attention
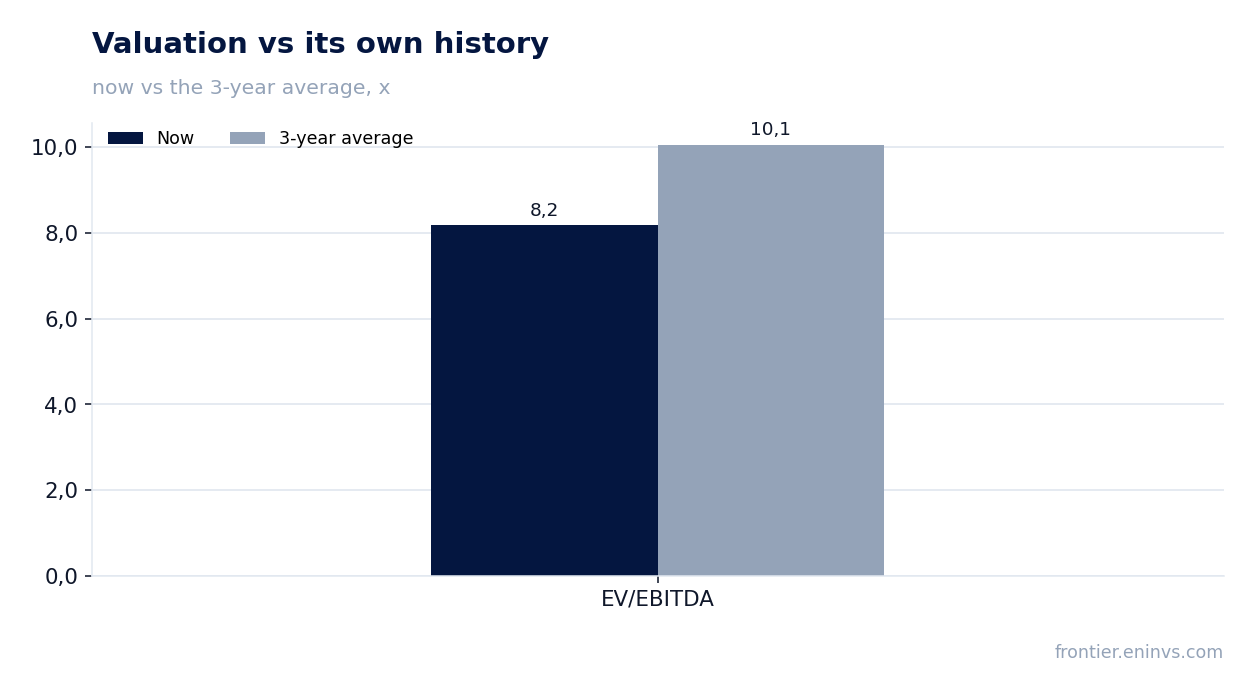
On November 4, Warrior Met Coal reported third-quarter 2026 results. Revenue came in at $507.9 million, up 54.6% year on year, EBITDA reached $118.9 million, and net profit was $49.3 million. Revenue growth decelerated from 71.3% in the second quarter, and net profit declined quarter on quarter. At an EV/EBITDA of 8.2 versus its own three-year average of 10.1, the stock looks cheaper than its history, but decelerating growth and quarter-on-quarter profit deterioration prevent calling it unequivocally attractive.
Key takeaways
— Revenue grew 54.6% year on year but decelerated from 71.3% in the second quarter
— EBITDA rose 84.9% year on year, yet the quarterly dynamics showed a decline
— Net profit increased 34.7% year on year but fell quarter on quarter
— Leverage is negative: net debt of -$0.2 billion, or -0.4x LTM EBITDA
— Operating cash flow of $166.0 million significantly exceeded EBITDA
— Trailing 12-month dividend yield is only 0.4%
— EV/EBITDA of 8.2 is below its own three-year average of 10.1, pointing to undervaluation
Attractiveness
Key figures, USD bn
| Metric | Q3 2025 | Q3 2026 | Change |
|---|---|---|---|
| Revenue | 0.33 | 0.51 | +54.6% |
| EBITDA | 0.06 | 0.12 | +84.9% |
| Operating profit | 0.02 | 0.05 | +145.1% |
| Net profit | 0.04 | 0.05 | +34.7% |
| Operating cash flow | 0.10 | 0.17 | +58.5% |
| Capex | 0.12 | — | — |
| EBITDA margin | 19.6% | 23.4% | +3.8 pp |
| Net margin | 11.1% | 9.7% | -1.4 pp |
Revenue grew 54.6% year on year but decelerated from 71.3% in the second quarter
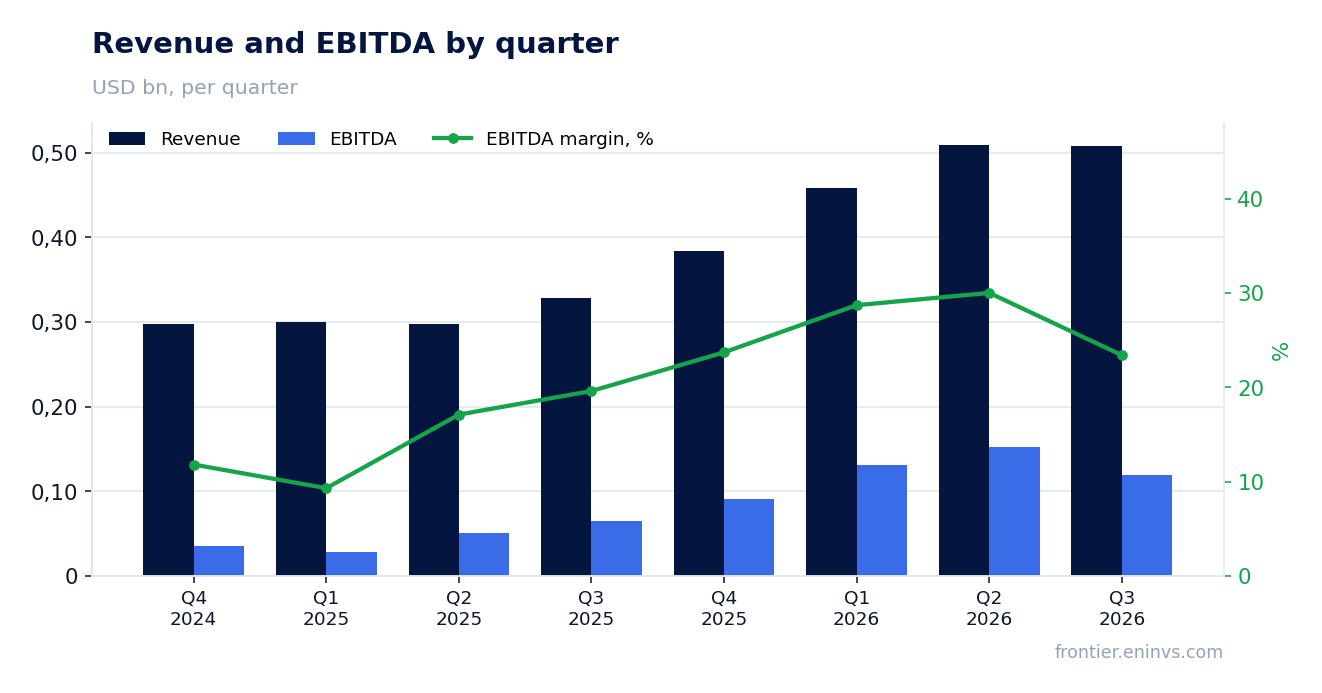
In the third quarter of 2026, revenue reached $507.9 million, up 54.6% from the same quarter last year. Growth remains high, but its pace decelerated from 71.3% in the second quarter. The deceleration occurs against a sequential decline in revenue from the previous quarter: in the second quarter it was $509.7 million.
The quarterly dynamics show that year-on-year growth relies on a low base from last year, when third-quarter 2025 revenue was only $328.6 million. The sequential comparison reveals stagnation: revenue was virtually unchanged from the second quarter of 2026.
To assess the sustainability of the trend, it is important to monitor whether annual growth persists in the absence of quarterly gains. If revenue remains at the current level, annual growth rates will gradually decelerate due to the base effect.
EBITDA rose 84.9% year on year, yet the quarterly dynamics showed a decline
EBITDA in the third quarter of 2026 was $118.9 million, up 84.9% from the same quarter last year. The EBITDA margin reached 23.4% versus 19.6% a year earlier. The margin improvement was driven by revenue growth and, likely, favorable pricing.
However, the sequential dynamics are negative: in the second quarter of 2026, EBITDA was $152.8 million, meaning the figure declined quarter on quarter. This suggests that the peak quarterly profitability may have passed.
The quarter-on-quarter decline in EBITDA, while maintaining a high annual base, creates a risk of further deceleration in annual growth rates. Margin sustainability will depend on coal prices and operational efficiency.
Net profit increased 34.7% year on year but fell quarter on quarter
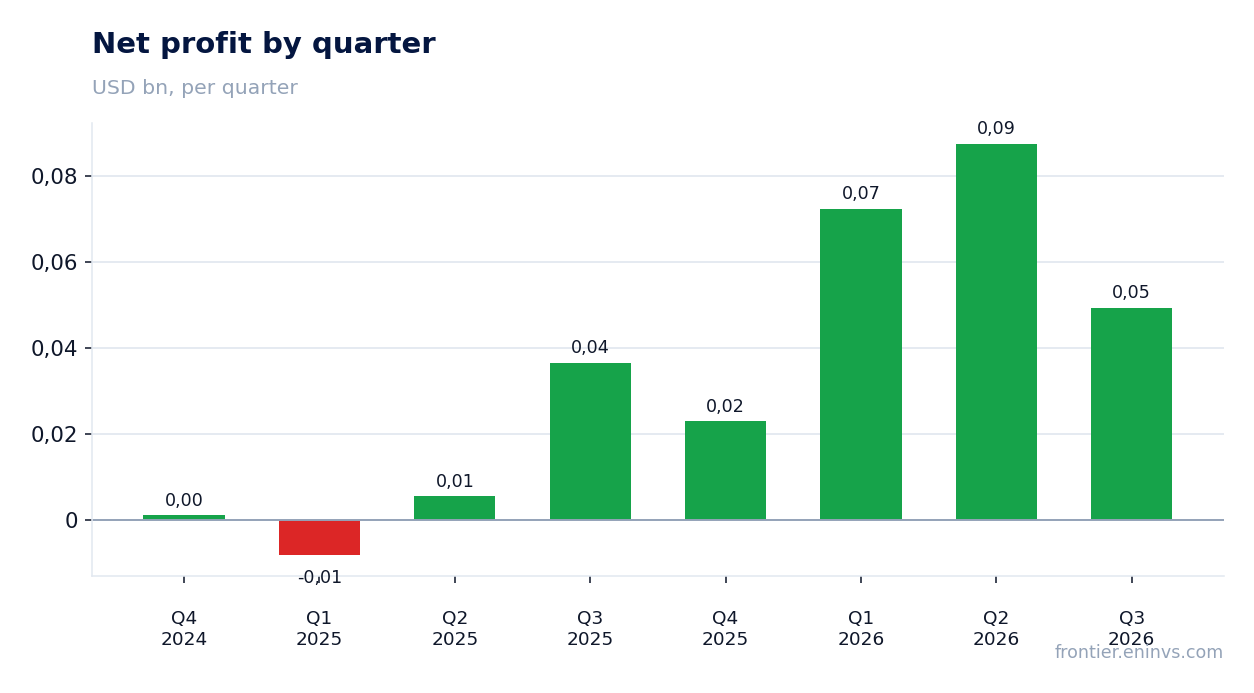
Net profit in the third quarter of 2026 was $49.3 million, up 34.7% from the same quarter last year. The net margin declined to 9.7% from 11.1% a year earlier, driven by faster growth in expenses or one-off factors.
Compared with the second quarter of 2026, when net profit was $87.4 million, the figure fell by more than a third. This reflects both the decline in EBITDA and a possible increase in tax or interest expenses.
Annual profit dynamics remain positive, but the quarterly deterioration signals pressure on profitability. For investors, it is important to understand whether this is temporary or the start of a new trend.
Leverage is negative: net debt of -$0.2 billion, or -0.4x LTM EBITDA
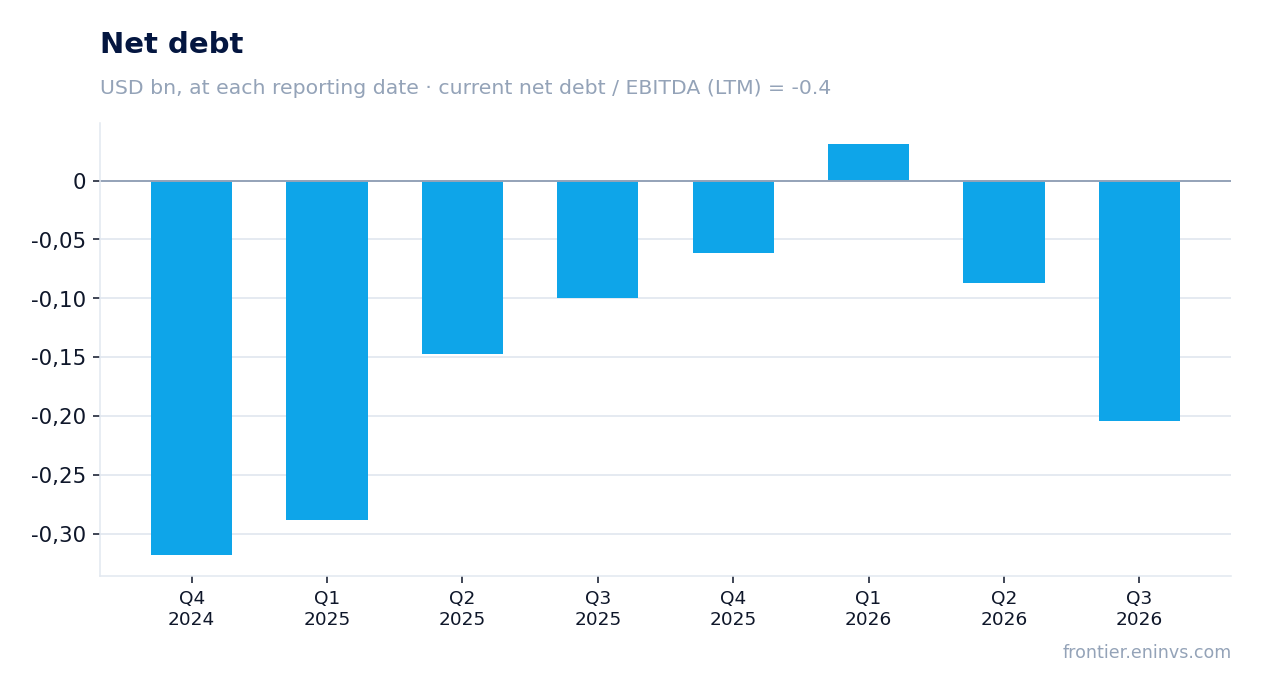
As of the end of the third quarter of 2026, the company's net debt was -$0.2 billion, meaning cash exceeds debt obligations. Compared with June 30, 2026, net debt changed from -$0.1 billion to -$0.2 billion. Relative to September 30, 2025, net debt also decreased from -$0.1 billion to -$0.2 billion.
The net debt to LTM EBITDA ratio is -0.4, reflecting a net cash position. A negative value indicates that the company has no debt burden and high liquidity.
Such financial stability gives the company the ability to invest in development or return capital to shareholders. However, negative leverage alone does not guarantee the attractiveness of the shares without considering other factors.
Operating cash flow of $166.0 million significantly exceeded EBITDA
Operating cash flow in the third quarter of 2026 was $166.0 million, higher than EBITDA for the same period. This may be due to changes in working capital or other non-cash items.
Over the trailing twelve months, operating cash flow was $362.7 million. Capital expenditures in the third quarter are not disclosed, but in previous periods they were significant: for example, $28.9 million in the second quarter of 2026.
Strong cash flow supports the company's financial flexibility and allows it to fund investments without raising debt. However, the sustainability of the flow depends on product prices and operational efficiency.
Trailing 12-month dividend yield is only 0.4%
The trailing 12-month dividend yield is 0.4%, which is a low figure. The company pays dividends, but their size is insignificant relative to the share price.
Our estimate for the current year's dividend is based on a conservative approach: with current profit and payout ratio, the yield is unlikely to significantly exceed the historical level. A key factor is the company's profit distribution policy.
For income-oriented investors, the stock is unlikely to be of interest. However, the low dividend yield may be offset by capital appreciation potential.
EV/EBITDA of 8.2 is below its own three-year average of 10.1, pointing to undervaluation
The trailing 12-month EV/EBITDA multiple is 8.2, which is 19% below its own three-year average of 10.1. This means the stock is trading cheaper than its average over the past three years.
The lower multiple may be due to decelerating growth in profit and revenue, as well as a general decline in coal prices. However, according to the portal's model, which reprices EBITDA at current commodity prices at the target EV/EBITDA, the upside to fair value is estimated at +23%.
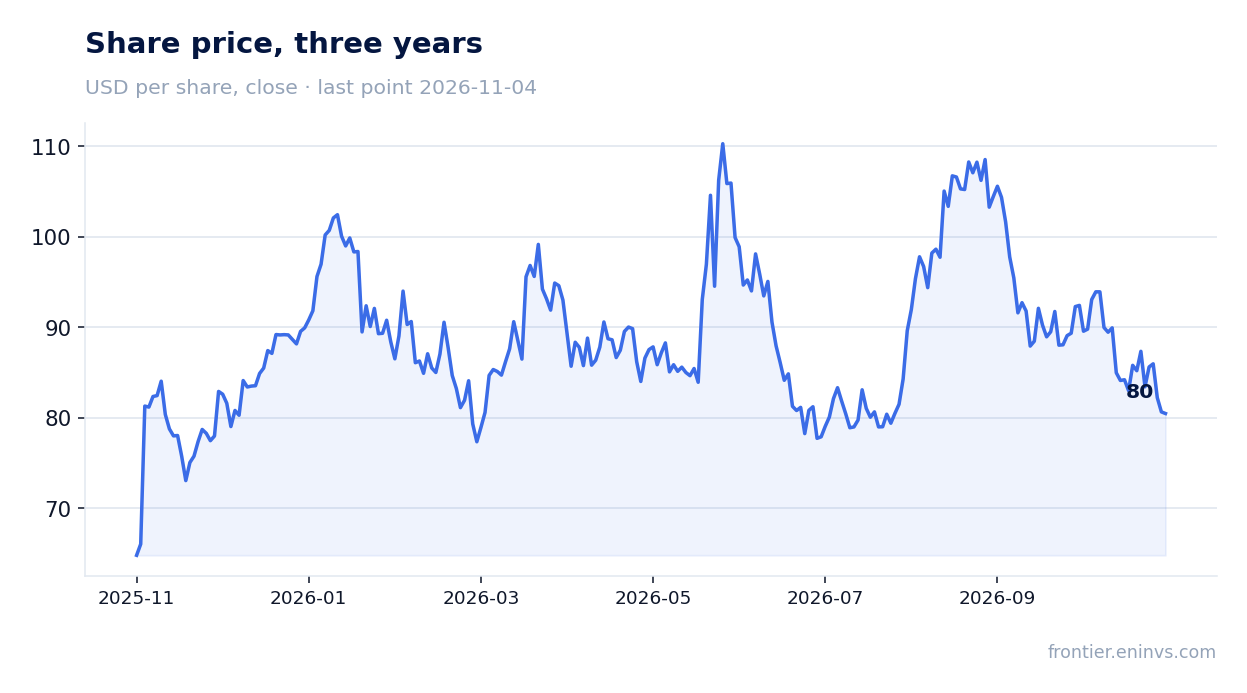
The market, judging by the share price reaction, showed no enthusiasm: on the day the report was published, the share fell 0.2%, and from the publication to November 4, it also fell 0.2%. This indicates that investors may have expected stronger results.
Valuation on the latest reported figures
| Metric | Value |
|---|---|
| Market cap | 4.25 bn USD |
| P/E (LTM) | 18.3 |
| EV/EBITDA (LTM) | 8.2 |
| P/B | 1.98 |
| Net debt / EBITDA (LTM) | -0.40 |
| Operating cash flow (LTM) | 0.36 bn |
| ROE | 8.5% |
| Dividend yield (12m) | 0.4% |
| EV/EBITDA, 3-year average | 10.1 |
Bottom line
The report's strengths remain high annual revenue and EBITDA growth, as well as a net cash position. However, decelerating growth and quarter-on-quarter profit decline point to a possible loss of momentum. Valuation at an EV/EBITDA below its historical average and the portal model's upside suggest undervaluation, but low dividend yield and uncertainty in the coal market limit attractiveness. Verdict – neutral: the stock does not appear clearly undervalued given the risks.
Open the company's financial profile HCC →
See also: market overview · valuation map · stock screeners