Hecla Mining Company: profit up 48.5% on a 3.6% revenue decline – margin did all the work
On 4 November Hecla Mining Company reported results for the third quarter of 2026. Revenue came in at USD 394.8 million, down 3.6% year on year, EBITDA at USD 196.4 million (-0.8%), and net profit at USD 149.6 million (+48.5%). Profit grew not on sales but on margin: the EBITDA margin rose to 49.7% from 48.4%, and the net margin to 37.9% from 24.6%. At the current price the share looks attractive: the EV/EBITDA multiple of 10.2 is roughly half its own three-year average of 19.1, and a net cash position of USD 684.5 million underpins both the dividend and resilience to metal prices.
Key takeaways
— Revenue fell 3.6% year on year, and the deceleration from 9.8% in the second quarter shows that price no longer pulls sales upward
— Profit rose 48.5% on falling revenue because the EBITDA margin climbed to 49.7% from 48.4% and the net margin to 37.9% from 24.6%
— Operating cash flow of USD 203.0 million covered capital expenditure of USD 51.7 million almost four times over
— Net cash rose from USD 0.1 billion on 30 September 2025 to USD 0.7 billion on 30 September 2026, and net debt to EBITDA stands at -0.69
— A dividend yield of 0.11% barely affects total return, so the payout remains symbolic rather than a driver
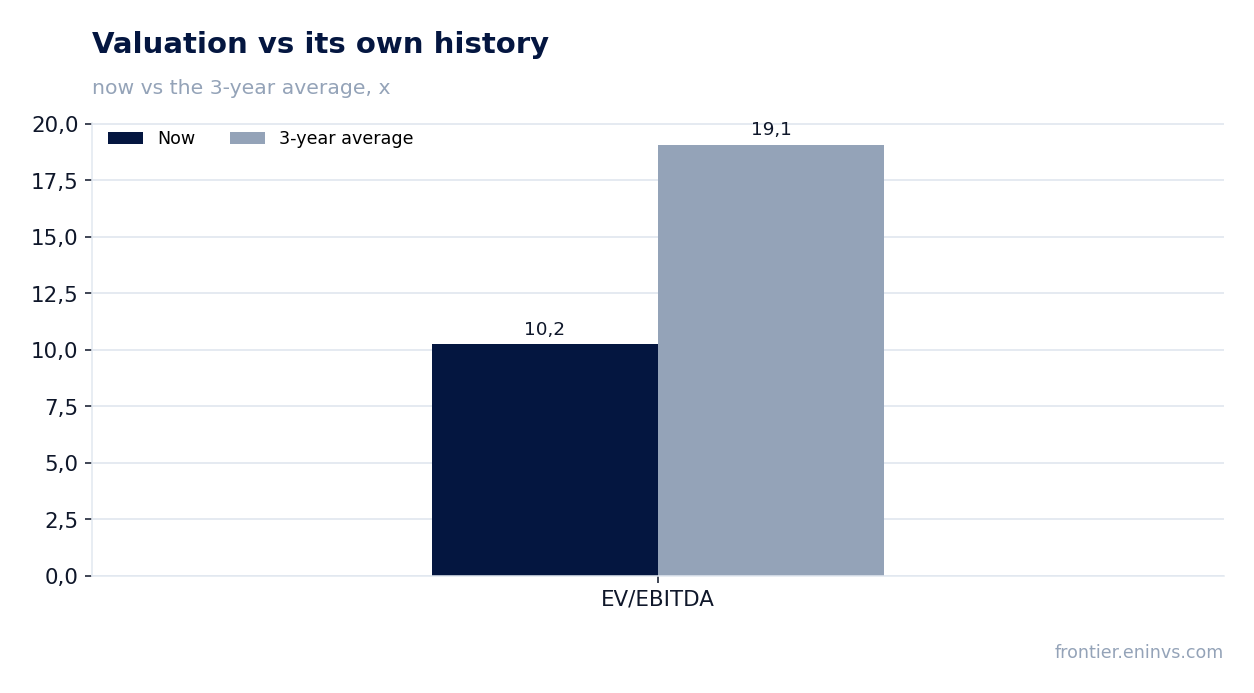
— EV/EBITDA of 10.2 against its own three-year average of 19.1 – the share trades at half its own history on this multiple
— The portal model puts fair value 39% below the market, and that is the main counterargument to the cheap multiple
Attractiveness
Key figures, USD bn
| Metric | Q3 2025 | Q3 2026 | Change |
|---|---|---|---|
| Revenue | 0.41 | 0.39 | -3.6% |
| EBITDA | 0.20 | 0.20 | -0.8% |
| Operating profit | 0.15 | 0.16 | +5.7% |
| Net profit | 0.10 | 0.15 | +48.5% |
| Operating cash flow | 0.15 | 0.20 | +37.1% |
| Capex | 0.06 | 0.05 | -10.7% |
| EBITDA margin | 48.4% | 49.7% | +1.3 pp |
| Net margin | 24.6% | 37.9% | +13.3 pp |
Revenue fell 3.6% year on year, and the deceleration from 9.8% in the second quarter shows that price no longer pulls sales upward
In the third quarter of 2026 revenue came to USD 394.8 million, 3.6% less than a year earlier. This is the first annual decline in recent quarters: sales grew 9.8% in the second quarter and 100.4% in the first. The deceleration from 9.8% to -3.6% means that the high metal prices that drove revenue in 2025 no longer deliver growth in the annual comparison.
The revenue decline is not accompanied by a fall in output in the reporting – the facts contain no volume data. Only the result is visible: dollar sales shrank, and that limits the scope for further profit growth from the top line. The next quarter will show whether this was a one-off price shift or the start of a longer plateau.
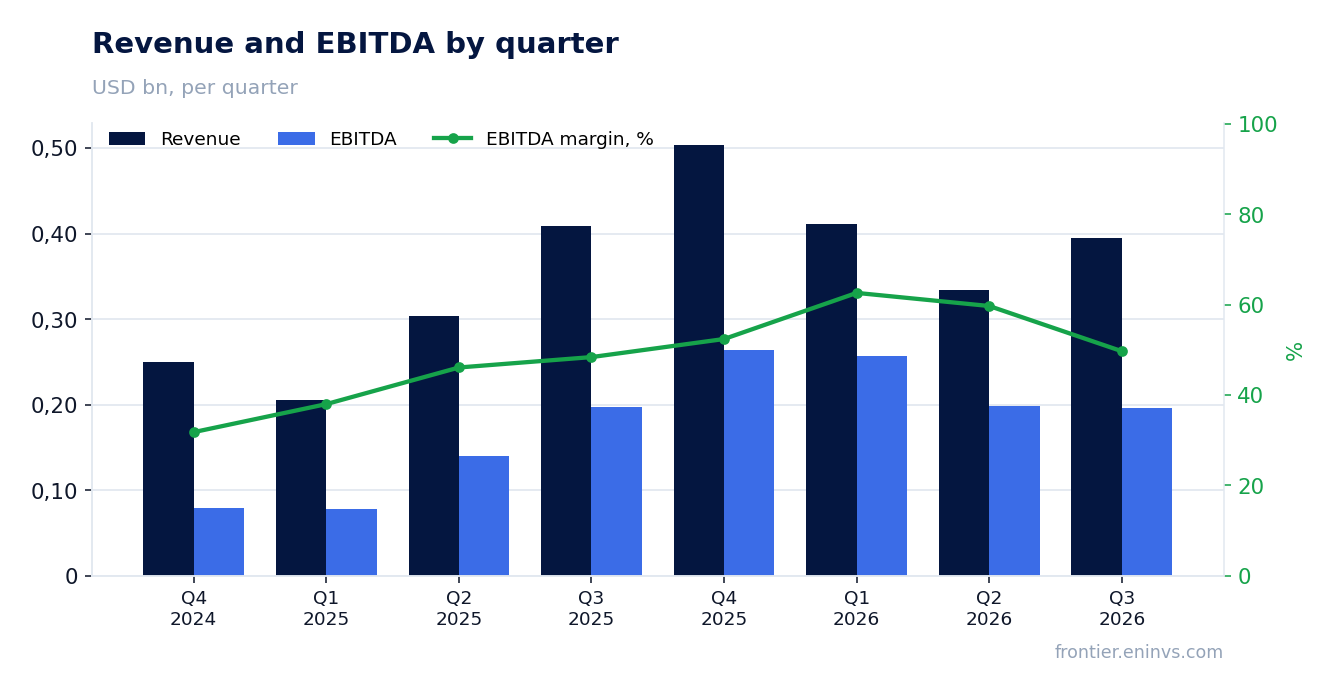
Profit rose 48.5% on falling revenue because the EBITDA margin climbed to 49.7% from 48.4% and the net margin to 37.9% from 24.6%
EBITDA for the third quarter was USD 196.4 million, 0.8% less than a year earlier – essentially unchanged despite a 3.6% revenue decline. The EBITDA margin rose to 49.7% from 48.4%: the company kept almost half of revenue at the operating level, and that is the key reason profit did not follow sales down.
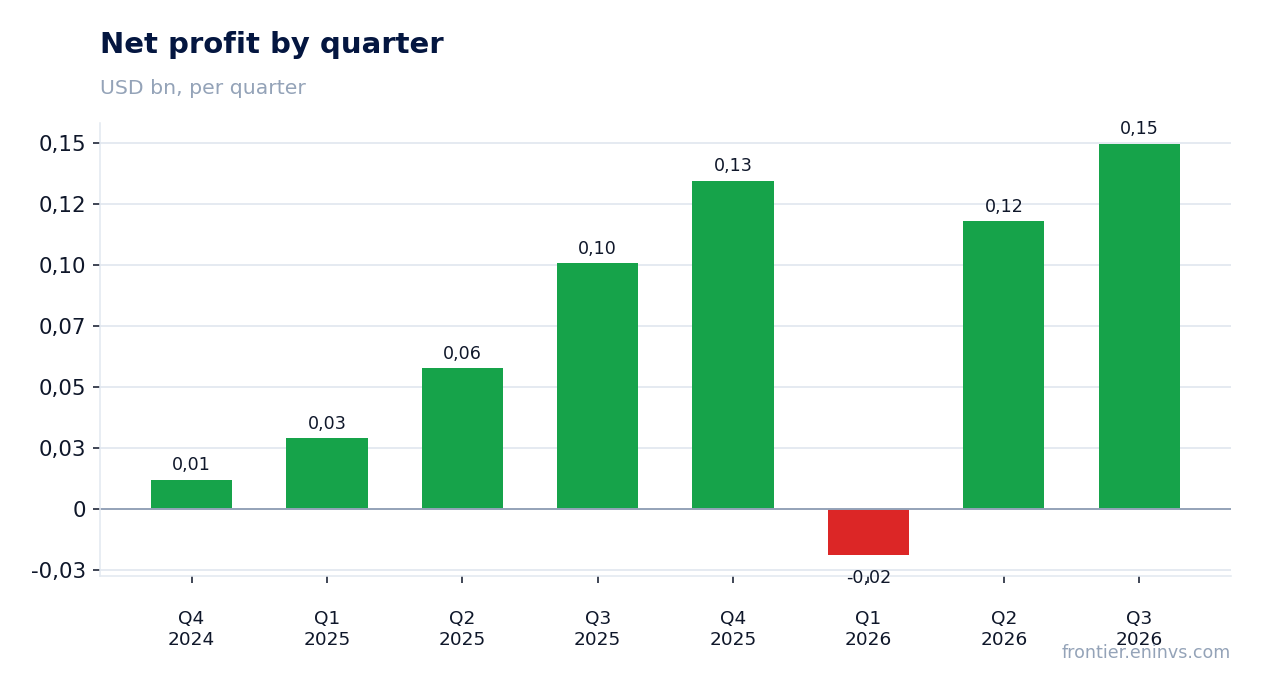
Net profit rose 48.5% to USD 149.6 million, and the net margin climbed to 37.9% from 24.6%. Such a gap between EBITDA and net profit dynamics means that some line below the operating result improved – interest expense, taxes or FX. The facts do not disclose the cause, so we state only what moved: profit grew faster than the operating result.
Operating profit was USD 157.2 million on revenue of USD 394.8 million. The gap between operating profit and EBITDA – USD 39.2 million – is depreciation, and it does not prevent the company from generating cash flow. For a holder what matters is that the margin holds above 49%: if metal prices do not fall, profit will stay high even on weak revenue.
Operating cash flow of USD 203.0 million covered capital expenditure of USD 51.7 million almost four times over
Operating cash flow for the third quarter was USD 203.0 million, capital expenditure USD 51.7 million. Free cash flow before dividends and interest therefore exceeds USD 150 million – more than a third of revenue, a very high figure for a mining company.
Capex rose from USD 39.1 million in the second quarter but remains moderate relative to EBITDA. The company spends less than half of operating cash flow on development, which explains why the net cash position keeps growing. Over the trailing twelve months operating cash flow was USD 789.2 million on revenue of USD 1600.0 million – almost half of sales turns into cash before investment.
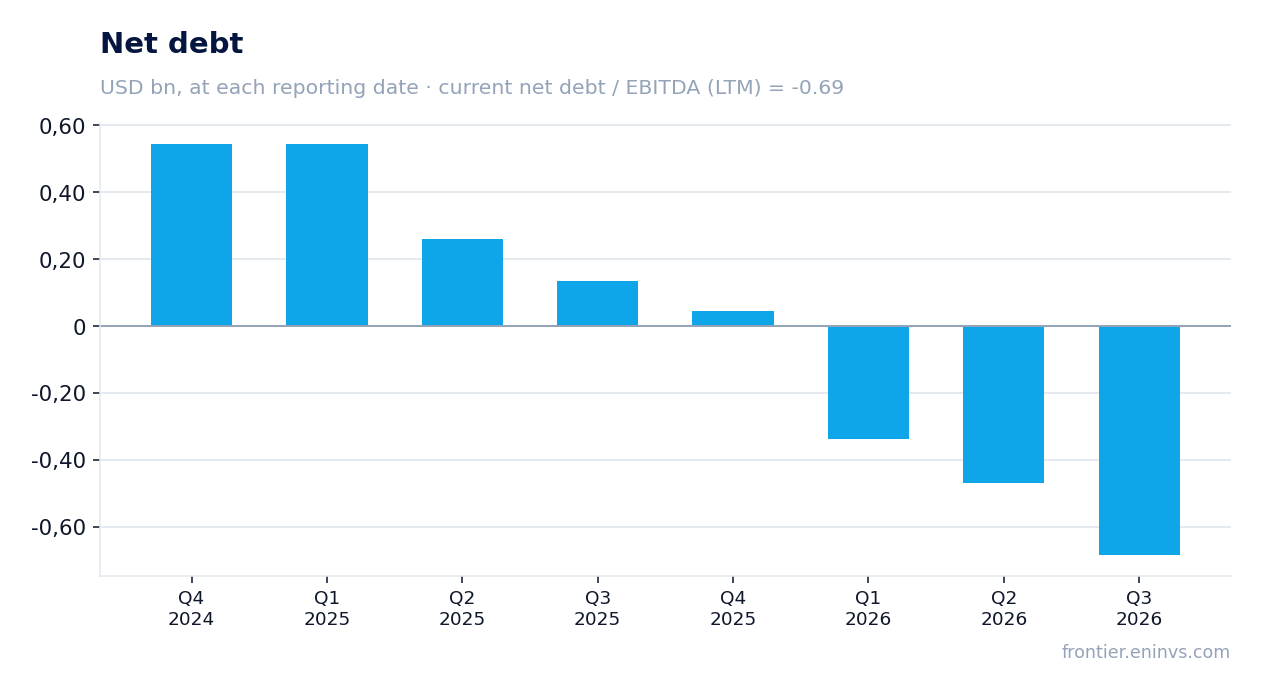
Net cash rose from USD 0.1 billion on 30 September 2025 to USD 0.7 billion on 30 September 2026, and net debt to EBITDA stands at -0.69
As of 30 September 2026 net debt was negative – minus USD 684.5 million, meaning cash exceeds debt. A year earlier, on 30 September 2025, the figure was USD 0.1 billion, and on 30 June 2026 it was minus USD 0.5 billion. Over the year net debt fell by USD 0.8 billion, over the quarter by USD 0.2 billion.
Net debt to EBITDA over the trailing twelve months stands at -0.69. A negative value means the company has more cash than debt, a rare situation for the sector. The facts do not give the prior value of the ratio, so we do not judge the direction of change – we state the level only.
Such a cushion matters for dividend policy and for resilience if metal prices fall. The company can fund capex from cash flow while preserving its cash position. For credit quality this is a strength; for the shareholder it is an argument that the dividend will not be cut because of debt.
A dividend yield of 0.11% barely affects total return, so the payout remains symbolic rather than a driver
The trailing twelve-month dividend yield is 0.11% – with a market capitalisation of USD 10.1 billion that is about USD 11 million of payouts. For a company with net profit of USD 382.9 million over the trailing twelve months such a payment is symbolic: the payout ratio is in the single digits, and almost all profit stays in the business.
Our estimate for the current year is that the payment stays at the same level, since it is set by company policy rather than by profit, and the facts contain no data on a revision. A yield of 0.11% is not comparable with the key rate and is not a reason to hold the share. The payout would shrink only on a policy change or a sharp fall in profit, which is not visible yet.
EV/EBITDA of 10.2 against its own three-year average of 19.1 – the share trades at half its own history on this multiple
EV/EBITDA over the trailing twelve months is 10.2 against its own three-year average of 19.1 – 46% below. That means the market values the company's current EBITDA at almost half its average over the past three years. The reason may lie in the revenue decline and in expectations for metal prices, but on the multiple itself the share is cheap relative to its own history.
P/E over the trailing twelve months is 26.3, which looks moderate given net profit of USD 382.9 million and a market capitalisation of USD 10.1 billion. Return on equity is 21.8%, which supports the valuation. However, the cheap EV/EBITDA may be a consequence of a high EBITDA level that will not hold if metal prices fall.
The portal model puts fair value 39% below the market, and that is the main counterargument to the cheap multiple
On the portal model, which reprices EBITDA at current commodity prices and the target EV/EBITDA, fair value is 39% below the current market price. That means at current metal prices the market is paying more than the business is worth on our model. The result is consistent with revenue already declining while profit holds on margin.
The gap between the cheap multiple and the negative model upside is simple to explain: the model uses current commodity prices, while the market may be pricing in their growth. If metal prices stay at the current level, the model's valuation is closer to reality. If they rise, the current price is justified.
Valuation on the latest reported figures
| Metric | Value |
|---|---|
| Market cap | 10.1 bn USD |
| P/E (LTM) | 26.3 |
| EV/EBITDA (LTM) | 10.2 |
| P/B | 3.89 |
| Net debt / EBITDA (LTM) | -0.69 |
| Operating cash flow (LTM) | 0.79 bn |
| ROE | 21.8% |
| Dividend yield (12m) | 0.1% |
| EV/EBITDA, 3-year average | 19.1 |
Bottom line
The strength of the report was margin: with revenue down 3.6%, EBITDA was almost unchanged, and net profit rose 48.5% as the net margin climbed to 37.9% from 24.6%. Cash flow of USD 203.0 million covered capital expenditure of USD 51.7 million almost four times over, and net cash reached USD 684.5 million. The weak spot is the top line: the deceleration from 9.8% in the second quarter to -3.6% in the third shows that the price factor is exhausted. A cheap EV/EBITDA of 10.2 against a three-year average of 19.1 is an argument for the share, but the portal model's -39% upside is a reminder that the margin may not hold. The verdict is attractive at the current price, with a caveat on metal prices.
Open the company's financial profile HL →
See also: market overview · valuation map · stock screeners