Houston American Energy: revenue quadrupled, but losses and debt consumed the entire gain
On August 25, Houston American Energy released its second-quarter 2026 results. Revenue grew 304.4% year-on-year to $1.96 million, but EBITDA remained negative at -$3.32 million, and the net loss was $3.46 million. The company remains unprofitable, debt rose to $16.0 million, and the market capitalisation of $21.4 million does not cover liabilities. At the current price, the share looks unattractive: revenue growth is not accompanied by improved profitability, and debt burden continues to rise.
Key takeaways
— Revenue quadrupled, but this did not help achieve positive EBITDA
— Operating loss remains almost unchanged from a year ago despite sales growth
— Debt rose to $16.0 million, comparable to market capitalisation
— Operating cash flow over the last 12 months is negative at -$8.1 million
— The company is burning cash: capital expenditures in Q2 were $4.14 million
— EBITDA margin improved but remains deeply negative
— Profitability is in question: ROE at -43.4%
Attractiveness
Key figures, USD bn
| Metric | Q2 2025 | Q2 2026 | Change |
|---|---|---|---|
| Revenue | 0.00 | 0.00 | +304.4% |
| EBITDA | -0.00 | -0.00 | — |
| Operating profit | -0.00 | -0.00 | — |
| Net profit | -0.00 | -0.00 | — |
| Operating cash flow | -0.00 | 0.00 | to profit |
| Capex | — | 0.00 | — |
| EBITDA margin | -385.4% | -169.9% | +215.5 pp |
| Net margin | -401.3% | -176.8% | +224.5 pp |
Revenue quadrupled, but this did not help achieve positive EBITDA
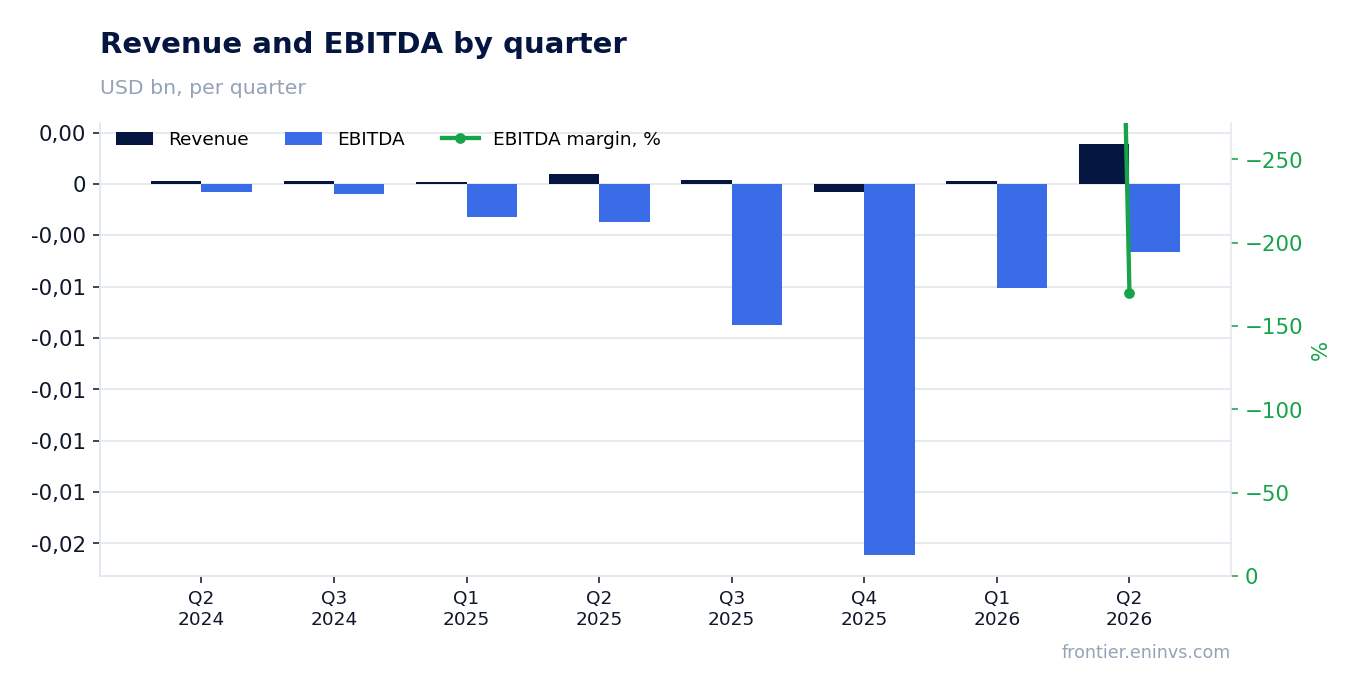
In the second quarter of 2026, revenue reached $1.96 million, up 304.4% year-on-year. For comparison, in Q1 2026 revenue was only $0.13 million, and in Q4 2025 it was negative at -$0.4 million. Such a sharp increase is likely due to production recovery or one-off deliveries, but without management commentary the source remains unclear.
Despite revenue growth, EBITDA remained negative at -$3.32 million. A year earlier, the EBITDA loss was larger at -$1.87 million, but revenue was also several times smaller. Now, with revenue of nearly $2 million, the loss has narrowed but still exceeds revenue. This means operating expenses continue to significantly outpace income.
Operating loss remains almost unchanged from a year ago despite sales growth
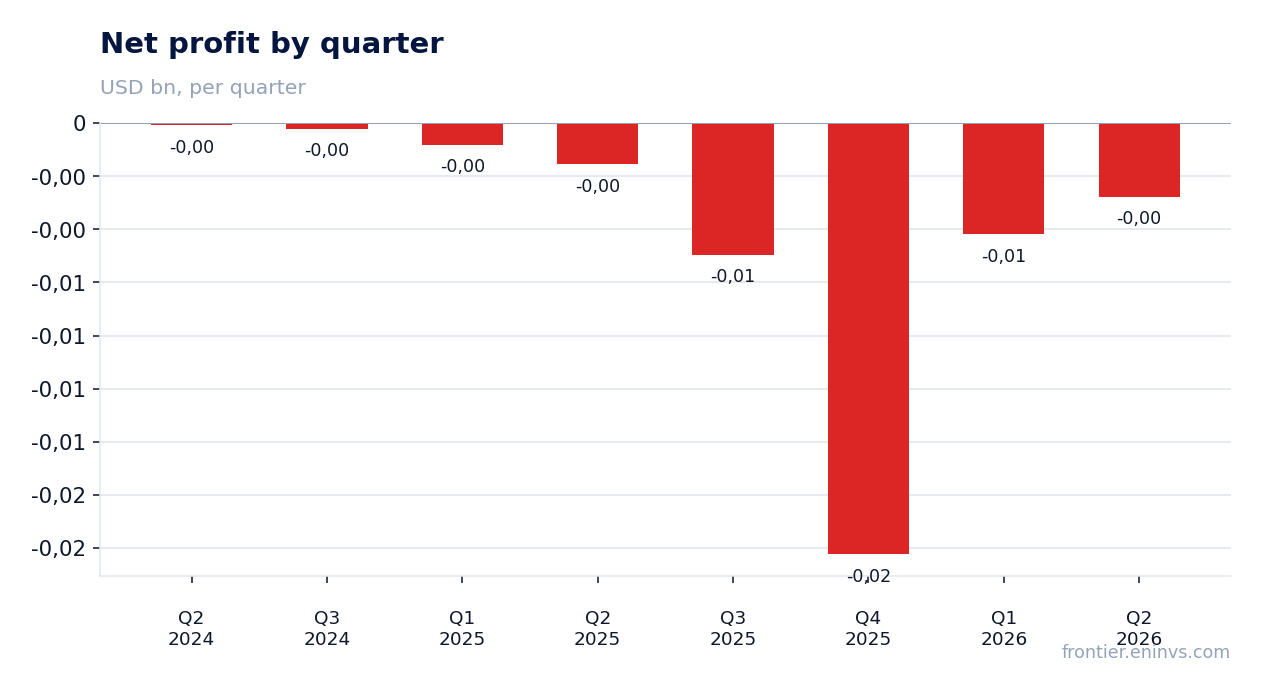
Operating loss in Q2 2026 was $3.37 million, only slightly less than $3.37 million a year earlier. Meanwhile, revenue quadrupled. This suggests that sales growth did not lead to a proportional reduction in operating expenses – they may have increased with volumes or remained flat.
Net loss also remained significant at $3.46 million versus $1.94 million a year earlier. The loss widened despite revenue growth, which may be due to higher interest expenses or other non-operating items. Without detailed reporting, the exact cause is unclear, but the fact remains: the company has not moved closer to break-even.
Debt rose to $16.0 million, comparable to market capitalisation
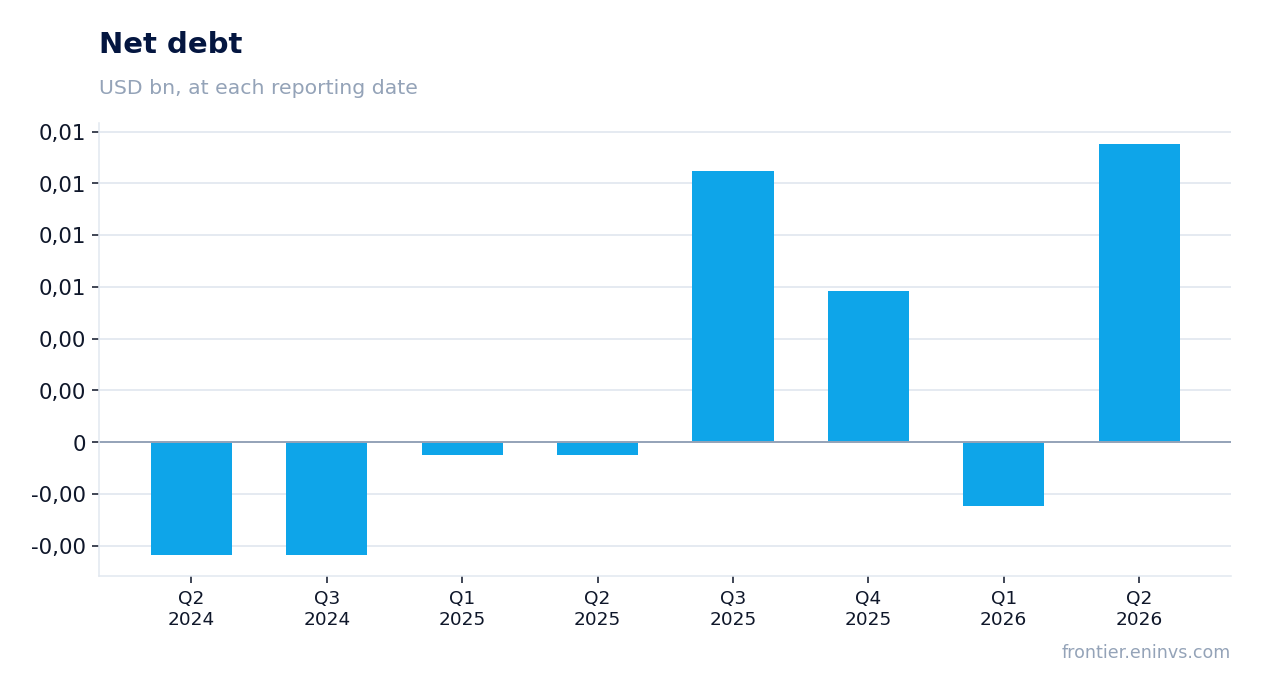
Net debt at the end of Q2 2026 was $16.0 million, significantly higher than $0.5 million a year earlier. Such debt growth, with a market capitalisation of $21.4 million, means debt burden is almost equal to the company's value. This creates serious risks for shareholders, especially if operating cash flow remains negative.
The debt increase occurred against the backdrop of negative operating cash flow over the last 12 months at -$8.1 million. The company is financing its operations with borrowed funds, which can only be sustainable with a near-term return to positive cash flow. So far, this is not happening, and debt will continue to grow.
Operating cash flow over the last 12 months is negative at -$8.1 million
Over the last 12 months, operating cash flow was -$8.1 million. This means the company does not generate enough funds to cover its operating expenses. In Q2 2026, operating cash flow was positive at $1.46 million, but this is insufficient to offset outflows in previous quarters.
Negative cash flow forces the company to raise debt or sell assets. In Q1 2026, the outflow was $3.76 million, and in Q4 2025, it was $3.45 million. This dynamic indicates a chronic liquidity shortage, increasing the risk of further debt growth.
The company is burning cash: capital expenditures in Q2 were $4.14 million
Capital expenditures in Q2 2026 reached $4.14 million, more than double revenue for the same period. This means the company is actively investing in fixed assets, likely in drilling or field development. However, such investments in the absence of profit create additional balance sheet pressure.
For comparison, in Q1 2026, capital expenditures were $1.67 million. The increase in investments may be related to plans to boost production, but without positive operating cash flow, they are financed by debt. If investments do not lead to rapid revenue and profit growth, the financial position may deteriorate.
EBITDA margin improved but remains deeply negative
EBITDA margin in Q2 2026 was -169.9%, better than -385.4% a year earlier. The improvement is due to revenue growth, which outpaced the loss. However, negative margin means every dollar of revenue brings a loss, not a profit.
Net margin also improved from -401.3% to -176.8%. Despite positive dynamics, the company is still far from break-even. To turn profitable, it needs either significantly higher revenue or sharply lower costs. Neither is currently observed.
Profitability is in question: ROE at -43.4%
Return on equity (ROE) is -43.4%, reflecting the company's losses and low capital efficiency. Negative ROE means shareholders are losing money on their investments. With a market capitalisation of $21.4 million and negative equity, the situation may worsen.
For investors, this signals that the company is not creating value. Even if revenue continues to grow, without positive profit, ROE will remain negative. Restoring profitability would require either significantly higher product prices or cost reductions, which seems unlikely in the current environment.
Valuation on the latest reported figures
| Metric | Value |
|---|---|
| Market cap | 0.02 bn USD |
| P/B | 1.13 |
| Operating cash flow (LTM) | -0.01 bn |
| ROE | -43.4% |
Bottom line
Bottom line: in Q2 2026, Houston American Energy showed a sharp revenue increase of 304.4%, but this did not lead to improved profitability. Losses remain significant, debt rose to $16.0 million, and operating cash flow over the last 12 months is negative. The company is burning cash and financing itself with debt, creating high risks for shareholders. At the current price, the share looks unattractive.
Open the company's financial profile HUSA →
See also: market overview · valuation map · stock screeners