Houston American Energy: revenue up 11.6-fold, but the loss and $25.1m net debt remain
Contents
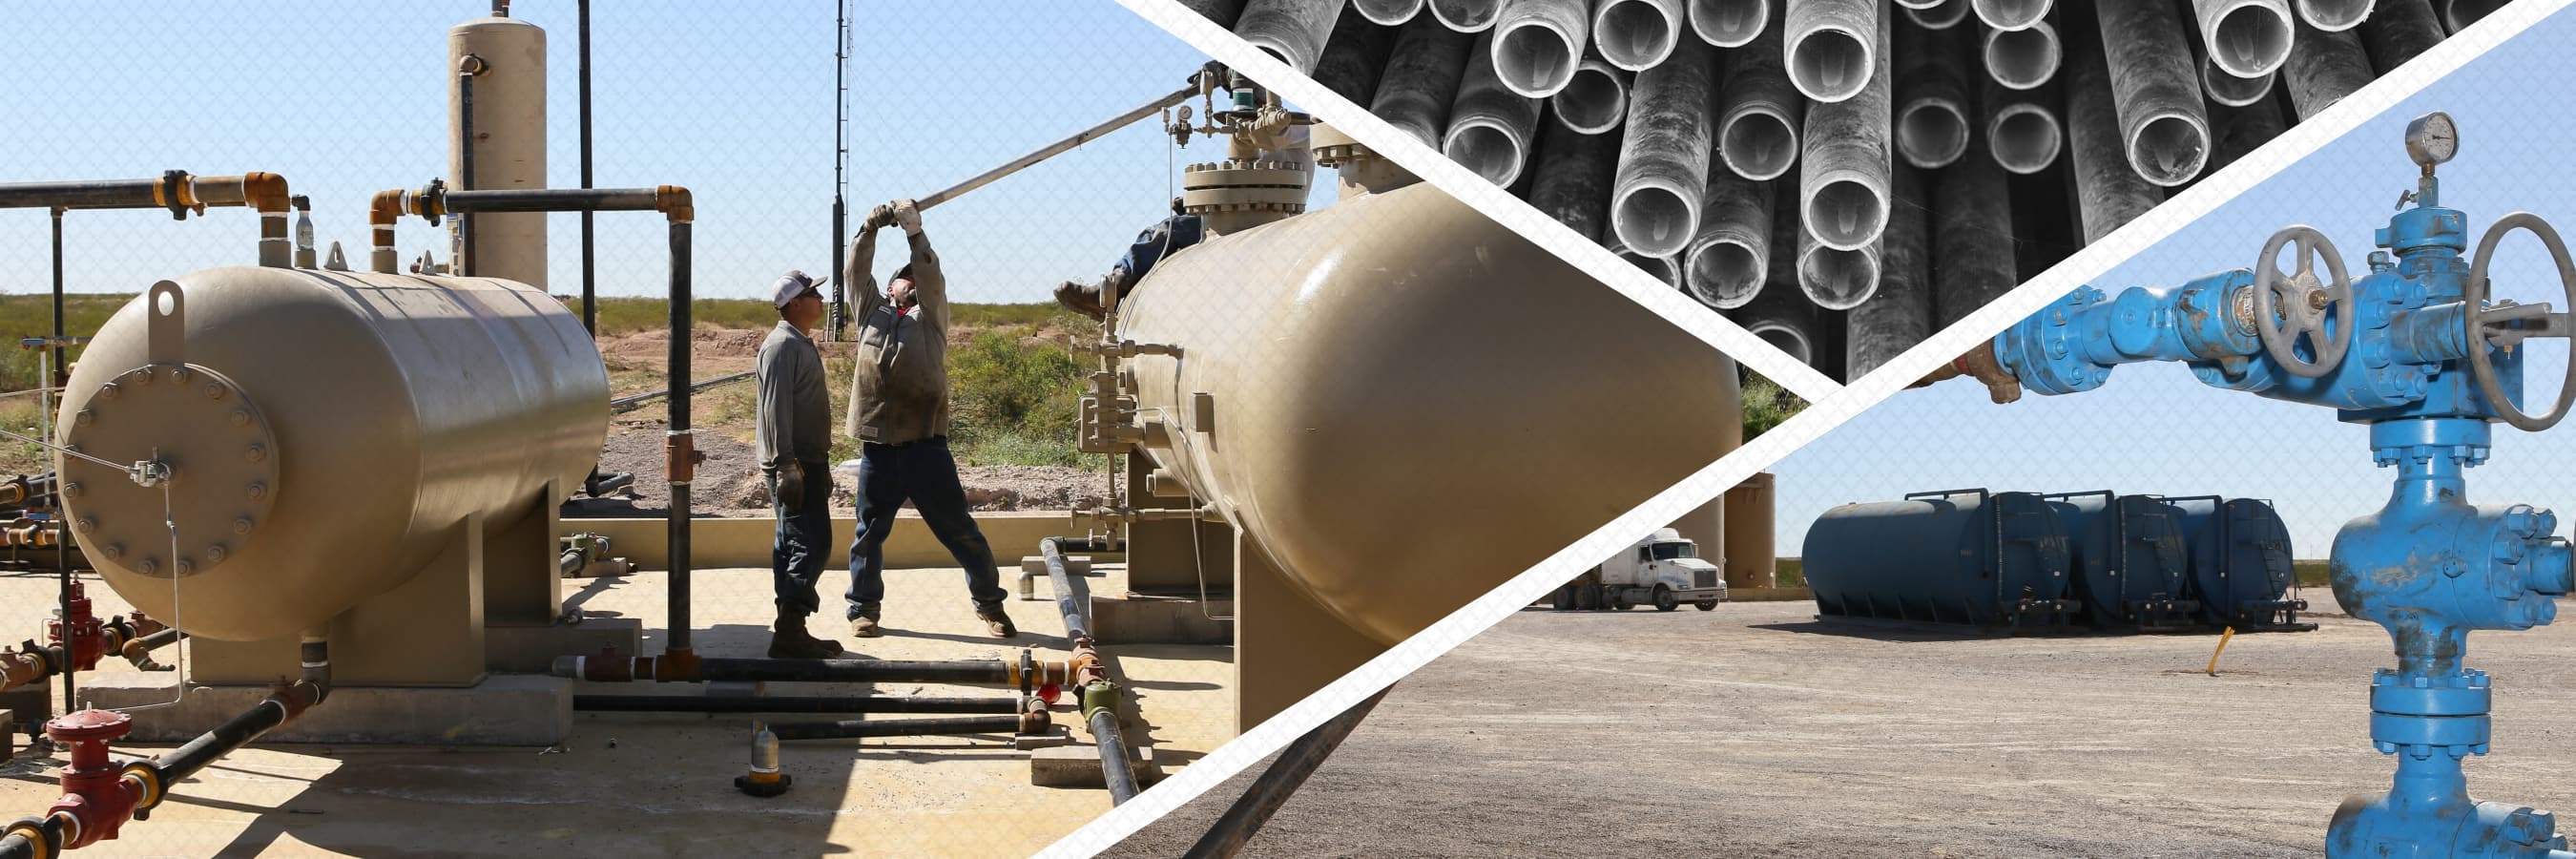
On 25 November Houston American Energy released its third-quarter 2026 results. Revenue came in at $2.32m, up 1062.1% year on year, EBITDA was -$3.32m, net loss -$3.61m, and net debt at the end of September stood at $25.10m. Revenue growth accelerated from +304.4% in the second quarter, but the company remains loss-making and operating cash flow in the reported quarter was negative at -$6.63m. Our conclusion: the share is rather unattractive – with a market capitalisation of $35.70m, net debt equals 70% of market cap, and a negative EBITDA leaves no multiple to lean on. Our view: the share is rather unattractive at the current price.
Our view: is there upside
Our view in numbers
| Metric | Our read |
|---|---|
| Verdict | Rather unattractive |
| Upside on the portal model | no portal model for this share |
| Strongest case for | Revenue grew 11.6-fold to $2.32m, and growth accelerated from the second quarter (+304.4%). |
| Strongest case against | Net debt of $25.10m equals 70% of market cap, and EBITDA is negative (-$3.32m), which does not allow debt to be serviced from operating profit. |
| What would change the view | The verdict would improve if EBITDA turned positive and operating cash flow turned positive – this would require either multiple-fold revenue growth or cost reduction. |
Key takeaways
— Revenue of $2.32m grew 11.6-fold, but that is not enough to cover a $3.61m loss
— EBITDA of -$3.32m on revenue of $2.32m gives a -143.0% margin, and revenue growth has not reversed it yet
— Operating cash flow of -$6.63m against capex of $2.43m – the quarter burned more than it brought in
— Net debt of $25.10m versus a $35.70m market cap – leverage consumes most of the equity value
— Return on equity of -18.2% – shareholder capital is working at a loss, not a profit
Key figures, USD bn
| Metric | Q3 2025 | Q3 2026 | Change |
|---|---|---|---|
| Revenue | 0.00 | 0.00 | +1062.1% |
| EBITDA | -0.02 | -0.00 | — |
| Operating profit | -0.02 | -0.00 | — |
| Net profit | -0.02 | -0.00 | — |
| Operating cash flow | -0.00 | -0.01 | — |
| Capex | 0.01 | 0.00 | -71.2% |
| EBITDA margin | -10325.6% | -143.0% | +10182.6 pp |
| Net margin | -10529.8% | -155.2% | +10374.6 pp |
Revenue of $2.32m grew 11.6-fold, but that is not enough to cover a $3.61m loss
Revenue for the third quarter of 2026 was $2.32m versus $0.2m a year earlier – growth of 1062.1%. Relative to the second quarter, when revenue was $1.96m, growth accelerated: the year-on-year rate in the second quarter was 304.4%. This is the best quarterly result in the company's available history and confirms that the business is gaining scale.
However, the absolute scale of revenue remains small. With revenue of $2.32m, the net loss was $3.61m – meaning costs and expenses are more than one and a half times revenue. Revenue growth alone does not solve the loss-making problem while operating costs outpace income.
Revenue and EBITDA by quarter
| Period | Measure | bn USD |
|---|---|---|
| Q3 2024 | Revenue | 0.00013023899999999998 |
| Q1 2025 | Revenue | 0.00010234500000000001 |
| Q2 2025 | Revenue | 0.000483627 |
| Q3 2025 | Revenue | 0.0002 |
| Q4 2025 | Revenue | −0.0004 |
| Q1 2026 | Revenue | 0.000132965 |
| Q2 2026 | Revenue | 0.001955768 |
| Q3 2026 | Revenue | 0.002324169 |
| Q3 2024 | EBITDA | −0.000504729 |
| Q1 2025 | EBITDA | −0.0015999669999999999 |
| Q2 2025 | EBITDA | −0.001868376 |
| Q3 2025 | EBITDA | −0.020651108999999997 |
| Q4 2025 | EBITDA | −0.004418999999999999 |
| Q1 2026 | EBITDA | −0.005067964 |
| Q2 2026 | EBITDA | −0.00332235 |
| Q3 2026 | EBITDA | −0.003323358 |
EBITDA margin
| Period | Measure | % |
|---|---|---|
| Q3 2024 | EBITDA margin | −387.5 |
| Q1 2025 | EBITDA margin | −1563.3 |
| Q2 2025 | EBITDA margin | −386.3 |
| Q3 2025 | EBITDA margin | −10325.6 |
| Q4 2025 | EBITDA margin | — |
| Q1 2026 | EBITDA margin | −3811.5 |
| Q2 2026 | EBITDA margin | −169.9 |
| Q3 2026 | EBITDA margin | −143.0 |
EBITDA of -$3.32m on revenue of $2.32m gives a -143.0% margin, and revenue growth has not reversed it yet
EBITDA in the third quarter of 2026 was -$3.32m, and operating profit was -$3.39m. On revenue of $2.32m, that gives an EBITDA margin of -143.0%. A year earlier the margin was -10325.6% – revenue was only $0.2m against EBITDA of -$20.65m, and that extreme value reflects a one-off charge. The EBITDA loss is now smaller in absolute terms but still exceeds revenue.
Revenue growth of 11.6-fold did not produce positive EBITDA because operating expenses remain high. The company has not yet reached the revenue volume at which fixed costs are covered. Reversing the margin into positive territory requires either further multiple growth in revenue or a reduction in costs.
Net profit by quarter
| Period | Measure | bn USD |
|---|---|---|
| Q3 2024 | Net profit | −0.00026460899999999996 |
| Q1 2025 | Net profit | −0.001011161 |
| Q2 2025 | Net profit | −0.0019406509999999998 |
| Q3 2025 | Net profit | −0.021059515999999997 |
| Q4 2025 | Net profit | −0.005441 |
| Q1 2026 | Net profit | −0.005229104 |
| Q2 2026 | Net profit | −0.003458413 |
| Q3 2026 | Net profit | −0.003607465 |
Operating cash flow of -$6.63m against capex of $2.43m – the quarter burned more than it brought in
Operating cash flow in the third quarter of 2026 was negative at -$6.63m. Capital expenditure over the same period was $2.43m. Together this means the quarter required more than $9m of cash that was not covered by operations.
For comparison: in the second quarter of 2026 operating cash flow was positive at $1.46m, and capex was $4.14m. So in the third quarter the company returned to burning cash. Over the trailing twelve months operating cash flow was -$12.4m – a persistently negative figure.
Net debt of $25.10m versus a $35.70m market cap – leverage consumes most of the equity value
Net debt at 30 September 2026 was $25.10m. With a market capitalisation of $35.70m, that means debt equals 70% of market cap. In other words, most of the company's value sits in liabilities rather than equity.
The company is loss-making at the EBITDA level, so a net debt/EBITDA ratio cannot be calculated – the denominator is negative. That is a warning sign in itself: debt is not being serviced from operating profit but from new borrowings or asset sales. With operating cash flow of -$6.63m for the quarter, leverage could rise further.
Return on equity of -18.2% – shareholder capital is working at a loss, not a profit
Return on equity (ROE) is -18.2%. This means that for every dollar of invested capital the company generates 18 cents of loss. Negative profitability persists despite revenue growth, suggesting that growth is not yet translating into profit for shareholders.
For comparison: a market capitalisation of $35.70m with net debt of $25.10m gives an enterprise value (EV) of about $60.8m. With negative EBITDA, an EV/EBITDA multiple is meaningless. The investor is effectively paying for a loss-making business burdened with debt.
Valuation on the latest reported figures
| Metric | Value |
|---|---|
| Market cap | 0.04 bn USD |
| P/B | 1.73 |
| Operating cash flow (LTM) | -0.01 bn |
| ROE | -18.2% |
Share price, three years
close, last point 2026-11-10
| Period | Measure | USD per share |
|---|---|---|
| 2025-11-10 | Closing price | 5.340000152587891 |
| 2025-11-11 | Closing price | 5.369999885559082 |
| 2025-11-12 | Closing price | 5.260000228881836 |
| 2025-11-13 | Closing price | 5.340000152587891 |
| 2025-11-14 | Closing price | 5.360000133514404 |
| 2025-11-17 | Closing price | 4.960000038146973 |
| 2025-11-18 | Closing price | 5.230000019073486 |
| 2025-11-19 | Closing price | 4.949999809265137 |
| 2025-11-20 | Closing price | 3.5299999713897705 |
| 2025-11-21 | Closing price | 3.0199999809265137 |
| 2025-11-24 | Closing price | 2.859999895095825 |
| 2025-11-25 | Closing price | 2.5299999713897705 |
| 2025-11-26 | Closing price | 2.25 |
| 2025-11-28 | Closing price | 2.200000047683716 |
| 2025-12-01 | Closing price | 2.2200000286102295 |
| 2025-12-02 | Closing price | 2.119999885559082 |
| 2025-12-03 | Closing price | 2.2699999809265137 |
| 2025-12-04 | Closing price | 2.140000104904175 |
| 2025-12-05 | Closing price | 2.1600000858306885 |
| 2025-12-08 | Closing price | 1.9199999570846558 |
| 2025-12-09 | Closing price | 1.5199999809265137 |
| 2025-12-10 | Closing price | 1.659999966621399 |
| 2025-12-11 | Closing price | 1.590000033378601 |
| 2025-12-12 | Closing price | 1.649999976158142 |
| 2025-12-15 | Closing price | 1.5199999809265137 |
| 2025-12-16 | Closing price | 1.4800000190734863 |
| 2025-12-17 | Closing price | 1.7999999523162842 |
| 2025-12-18 | Closing price | 1.590000033378601 |
| 2025-12-19 | Closing price | 1.7200000286102295 |
| 2025-12-22 | Closing price | 2.049999952316284 |
| 2025-12-23 | Closing price | 2.0299999713897705 |
| 2025-12-24 | Closing price | 2.109999895095825 |
| 2025-12-26 | Closing price | 1.940000057220459 |
| 2025-12-29 | Closing price | 2.1700000762939453 |
| 2025-12-30 | Closing price | 1.9900000095367432 |
| 2025-12-31 | Closing price | 1.9800000190734863 |
| 2026-01-02 | Closing price | 2.0299999713897705 |
| 2026-01-05 | Closing price | 2.2899999618530273 |
| 2026-01-06 | Closing price | 2.0999999046325684 |
| 2026-01-07 | Closing price | 2.0 |
| 2026-01-08 | Closing price | 2.240000009536743 |
| 2026-01-09 | Closing price | 2.059999942779541 |
| 2026-01-12 | Closing price | 2.6500000953674316 |
| 2026-01-13 | Closing price | 3.2200000286102295 |
| 2026-01-14 | Closing price | 3.450000047683716 |
| 2026-01-15 | Closing price | 2.869999885559082 |
| 2026-01-16 | Closing price | 3.240000009536743 |
| 2026-01-20 | Closing price | 2.869999885559082 |
| 2026-01-21 | Closing price | 2.880000114440918 |
| 2026-01-22 | Closing price | 3.2699999809265137 |
| 2026-01-23 | Closing price | 3.509999990463257 |
| 2026-01-26 | Closing price | 3.1600000858306885 |
| 2026-01-27 | Closing price | 3.380000114440918 |
| 2026-01-28 | Closing price | 3.5199999809265137 |
| 2026-01-29 | Closing price | 3.440000057220459 |
| 2026-01-30 | Closing price | 3.1600000858306885 |
| 2026-02-02 | Closing price | 2.680000066757202 |
| 2026-02-03 | Closing price | 3.0299999713897705 |
| 2026-02-04 | Closing price | 3.0 |
| 2026-02-05 | Closing price | 2.7300000190734863 |
| 2026-02-06 | Closing price | 3.0 |
| 2026-02-09 | Closing price | 3.009999990463257 |
| 2026-02-10 | Closing price | 2.9800000190734863 |
| 2026-02-11 | Closing price | 3.059999942779541 |
| 2026-02-12 | Closing price | 2.890000104904175 |
| 2026-02-13 | Closing price | 3.009999990463257 |
| 2026-02-17 | Closing price | 2.869999885559082 |
| 2026-02-18 | Closing price | 3.799999952316284 |
| 2026-02-19 | Closing price | 4.5 |
| 2026-02-20 | Closing price | 3.3299999237060547 |
| 2026-02-23 | Closing price | 3.4600000381469727 |
| 2026-02-24 | Closing price | 3.440000057220459 |
| 2026-02-25 | Closing price | 3.430000066757202 |
| 2026-02-26 | Closing price | 3.4800000190734863 |
| 2026-02-27 | Closing price | 4.179999828338623 |
| 2026-03-02 | Closing price | 3.4000000953674316 |
| 2026-03-03 | Closing price | 2.25 |
| 2026-03-04 | Closing price | 2.0999999046325684 |
| 2026-03-05 | Closing price | 2.1600000858306885 |
| 2026-03-06 | Closing price | 2.0399999618530273 |
| 2026-03-09 | Closing price | 1.8700000047683716 |
| 2026-03-10 | Closing price | 1.7599999904632568 |
| 2026-03-11 | Closing price | 1.850000023841858 |
| 2026-03-12 | Closing price | 1.8799999952316284 |
| 2026-03-13 | Closing price | 1.850000023841858 |
| 2026-03-16 | Closing price | 1.75 |
| 2026-03-17 | Closing price | 1.7799999713897705 |
| 2026-03-18 | Closing price | 1.659999966621399 |
| 2026-03-19 | Closing price | 1.5499999523162842 |
| 2026-03-20 | Closing price | 1.4700000286102295 |
| 2026-03-23 | Closing price | 1.5 |
| 2026-03-24 | Closing price | 1.4700000286102295 |
| 2026-03-25 | Closing price | 1.4600000381469727 |
| 2026-03-26 | Closing price | 1.600000023841858 |
| 2026-03-27 | Closing price | 1.4900000095367432 |
| 2026-03-30 | Closing price | 1.3600000143051147 |
| 2026-03-31 | Closing price | 1.440000057220459 |
| 2026-04-01 | Closing price | 1.350000023841858 |
| 2026-04-02 | Closing price | 1.2200000286102295 |
| 2026-04-06 | Closing price | 1.2300000190734863 |
| 2026-04-07 | Closing price | 1.2200000286102295 |
| 2026-04-08 | Closing price | 1.100000023841858 |
| 2026-04-09 | Closing price | 1.0800000429153442 |
| 2026-04-10 | Closing price | 1.090000033378601 |
| 2026-04-13 | Closing price | 1.1100000143051147 |
| 2026-04-14 | Closing price | 1.1200000047683716 |
| 2026-04-15 | Closing price | 1.090000033378601 |
| 2026-04-16 | Closing price | 1.0800000429153442 |
| 2026-04-17 | Closing price | 1.0399999618530273 |
| 2026-04-20 | Closing price | 1.0499999523162842 |
| 2026-04-21 | Closing price | 1.1299999952316284 |
| 2026-04-22 | Closing price | 1.2599999904632568 |
| 2026-04-23 | Closing price | 1.25 |
| 2026-04-24 | Closing price | 1.149999976158142 |
| 2026-04-27 | Closing price | 1.25 |
| 2026-04-28 | Closing price | 1.2300000190734863 |
| 2026-04-29 | Closing price | 1.159999966621399 |
| 2026-04-30 | Closing price | 1.2100000381469727 |
| 2026-05-01 | Closing price | 1.190000057220459 |
| 2026-05-04 | Closing price | 1.190000057220459 |
| 2026-05-05 | Closing price | 1.159999966621399 |
| 2026-05-06 | Closing price | 1.1100000143051147 |
| 2026-05-07 | Closing price | 1.090000033378601 |
| 2026-05-08 | Closing price | 1.1299999952316284 |
| 2026-05-11 | Closing price | 1.1799999475479126 |
| 2026-05-12 | Closing price | 1.2100000381469727 |
| 2026-05-13 | Closing price | 1.1699999570846558 |
| 2026-05-14 | Closing price | 1.1699999570846558 |
| 2026-05-15 | Closing price | 1.100000023841858 |
| 2026-05-18 | Closing price | 1.159999966621399 |
| 2026-05-19 | Closing price | 1.2000000476837158 |
| 2026-05-20 | Closing price | 1.1699999570846558 |
| 2026-05-21 | Closing price | 1.149999976158142 |
| 2026-05-22 | Closing price | 1.190000057220459 |
| 2026-05-26 | Closing price | 1.149999976158142 |
| 2026-05-27 | Closing price | 1.1200000047683716 |
| 2026-05-28 | Closing price | 1.1699999570846558 |
| 2026-05-29 | Closing price | 1.1699999570846558 |
| 2026-06-01 | Closing price | 1.1699999570846558 |
| 2026-06-02 | Closing price | 1.1699999570846558 |
| 2026-06-03 | Closing price | 1.1299999952316284 |
| 2026-06-04 | Closing price | 1.149999976158142 |
| 2026-06-05 | Closing price | 1.0700000524520874 |
| 2026-06-08 | Closing price | 1.190000057220459 |
| 2026-06-09 | Closing price | 1.159999966621399 |
| 2026-06-10 | Closing price | 1.1699999570846558 |
| 2026-06-11 | Closing price | 1.1100000143051147 |
| 2026-06-12 | Closing price | 1.149999976158142 |
| 2026-06-15 | Closing price | 1.1399999856948853 |
| 2026-06-16 | Closing price | 1.149999976158142 |
| 2026-06-17 | Closing price | 1.1100000143051147 |
| 2026-06-18 | Closing price | 1.100000023841858 |
| 2026-06-22 | Closing price | 1.059999942779541 |
| 2026-06-23 | Closing price | 0.9700000286102295 |
| 2026-06-24 | Closing price | 0.9100000262260437 |
| 2026-06-25 | Closing price | 0.9100000262260437 |
| 2026-06-26 | Closing price | 1.0199999809265137 |
| 2026-06-29 | Closing price | 0.9700000286102295 |
| 2026-06-30 | Closing price | 0.9800000190734863 |
| 2026-07-01 | Closing price | 0.9700000286102295 |
| 2026-07-02 | Closing price | 0.949999988079071 |
| 2026-07-06 | Closing price | 0.9800000190734863 |
| 2026-07-07 | Closing price | 0.949999988079071 |
| 2026-07-08 | Closing price | 1.0099999904632568 |
| 2026-07-09 | Closing price | 1.0099999904632568 |
| 2026-07-10 | Closing price | 0.9700000286102295 |
| 2026-07-13 | Closing price | 1.0099999904632568 |
| 2026-07-14 | Closing price | 1.059999942779541 |
| 2026-07-15 | Closing price | 1.0299999713897705 |
| 2026-07-16 | Closing price | 1.0199999809265137 |
| 2026-07-17 | Closing price | 1.0099999904632568 |
| 2026-07-20 | Closing price | 1.0299999713897705 |
| 2026-07-21 | Closing price | 1.0399999618530273 |
| 2026-07-22 | Closing price | 1.059999942779541 |
| 2026-07-23 | Closing price | 1.0299999713897705 |
| 2026-07-24 | Closing price | 0.9900000095367432 |
| 2026-07-27 | Closing price | 0.9700000286102295 |
| 2026-07-28 | Closing price | 0.949999988079071 |
| 2026-07-29 | Closing price | 0.9200000166893005 |
| 2026-07-30 | Closing price | 0.9399999976158142 |
| 2026-07-31 | Closing price | 0.9700000286102295 |
| 2026-08-03 | Closing price | 0.949999988079071 |
| 2026-08-04 | Closing price | 0.9300000071525574 |
| 2026-08-05 | Closing price | 0.9200000166893005 |
| 2026-08-06 | Closing price | 0.8899999856948853 |
| 2026-08-07 | Closing price | 0.8299999833106995 |
| 2026-08-10 | Closing price | 0.8799999952316284 |
| 2026-08-11 | Closing price | 0.8899999856948853 |
| 2026-08-12 | Closing price | 0.8700000047683716 |
| 2026-08-13 | Closing price | 0.8700000047683716 |
| 2026-08-14 | Closing price | 0.8999999761581421 |
| 2026-08-17 | Closing price | 0.9300000071525574 |
| 2026-08-18 | Closing price | 0.9200000166893005 |
| 2026-08-19 | Closing price | 0.9100000262260437 |
| 2026-08-20 | Closing price | 0.9599999785423279 |
| 2026-08-21 | Closing price | 0.9599999785423279 |
| 2026-08-24 | Closing price | 0.9800000190734863 |
| 2026-08-25 | Closing price | 0.9300000071525574 |
| 2026-08-26 | Closing price | 0.949999988079071 |
| 2026-08-27 | Closing price | 0.9700000286102295 |
| 2026-08-28 | Closing price | 1.0099999904632568 |
| 2026-08-31 | Closing price | 1.0700000524520874 |
| 2026-09-01 | Closing price | 1.1100000143051147 |
| 2026-09-02 | Closing price | 1.1399999856948853 |
| 2026-09-03 | Closing price | 1.1399999856948853 |
| 2026-09-04 | Closing price | 1.159999966621399 |
| 2026-09-08 | Closing price | 1.159999966621399 |
| 2026-09-09 | Closing price | 1.1399999856948853 |
| 2026-09-10 | Closing price | 1.1799999475479126 |
| 2026-09-11 | Closing price | 1.149999976158142 |
| 2026-09-14 | Closing price | 1.159999966621399 |
| 2026-09-15 | Closing price | 1.1699999570846558 |
| 2026-09-16 | Closing price | 1.1200000047683716 |
| 2026-09-17 | Closing price | 1.159999966621399 |
| 2026-09-18 | Closing price | 1.2300000190734863 |
| 2026-09-21 | Closing price | 1.2100000381469727 |
| 2026-09-22 | Closing price | 1.2200000286102295 |
| 2026-09-23 | Closing price | 1.2799999713897705 |
| 2026-09-24 | Closing price | 1.2799999713897705 |
| 2026-09-25 | Closing price | 1.340000033378601 |
| 2026-09-28 | Closing price | 1.2300000190734863 |
| 2026-09-29 | Closing price | 1.1799999475479126 |
| 2026-09-30 | Closing price | 1.090000033378601 |
| 2026-10-01 | Closing price | 0.9599999785423279 |
| 2026-10-02 | Closing price | 1.0 |
| 2026-10-05 | Closing price | 0.9599999785423279 |
| 2026-10-06 | Closing price | 0.949999988079071 |
| 2026-10-07 | Closing price | 0.9100000262260437 |
| 2026-10-08 | Closing price | 0.9399999976158142 |
| 2026-10-09 | Closing price | 0.949999988079071 |
| 2026-10-12 | Closing price | 0.9200000166893005 |
| 2026-10-13 | Closing price | 0.8999999761581421 |
| 2026-10-14 | Closing price | 0.8500000238418579 |
| 2026-10-15 | Closing price | 0.8500000238418579 |
| 2026-10-16 | Closing price | 0.8299999833106995 |
| 2026-10-19 | Closing price | 0.8999999761581421 |
| 2026-10-20 | Closing price | 0.9200000166893005 |
| 2026-10-21 | Closing price | 0.9300000071525574 |
| 2026-10-22 | Closing price | 0.9599999785423279 |
| 2026-10-23 | Closing price | 1.0099999904632568 |
| 2026-10-26 | Closing price | 1.0099999904632568 |
| 2026-10-27 | Closing price | 0.949999988079071 |
| 2026-10-28 | Closing price | 0.9700000286102295 |
| 2026-10-29 | Closing price | 0.949999988079071 |
| 2026-10-30 | Closing price | 0.8899999856948853 |
| 2026-11-02 | Closing price | 0.8500000238418579 |
| 2026-11-03 | Closing price | 0.8600000143051147 |
| 2026-11-04 | Closing price | 0.8899999856948853 |
| 2026-11-05 | Closing price | 0.8299999833106995 |
| 2026-11-06 | Closing price | 0.8600000143051147 |
| 2026-11-09 | Closing price | 0.8299999833106995 |
| 2026-11-10 | Closing price | 0.8294000029563904 |
Bottom line
Revenue in the third quarter of 2026 grew 11.6-fold to $2.32m – that is the strong part of the report. However, EBITDA loss was $3.32m, net loss $3.61m, and operating cash flow was negative at -$6.63m. Net debt of $25.10m equals 70% of market cap, which limits equity value. Our conclusion: the share is rather unattractive – with negative EBITDA and debt at 70% of market cap, there is no margin of safety. Our view: the share is rather unattractive at the current price.