IAMGOLD: gold rose 23% but EBITDA beat the price-implied level by 30% – and spot is already lower
Contents
On 11 November IAMGOLD reported results for the third quarter of 2026. The average gold price in the period was 4268 USD/oz against 3459 USD a year earlier (+23.4%), and 5.5% below the previous quarter. Revenue was 856.5 million USD (+21.2% year on year), EBITDA 583.4 million USD (+72.5%), net profit 297.0 million USD (+113.1%). At the year-ago volumes and costs, prices would have produced EBITDA of 449.2 million USD, so the company earned 134.2 million USD above the price-implied level. Our verdict: rather attractive – the portal model puts the upside to fair value at +10%, and EV/EBITDA of 4.3 against its own three-year average of 6.3 is a 31% discount. Our view: the share is rather attractive at the current price; upside on the portal model +10%.
Our view: is there upside
Our view in numbers
| Metric | Our read |
|---|---|
| Verdict | Rather attractive |
| Upside on the portal model | +10% |
| How the model works | spot model: EBITDA re-priced to current commodity prices at the target EV/EBITDA, against market cap |
| EV/EBITDA now and 3-year average | 4.3 vs 6.3 – a 31% discount to its history |
| Net debt / EBITDA | -0.13 – net cash |
| Strongest case for | EBITDA of 583.4 million USD is 134.2 million USD above the price-implied level at a 68.1% margin with net cash of 317.4 million USD – the company earns more than the gold price alone would allow. |
| Strongest case against | Spot gold at 4045 USD/oz is 5.2% below the reported-period average, and at current prices the model's EBITDA of 2019.4 million USD is 17.5% below LTM, with EV/EBITDA at 5.1. |
| What would change the view | A return of gold to 4268 USD/oz or above would lift the model's upside above +10% and move the verdict one step up; a sustained move below 4045 USD would move it one step down. |
Key takeaways
— Gold averaged 4268 USD/oz in the quarter – 23.4% above a year earlier, but 5.5% below the previous quarter, and spot is already 4045 USD.
— EBITDA of 583.4 million USD is 134.2 million USD above the price-implied level – at year-ago volumes and costs, prices would have produced only 449.2 million USD.
— Revenue of 856.5 million USD is 1.8% below the price-implied level – so volumes sold or the realised price lagged the benchmark.
— EBITDA margin of 68.1% against 47.9% a year earlier – the margin gain, with diesel up 45.3% and electricity up 63.3%, is not explained by the gold price alone.
— Net cash of 317.4 million USD against LTM EBITDA of 2527.8 million USD – net debt/EBITDA of -0.13, effectively no leverage.
— Operating cash flow of 461.1 million USD with capex of 109.6 million USD – free cash covers the reinvestment needed to sustain production.
— EV/EBITDA of 4.3 against its own three-year average of 6.3 – a 31% discount, but at current prices the model's EBITDA of 2019.4 million USD is 17.5% below LTM.
Key figures, USD bn
| Metric | Q3 2025 | Q3 2026 | Change |
|---|---|---|---|
| Revenue | 0.71 | 0.86 | +21.2% |
| EBITDA | 0.34 | 0.58 | +72.5% |
| Operating profit | 0.25 | 0.38 | +52.1% |
| Net profit | 0.14 | 0.30 | +113.1% |
| Operating cash flow | 0.28 | 0.46 | +64.2% |
| Capex | 0.07 | 0.11 | +64.8% |
| EBITDA margin | 47.9% | 68.1% | +20.2 pp |
| Net margin | 19.7% | 34.7% | +15.0 pp |
Gold averaged 4268 USD/oz in the quarter – 23.4% above a year earlier, but 5.5% below the previous quarter, and spot is already 4045 USD.
The average gold price in the third quarter of 2026 was 4268 USD/oz. A year earlier it was 3459 USD, a rise of 23.4%. This is the main external driver of the report: gold accounts for 100% of revenue in the portal model.
Against the previous quarter the price fell 5.5%, from 4514 USD to 4268 USD. On 11 November spot is 4045 USD, a further 5.2% below the reported-period average. For valuing the share this matters more than the quarterly dynamics: the market is already pricing a lower price than the one at which the company earned its reported EBITDA.
The diesel and electricity the company buys also rose. Average diesel in the quarter was 5.454 USD against 3.754 USD a year earlier (+45.3%), electricity 102.8 USD against 62.9 USD (+63.3%). At our calculation these input prices added 54.4 million USD to costs relative to a year earlier.
Commodity prices: period average and now
| Benchmark | Year ago | Q3 2026 | YoY | Spot 2026-11-11 |
|---|---|---|---|---|
| Gold, USD | 3 459 | 4 268 | +23,4% | 4 045 |
| US Diesel Index (EIA) (input cost), USD | 3,75 | 5,45 | +45,3% | 6,13 |
| Electricity Spot (input cost), USD | 62,9 | 102,8 | +63,3% | 63,9 |
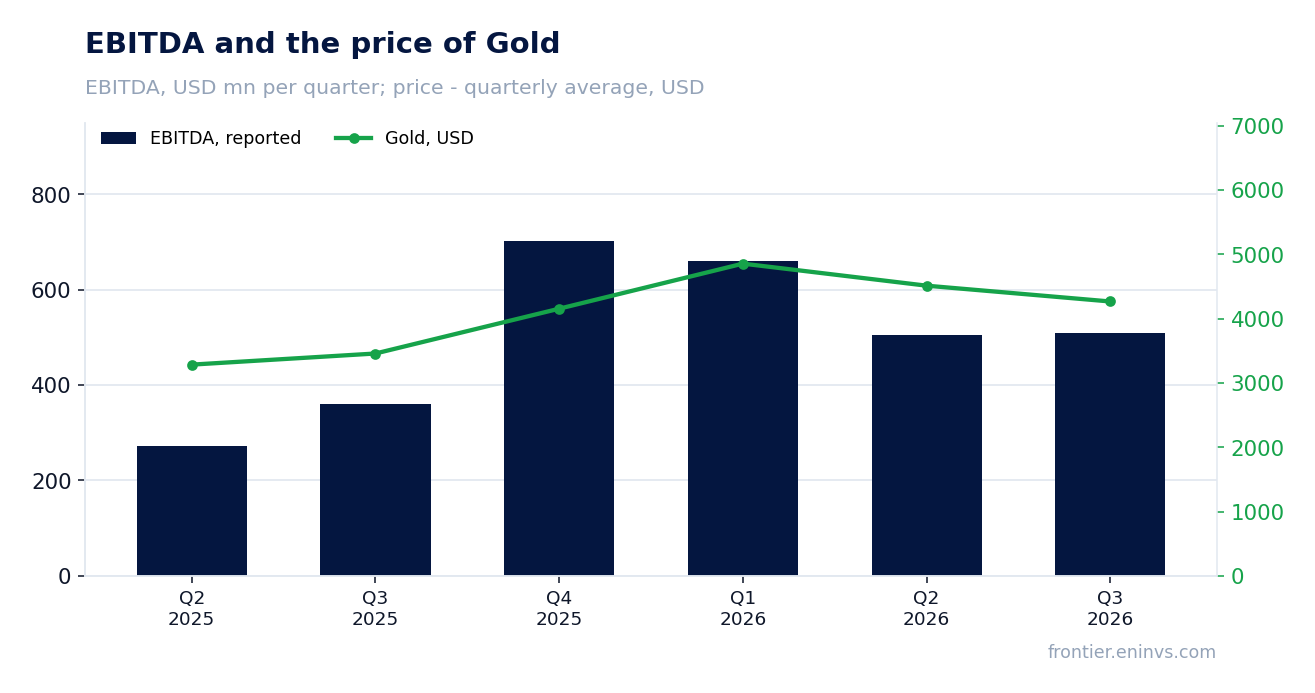
EBITDA of 583.4 million USD is 134.2 million USD above the price-implied level – at year-ago volumes and costs, prices would have produced only 449.2 million USD.
At our calculation, had the company kept the volumes and non-commodity costs of the third quarter of 2025 and only gold and input prices changed, revenue would have been 872 million USD and EBITDA 449.2 million USD. Actual revenue was 856.5 million USD (–1.8% against the implied level), EBITDA 583.4 million USD (+29.9%).
The revenue gap is small and negative: sales or the realised price lagged the benchmark slightly. The EBITDA gap is positive and large – 134.2 million USD. That means unit costs were lower than a year earlier, or the sales mix shifted towards a higher-value product. The facts give no volume or unit-cost breakdown, so the exact cause cannot be named; what is visible is that the economics per ounce improved.
Against the previous quarter the picture is the same. At the volumes and costs of the second quarter of 2026, prices would have produced revenue of 810.1 million USD and EBITDA of 439.7 million USD. Actual revenue is 5.7% higher, EBITDA 32.7% higher. Even with a lower gold price the company earned well above the price-implied level.
What the prices implied and what the company earned
| Base (Q3 2025) | Implied at period prices | Reported | Reported vs implied | |
|---|---|---|---|---|
| Revenue, USD mn | 706,7 | 872,0 | 856,5 | -1,8% |
| EBITDA, USD mn | 338,2 | 449,2 | 583,4 | +29,9% |
Revenue and EBITDA by quarter
| Period | Measure | bn USD |
|---|---|---|
| Q2 2025 | Revenue | 0.5809 |
| Q3 2025 | Revenue | 0.7067 |
| Q4 2025 | Revenue | 1.0880999999999998 |
| Q1 2026 | Revenue | 1.0301 |
| Q2 2026 | Revenue | 0.8569 |
| Q3 2026 | Revenue | 0.8565 |
| Q2 2025 | EBITDA | 0.2726 |
| Q3 2025 | EBITDA | 0.3612 |
| Q4 2025 | EBITDA | 0.7031 |
| Q1 2026 | EBITDA | 0.6604000000000001 |
| Q2 2026 | EBITDA | 0.5047 |
| Q3 2026 | EBITDA | 0.5087 |
EBITDA margin
| Period | Measure | % |
|---|---|---|
| Q2 2025 | EBITDA margin | 46.9 |
| Q3 2025 | EBITDA margin | 51.1 |
| Q4 2025 | EBITDA margin | 64.6 |
| Q1 2026 | EBITDA margin | 64.1 |
| Q2 2026 | EBITDA margin | 58.9 |
| Q3 2026 | EBITDA margin | 59.4 |
Revenue of 856.5 million USD is 1.8% below the price-implied level – so volumes sold or the realised price lagged the benchmark.
Revenue in the third quarter of 2026 was 856.5 million USD against 706.7 million USD a year earlier, up 21.2%. That is slower than in the second quarter of 2026, when revenue grew 47.5%: the deceleration reflects a higher year-ago base in the third quarter of 2025 and a gold price that fell against the previous quarter.
The price-implied revenue level is 872 million USD. The actual figure is 15.5 million USD, or 1.8%, lower. With gold up 23.4%, that means volumes sold or the realised price per ounce were below the third quarter of 2025. The facts give no precise production or sales data, so we limit ourselves to stating that revenue lagged the metal price.
For the shareholder what matters more is that this shortfall did not prevent EBITDA from beating the implied level by 29.9%. Revenue is not the key metric for a gold miner; the realised price and unit costs are, and there the company won.
EBITDA margin of 68.1% against 47.9% a year earlier – the margin gain, with diesel up 45.3% and electricity up 63.3%, is not explained by the gold price alone.
The EBITDA margin in the reported quarter was 68.1% against 47.9% a year earlier. A gain of 20.2 percentage points with diesel up 45.3% and electricity up 63.3% means the company either cut unit costs or sold more metal at a realised price above the benchmark. The facts give no cost breakdown, so the specific line cannot be named.
The net margin rose from 19.7% to 34.7%. Net profit was 297.0 million USD against 139.4 million USD a year earlier, up 113.1%. Part of that is operating leverage: with revenue of 856.5 million USD and EBITDA of 583.4 million USD, depreciation and interest take a small share, and taxes take less than the EBITDA increase.
For comparison, in the previous quarter EBITDA was 504.7 million USD on revenue of 856.9 million USD, a margin of 58.9%. In the third quarter, on almost the same revenue, EBITDA rose to 583.4 million USD – the margin added 9.2 percentage points. That confirms the driver was not the gold price, which fell, but costs or the sales mix.
Net cash of 317.4 million USD against LTM EBITDA of 2527.8 million USD – net debt/EBITDA of -0.13, effectively no leverage.
As of 30 September 2026 the company had net cash of 317.4 million USD: cash exceeds debt. Net debt to LTM EBITDA is -0.13. That is a level, not a trend: the facts give no prior value, so one cannot say whether leverage rose or fell.
LTM EBITDA is 2527.8 million USD on revenue of 3800.0 million USD and net profit of 1313.8 million USD. Operating cash flow over the same period was 2177.8 million USD. At these levels net cash is small relative to annual EBITDA, but the absence of debt gives the company resilience if the gold price falls.
Interest on debt is not disclosed in the facts, but with a net cash position it is not a material line. For the shareholder this means no refinancing risk, and free cash can go to capex or capital returns.
Valuation vs its own history
now vs the 3-year average
| Period | Measure | × |
|---|---|---|
| EV/EBITDA | Now | 4.349868902726169 |
| EV/EBITDA | 3-year average | 6.339134465737473 |
Operating cash flow of 461.1 million USD with capex of 109.6 million USD – free cash covers the reinvestment needed to sustain production.
In the third quarter of 2026 operating cash flow was 461.1 million USD and capital expenditure 109.6 million USD. Free cash flow before interest and tax is about 351.5 million USD. That is more than net profit of 297.0 million USD, typical for a miner with large depreciation.
Capex of 109.6 million USD is 12.8% of revenue. That is enough to sustain production: with a reserve life of 12.9 years at the current production rate, the company does not have to raise investment to keep volumes flat. In the previous quarter capex was 129.0 million USD, so it fell in the third quarter.
With net cash of 317.4 million USD, free cash could go to dividends or buybacks, but the facts give no dividend policy or payments. We therefore limit ourselves to stating that cash flow covers investment and leaves a cushion.
Share price, three years
close, last point 2026-11-10
| Period | Measure | USD per share |
|---|---|---|
| 2025-11-10 | Closing price | 13.300000190734863 |
| 2025-11-11 | Closing price | 13.670000076293945 |
| 2025-11-12 | Closing price | 14.420000076293945 |
| 2025-11-13 | Closing price | 13.779999732971191 |
| 2025-11-14 | Closing price | 13.729999542236328 |
| 2025-11-17 | Closing price | 13.489999771118164 |
| 2025-11-18 | Closing price | 13.680000305175781 |
| 2025-11-19 | Closing price | 13.670000076293945 |
| 2025-11-20 | Closing price | 12.779999732971191 |
| 2025-11-21 | Closing price | 12.880000114440918 |
| 2025-11-24 | Closing price | 13.949999809265137 |
| 2025-11-25 | Closing price | 14.539999961853027 |
| 2025-11-26 | Closing price | 15.3100004196167 |
| 2025-11-28 | Closing price | 15.539999961853027 |
| 2025-12-01 | Closing price | 15.380000114440918 |
| 2025-12-02 | Closing price | 14.979999542236328 |
| 2025-12-03 | Closing price | 15.029999732971191 |
| 2025-12-04 | Closing price | 15.15999984741211 |
| 2025-12-05 | Closing price | 15.270000457763672 |
| 2025-12-08 | Closing price | 14.819999694824219 |
| 2025-12-09 | Closing price | 15.180000305175781 |
| 2025-12-10 | Closing price | 15.460000038146973 |
| 2025-12-11 | Closing price | 15.930000305175781 |
| 2025-12-12 | Closing price | 15.84000015258789 |
| 2025-12-15 | Closing price | 15.779999732971191 |
| 2025-12-16 | Closing price | 15.890000343322754 |
| 2025-12-17 | Closing price | 16.06999969482422 |
| 2025-12-18 | Closing price | 16.1200008392334 |
| 2025-12-19 | Closing price | 16.790000915527344 |
| 2025-12-22 | Closing price | 17.549999237060547 |
| 2025-12-23 | Closing price | 17.709999084472656 |
| 2025-12-24 | Closing price | 17.31999969482422 |
| 2025-12-26 | Closing price | 17.610000610351562 |
| 2025-12-29 | Closing price | 16.479999542236328 |
| 2025-12-30 | Closing price | 16.75 |
| 2025-12-31 | Closing price | 16.489999771118164 |
| 2026-01-02 | Closing price | 16.219999313354492 |
| 2026-01-05 | Closing price | 16.31999969482422 |
| 2026-01-06 | Closing price | 16.829999923706055 |
| 2026-01-07 | Closing price | 16.979999542236328 |
| 2026-01-08 | Closing price | 17.040000915527344 |
| 2026-01-09 | Closing price | 17.209999084472656 |
| 2026-01-12 | Closing price | 17.799999237060547 |
| 2026-01-13 | Closing price | 17.420000076293945 |
| 2026-01-14 | Closing price | 17.809999465942383 |
| 2026-01-15 | Closing price | 17.56999969482422 |
| 2026-01-16 | Closing price | 17.170000076293945 |
| 2026-01-20 | Closing price | 19.829999923706055 |
| 2026-01-21 | Closing price | 19.260000228881836 |
| 2026-01-22 | Closing price | 20.040000915527344 |
| 2026-01-23 | Closing price | 20.950000762939453 |
| 2026-01-26 | Closing price | 21.0 |
| 2026-01-27 | Closing price | 21.329999923706055 |
| 2026-01-28 | Closing price | 22.030000686645508 |
| 2026-01-29 | Closing price | 20.8799991607666 |
| 2026-01-30 | Closing price | 18.18000030517578 |
| 2026-02-02 | Closing price | 18.190000534057617 |
| 2026-02-03 | Closing price | 19.559999465942383 |
| 2026-02-04 | Closing price | 19.200000762939453 |
| 2026-02-05 | Closing price | 17.979999542236328 |
| 2026-02-06 | Closing price | 19.1200008392334 |
| 2026-02-09 | Closing price | 21.280000686645508 |
| 2026-02-10 | Closing price | 21.579999923706055 |
| 2026-02-11 | Closing price | 22.489999771118164 |
| 2026-02-12 | Closing price | 20.15999984741211 |
| 2026-02-13 | Closing price | 21.6299991607666 |
| 2026-02-17 | Closing price | 20.809999465942383 |
| 2026-02-18 | Closing price | 21.270000457763672 |
| 2026-02-19 | Closing price | 22.3700008392334 |
| 2026-02-20 | Closing price | 22.200000762939453 |
| 2026-02-23 | Closing price | 22.760000228881836 |
| 2026-02-24 | Closing price | 22.940000534057617 |
| 2026-02-25 | Closing price | 22.989999771118164 |
| 2026-02-26 | Closing price | 23.81999969482422 |
| 2026-02-27 | Closing price | 24.56999969482422 |
| 2026-03-02 | Closing price | 24.25 |
| 2026-03-03 | Closing price | 22.43000030517578 |
| 2026-03-04 | Closing price | 22.81999969482422 |
| 2026-03-05 | Closing price | 21.6299991607666 |
| 2026-03-06 | Closing price | 21.760000228881836 |
| 2026-03-09 | Closing price | 21.850000381469727 |
| 2026-03-10 | Closing price | 22.209999084472656 |
| 2026-03-11 | Closing price | 21.809999465942383 |
| 2026-03-12 | Closing price | 21.3799991607666 |
| 2026-03-13 | Closing price | 19.829999923706055 |
| 2026-03-16 | Closing price | 19.639999389648438 |
| 2026-03-17 | Closing price | 19.399999618530273 |
| 2026-03-18 | Closing price | 17.889999389648438 |
| 2026-03-19 | Closing price | 16.889999389648438 |
| 2026-03-20 | Closing price | 16.06999969482422 |
| 2026-03-23 | Closing price | 16.8700008392334 |
| 2026-03-24 | Closing price | 17.020000457763672 |
| 2026-03-25 | Closing price | 17.739999771118164 |
| 2026-03-26 | Closing price | 16.90999984741211 |
| 2026-03-27 | Closing price | 17.739999771118164 |
| 2026-03-30 | Closing price | 17.5 |
| 2026-03-31 | Closing price | 18.81999969482422 |
| 2026-04-01 | Closing price | 19.68000030517578 |
| 2026-04-02 | Closing price | 19.09000015258789 |
| 2026-04-06 | Closing price | 18.969999313354492 |
| 2026-04-07 | Closing price | 19.31999969482422 |
| 2026-04-08 | Closing price | 19.670000076293945 |
| 2026-04-09 | Closing price | 19.780000686645508 |
| 2026-04-10 | Closing price | 20.020000457763672 |
| 2026-04-13 | Closing price | 20.200000762939453 |
| 2026-04-14 | Closing price | 20.6200008392334 |
| 2026-04-15 | Closing price | 19.459999084472656 |
| 2026-04-16 | Closing price | 18.899999618530273 |
| 2026-04-17 | Closing price | 19.25 |
| 2026-04-20 | Closing price | 18.510000228881836 |
| 2026-04-21 | Closing price | 16.829999923706055 |
| 2026-04-22 | Closing price | 17.329999923706055 |
| 2026-04-23 | Closing price | 17.110000610351562 |
| 2026-04-24 | Closing price | 17.229999542236328 |
| 2026-04-27 | Closing price | 17.1200008392334 |
| 2026-04-28 | Closing price | 16.489999771118164 |
| 2026-04-29 | Closing price | 16.360000610351562 |
| 2026-04-30 | Closing price | 16.8700008392334 |
| 2026-05-01 | Closing price | 16.59000015258789 |
| 2026-05-04 | Closing price | 16.309999465942383 |
| 2026-05-05 | Closing price | 16.309999465942383 |
| 2026-05-06 | Closing price | 18.5 |
| 2026-05-07 | Closing price | 18.34000015258789 |
| 2026-05-08 | Closing price | 18.700000762939453 |
| 2026-05-11 | Closing price | 18.989999771118164 |
| 2026-05-12 | Closing price | 19.040000915527344 |
| 2026-05-13 | Closing price | 18.790000915527344 |
| 2026-05-14 | Closing price | 18.469999313354492 |
| 2026-05-15 | Closing price | 16.979999542236328 |
| 2026-05-18 | Closing price | 16.979999542236328 |
| 2026-05-19 | Closing price | 16.18000030517578 |
| 2026-05-20 | Closing price | 16.6200008392334 |
| 2026-05-21 | Closing price | 16.780000686645508 |
| 2026-05-22 | Closing price | 16.520000457763672 |
| 2026-05-26 | Closing price | 17.299999237060547 |
| 2026-05-27 | Closing price | 16.579999923706055 |
| 2026-05-28 | Closing price | 17.360000610351562 |
| 2026-05-29 | Closing price | 17.8799991607666 |
| 2026-06-01 | Closing price | 17.3700008392334 |
| 2026-06-02 | Closing price | 17.489999771118164 |
| 2026-06-03 | Closing price | 16.829999923706055 |
| 2026-06-04 | Closing price | 17.190000534057617 |
| 2026-06-05 | Closing price | 15.420000076293945 |
| 2026-06-08 | Closing price | 15.600000381469727 |
| 2026-06-09 | Closing price | 15.4399995803833 |
| 2026-06-10 | Closing price | 14.84000015258789 |
| 2026-06-11 | Closing price | 16.139999389648438 |
| 2026-06-12 | Closing price | 16.649999618530273 |
| 2026-06-15 | Closing price | 17.93000030517578 |
| 2026-06-16 | Closing price | 18.09000015258789 |
| 2026-06-17 | Closing price | 17.579999923706055 |
| 2026-06-18 | Closing price | 16.8799991607666 |
| 2026-06-22 | Closing price | 16.90999984741211 |
| 2026-06-23 | Closing price | 16.18000030517578 |
| 2026-06-24 | Closing price | 15.229999542236328 |
| 2026-06-25 | Closing price | 15.829999923706055 |
| 2026-06-26 | Closing price | 15.869999885559082 |
| 2026-06-29 | Closing price | 15.9399995803833 |
| 2026-06-30 | Closing price | 15.84000015258789 |
| 2026-07-01 | Closing price | 15.770000457763672 |
| 2026-07-02 | Closing price | 16.559999465942383 |
| 2026-07-06 | Closing price | 16.559999465942383 |
| 2026-07-07 | Closing price | 15.880000114440918 |
| 2026-07-08 | Closing price | 15.029999732971191 |
| 2026-07-09 | Closing price | 15.470000267028809 |
| 2026-07-10 | Closing price | 15.319999694824219 |
| 2026-07-13 | Closing price | 14.819999694824219 |
| 2026-07-14 | Closing price | 14.989999771118164 |
| 2026-07-15 | Closing price | 14.989999771118164 |
| 2026-07-16 | Closing price | 14.199999809265137 |
| 2026-07-17 | Closing price | 14.140000343322754 |
| 2026-07-20 | Closing price | 13.960000038146973 |
| 2026-07-21 | Closing price | 14.960000038146973 |
| 2026-07-22 | Closing price | 15.149999618530273 |
| 2026-07-23 | Closing price | 14.729999542236328 |
| 2026-07-24 | Closing price | 14.65999984741211 |
| 2026-07-27 | Closing price | 14.710000038146973 |
| 2026-07-28 | Closing price | 14.260000228881836 |
| 2026-07-29 | Closing price | 13.930000305175781 |
| 2026-07-30 | Closing price | 14.5600004196167 |
| 2026-07-31 | Closing price | 14.1899995803833 |
| 2026-08-03 | Closing price | 14.75 |
| 2026-08-04 | Closing price | 14.800000190734863 |
| 2026-08-05 | Closing price | 15.890000343322754 |
| 2026-08-06 | Closing price | 16.030000686645508 |
| 2026-08-07 | Closing price | 18.31999969482422 |
| 2026-08-10 | Closing price | 18.43000030517578 |
| 2026-08-11 | Closing price | 18.15999984741211 |
| 2026-08-12 | Closing price | 18.06999969482422 |
| 2026-08-13 | Closing price | 17.75 |
| 2026-08-14 | Closing price | 18.299999237060547 |
| 2026-08-17 | Closing price | 19.049999237060547 |
| 2026-08-18 | Closing price | 18.190000534057617 |
| 2026-08-19 | Closing price | 19.719999313354492 |
| 2026-08-20 | Closing price | 20.5 |
| 2026-08-21 | Closing price | 21.139999389648438 |
| 2026-08-24 | Closing price | 21.799999237060547 |
| 2026-08-25 | Closing price | 22.170000076293945 |
| 2026-08-26 | Closing price | 21.540000915527344 |
| 2026-08-27 | Closing price | 21.540000915527344 |
| 2026-08-28 | Closing price | 20.59000015258789 |
| 2026-08-31 | Closing price | 20.450000762939453 |
| 2026-09-01 | Closing price | 19.290000915527344 |
| 2026-09-02 | Closing price | 20.200000762939453 |
| 2026-09-03 | Closing price | 20.940000534057617 |
| 2026-09-04 | Closing price | 20.479999542236328 |
| 2026-09-08 | Closing price | 20.110000610351562 |
| 2026-09-09 | Closing price | 20.540000915527344 |
| 2026-09-10 | Closing price | 20.09000015258789 |
| 2026-09-11 | Closing price | 20.260000228881836 |
| 2026-09-14 | Closing price | 19.790000915527344 |
| 2026-09-15 | Closing price | 19.639999389648438 |
| 2026-09-16 | Closing price | 19.479999542236328 |
| 2026-09-17 | Closing price | 20.15999984741211 |
| 2026-09-18 | Closing price | 20.350000381469727 |
| 2026-09-21 | Closing price | 20.1299991607666 |
| 2026-09-22 | Closing price | 20.889999389648438 |
| 2026-09-23 | Closing price | 19.889999389648438 |
| 2026-09-24 | Closing price | 19.360000610351562 |
| 2026-09-25 | Closing price | 19.700000762939453 |
| 2026-09-28 | Closing price | 18.68000030517578 |
| 2026-09-29 | Closing price | 18.639999389648438 |
| 2026-09-30 | Closing price | 18.40999984741211 |
| 2026-10-01 | Closing price | 18.34000015258789 |
| 2026-10-02 | Closing price | 18.520000457763672 |
| 2026-10-05 | Closing price | 18.440000534057617 |
| 2026-10-06 | Closing price | 18.549999237060547 |
| 2026-10-07 | Closing price | 18.030000686645508 |
| 2026-10-08 | Closing price | 18.399999618530273 |
| 2026-10-09 | Closing price | 18.799999237060547 |
| 2026-10-12 | Closing price | 18.56999969482422 |
| 2026-10-13 | Closing price | 18.270000457763672 |
| 2026-10-14 | Closing price | 17.049999237060547 |
| 2026-10-15 | Closing price | 17.760000228881836 |
| 2026-10-16 | Closing price | 18.09000015258789 |
| 2026-10-19 | Closing price | 17.780000686645508 |
| 2026-10-20 | Closing price | 17.760000228881836 |
| 2026-10-21 | Closing price | 17.81999969482422 |
| 2026-10-22 | Closing price | 16.420000076293945 |
| 2026-10-23 | Closing price | 16.260000228881836 |
| 2026-10-26 | Closing price | 16.34000015258789 |
| 2026-10-27 | Closing price | 17.079999923706055 |
| 2026-10-28 | Closing price | 17.280000686645508 |
| 2026-10-29 | Closing price | 16.739999771118164 |
| 2026-10-30 | Closing price | 15.449999809265137 |
| 2026-11-02 | Closing price | 16.0 |
| 2026-11-03 | Closing price | 15.850000381469727 |
| 2026-11-04 | Closing price | 17.469999313354492 |
| 2026-11-05 | Closing price | 17.5 |
| 2026-11-06 | Closing price | 18.760000228881836 |
| 2026-11-09 | Closing price | 19.84000015258789 |
| 2026-11-10 | Closing price | 18.530000686645508 |
EV/EBITDA of 4.3 against its own three-year average of 6.3 – a 31% discount, but at current prices the model's EBITDA of 2019.4 million USD is 17.5% below LTM.
LTM EV/EBITDA is 4.3. Its own three-year average is 6.3. A 31% discount means the market values the company more cheaply than it usually has over the past three years. LTM P/E is 8.1, ROE 26.3%. On these multiples the share looks undervalued.
LTM, however, reflects past gold prices. On the portal's spot model, at current prices EBITDA is 2019.4 million USD against 2446.8 million USD in the LTM model, 17.5% lower. EV/EBITDA at current prices is 5.1, not 4.3. The discount to the historical average narrows but remains: 5.1 against 6.3 is 19%.
On the portal's model the upside to fair value is +10%. That is our own calculation, not a market consensus. It uses current gold prices and a target multiple. With spot at 4045 USD/oz, 5.2% below the reported-period average, the cushion is small but positive.
Valuation on the latest reported figures
| Metric | Value |
|---|---|
| Market cap | 10.7 bn USD |
| P/E (LTM) | 8.1 |
| EV/EBITDA (LTM) | 4.3 |
| P/B | 2.54 |
| Net debt / EBITDA (LTM) | -0.13 |
| Operating cash flow (LTM) | 2.18 bn |
| ROE | 26.3% |
| EV/EBITDA, 3-year average | 6.3 |
Net profit by quarter
| Period | Measure | bn USD |
|---|---|---|
| Q2 2025 | Net profit | 0.0787 |
| Q3 2025 | Net profit | 0.1394 |
| Q4 2025 | Net profit | 0.4066 |
| Q1 2026 | Net profit | 0.3797 |
| Q2 2026 | Net profit | 0.2305 |
| Q3 2026 | Net profit | 0.297 |
Bottom line
What was strong in the report was not gold but execution: with the metal up 23.4% year on year, the company earned EBITDA of 583.4 million USD, 134.2 million USD above the price-implied level, and lifted the margin from 47.9% to 68.1%. Net profit of 297.0 million USD rose 113.1%, operating cash flow of 461.1 million USD covered capex of 109.6 million USD, and net cash of 317.4 million USD means no debt risk. The question for a holder now is different: the LTM multiple of 4.3 against a historical average of 6.3 looks cheap, but at spot of 4045 USD the model's EBITDA falls to 2019.4 million USD and EV/EBITDA at current prices is 5.1. Our verdict: rather attractive – the portal model puts the upside at +10%, a 31% discount to its own history on LTM and 19% at current prices. Our view: the share is rather attractive at the current price; upside on the portal model +10%.