Imperial Oil: profit up 4.5x, but almost all of it came from prices and last year's one-offs
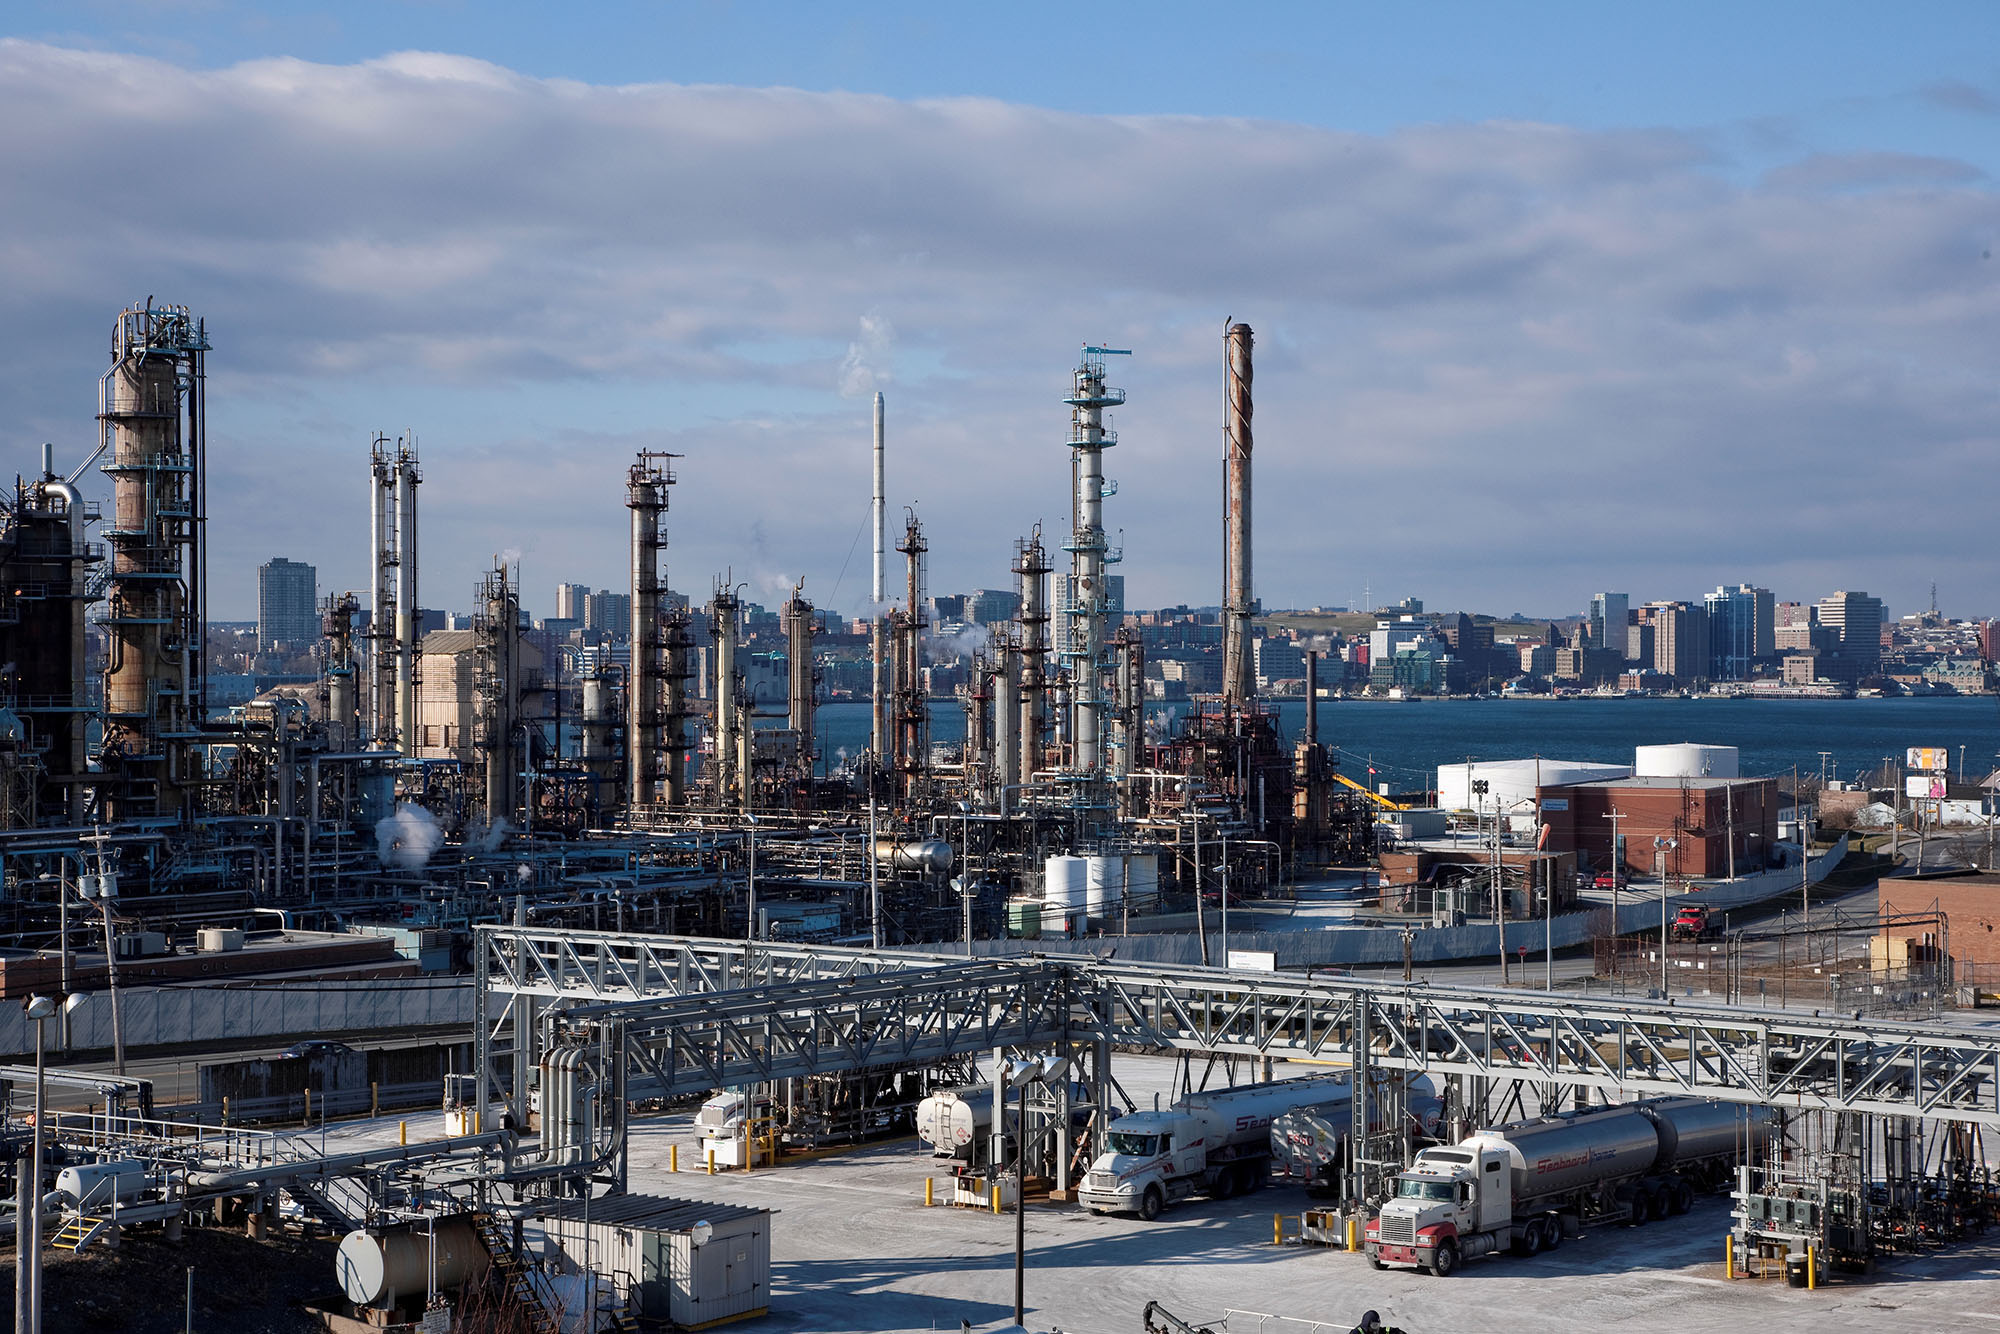
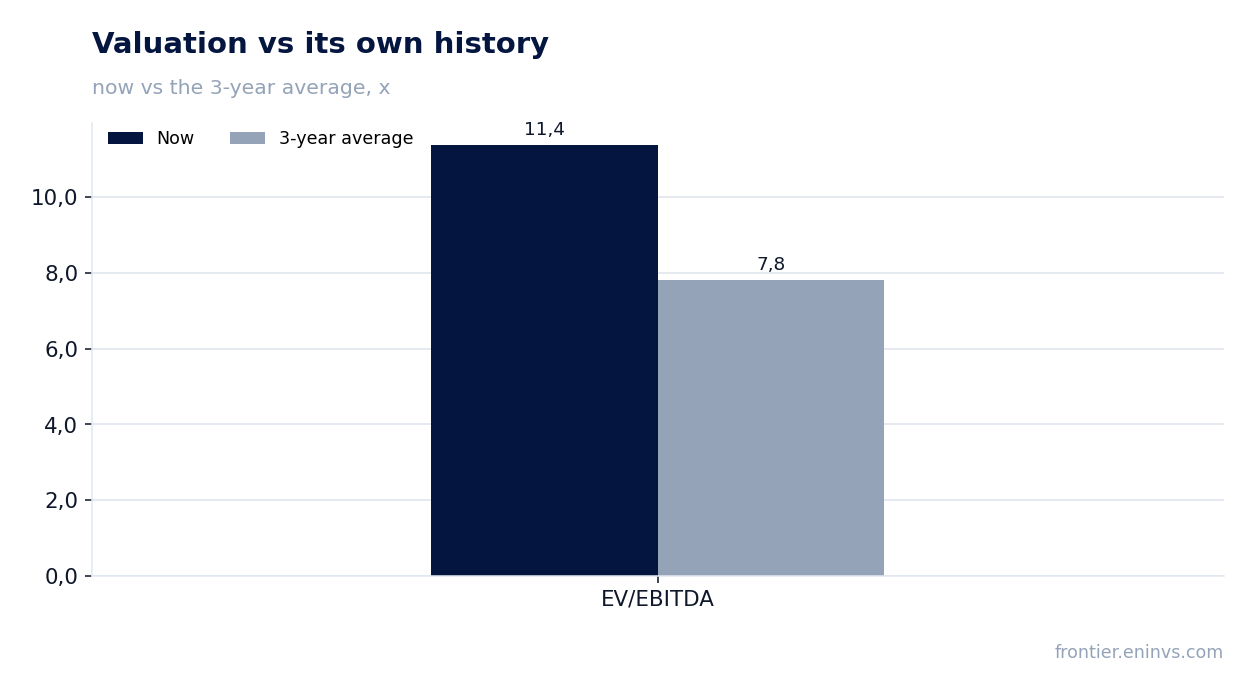
On 30 October Imperial Oil released its third-quarter 2026 results. Revenue came in at USD 11,535.6 million (+36.9% year on year), net profit at USD 1,746.9 million (+346.7%), operating cash flow at USD 2,297.9 million. The profit jump looks impressive, but it rests on high oil prices and on one-off charges in the base period rather than on volumes: production fell and refinery utilisation declined. At an EV/EBITDA of 11.4 against its own three-year average of 7.8 the share looks expensive, and the verdict is neutral.
Key takeaways
— Revenue grew 36.9%, but the pace slowed from 46.0% in the second quarter
— Profit rose 4.5x mainly because of one-off charges in the base period
— The margin rose to 15.1% from 4.6% a year earlier, but oil prices remain the main driver
— Production fell to 418 thousand barrels per day and refinery utilisation dropped to 88%
— Free cash flow of USD 2,566 million covered dividends and share buybacks
— Leverage is moderate: net debt to LTM EBITDA at 0.29
— The share trades above its own history: EV/EBITDA 11.4 versus the 7.8 average
Attractiveness
Key figures, USD bn
| Metric | Q3 2025 | Q3 2026 | Change |
|---|---|---|---|
| Revenue | 8.43 | 11.5 | +36.9% |
| EBITDA | 1.18 | — | — |
| Operating profit | 0.47 | — | — |
| Net profit | 0.39 | 1.75 | +346.7% |
| Operating cash flow | 1.30 | 2.30 | +76.2% |
| Capex | 0.50 | — | — |
| EBITDA margin | 13.9% | — | — |
| Net margin | 4.6% | 15.1% | +10.5 pp |
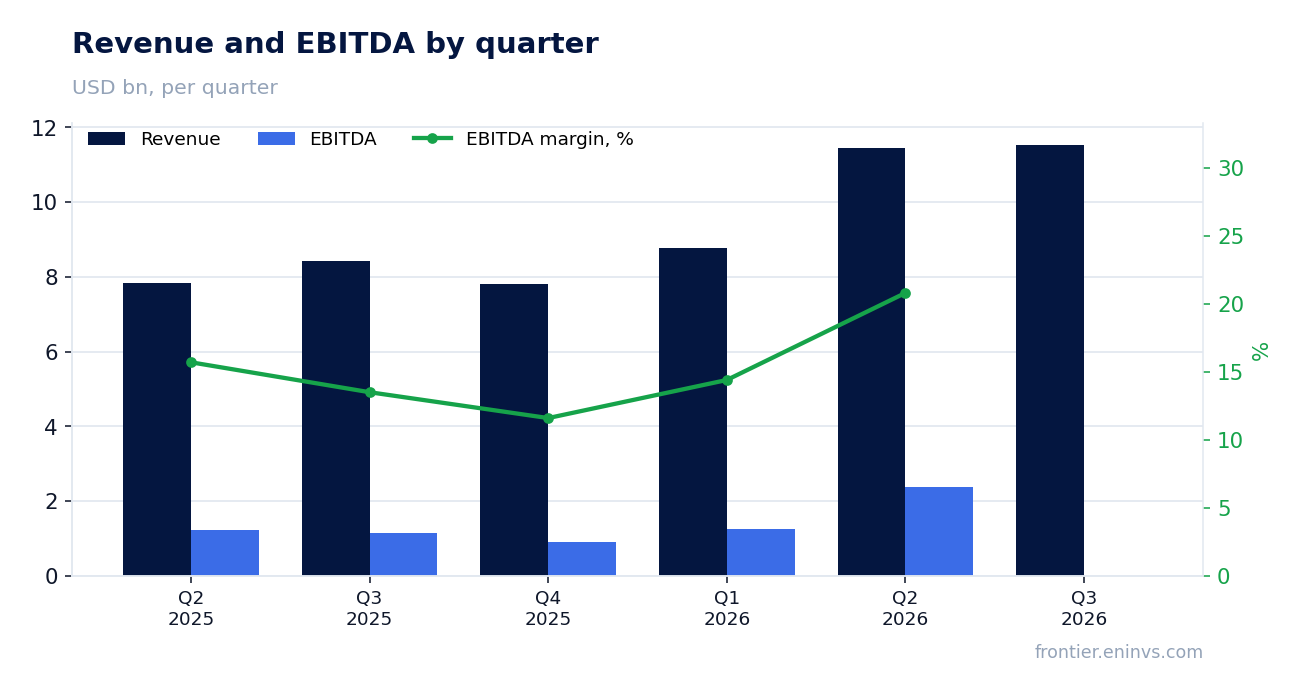
Revenue grew 36.9%, but the pace slowed from 46.0% in the second quarter
Third-quarter 2026 revenue came in at USD 11,535.6 million, up 36.9% year on year. In the second quarter growth was even faster at 46.0%, so the pace slowed. The deceleration is mainly a base effect: revenue in the second quarter of 2025 was low, and by the third quarter that effect began to fade.
Prices were the main driver. The average WTI price in the quarter was USD 85.68 per barrel versus USD 64.97 a year earlier, and bitumen realisations rose to USD 92.16 per barrel from USD 68.22. Synthetic crude sold at USD 124.83 per barrel versus USD 91.12. The price factor outweighed the fall in volumes.
Volumes, however, declined. Production fell to 418 thousand barrels of oil equivalent per day from 462 thousand a year earlier. The main reasons were lower output at Kearl due to the absence of exceptionally high-quality ore and a third-party pipeline outage, as well as planned turnarounds at Cold Lake and Syncrude. Refining also shrank: refinery utilisation was 88% versus 98% a year earlier.
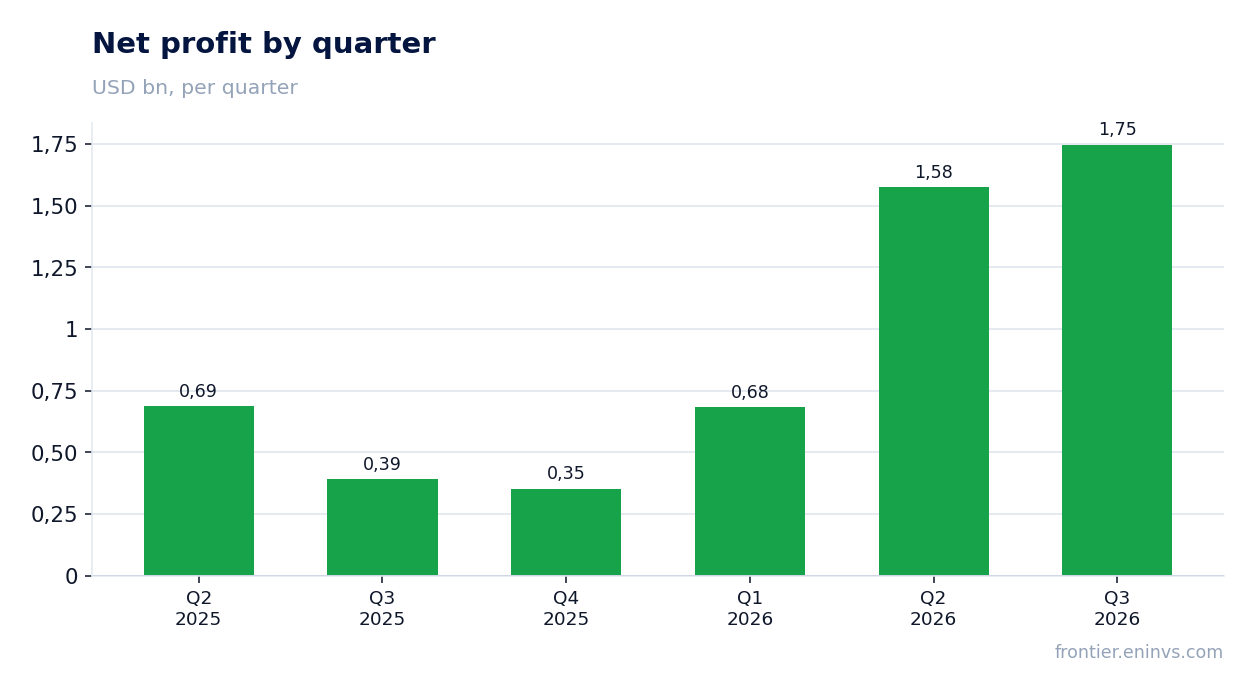
Profit rose 4.5x mainly because of one-off charges in the base period
Third-quarter 2026 net profit came in at USD 1,746.9 million versus USD 391.1 million a year earlier, up 346.7%. However, the third quarter of 2025 included one-off items: a USD 306 million after-tax impairment charge and USD 249 million after-tax restructuring charges, totalling USD 555 million. Excluding them, profit a year earlier would have been USD 1,094 million, and the growth would have been more modest.
Comparable profit excluding one-off items in the third quarter of 2026 was CAD 2,454 million, up from CAD 1,094 million a year earlier. The increase was driven by high oil prices and improved refining margins. At the same time, upstream operating costs rose by about CAD 210 million due to higher energy costs and planned turnarounds.
Downstream earnings reached a quarterly record of CAD 1,555 million versus CAD 444 million a year earlier. Support came from the renewable diesel facility at the Strathcona refinery, which achieved its highest canola throughput. The chemical segment earned CAD 52 million versus CAD 21 million a year earlier.
The margin rose to 15.1% from 4.6% a year earlier, but oil prices remain the main driver
The net margin in the third quarter of 2026 was 15.1% versus 4.6% a year earlier. The margin increase is explained not by lower costs but by a combination of high oil prices and one-off charges in the base period. Excluding one-off items, profit a year earlier would have been higher and the margin contrast less stark.
The price environment remains the key factor. The average WTI price rose 32% year on year, and bitumen realisations rose 35%. At the same time, the WTI/WCS spread narrowed to USD 13.78 per barrel from USD 10.35 a year earlier, which partly holds back revenue from heavy crude. Refining margins improved relative to the second quarter of 2026.
Upstream operating costs rose by about CAD 210 million, partly offsetting the price effect. In refining, a favourable product mix contributed about CAD 170 million, but higher operating expenses and unplanned downtime partly consumed that gain. The chemical segment's margin improved on higher polyethylene prices.
Production fell to 418 thousand barrels per day and refinery utilisation dropped to 88%
Production in the third quarter of 2026 was 418 thousand barrels of oil equivalent per day versus 462 thousand a year earlier. At Kearl, output fell to 282 thousand barrels per day (200 thousand Imperial's share) from 316 thousand (224 thousand) a year earlier. The reasons were the absence of exceptionally high-quality ore and a third-party pipeline outage that shut down production entirely for several days.
At Cold Lake, output was 139 thousand barrels per day versus 150 thousand a year earlier due to a planned turnaround. The Syncrude share was 70 thousand barrels per day versus 78 thousand, linked to a planned coker turnaround. The company cut its 2026 Kearl production target to 280 thousand barrels per day (199 thousand Imperial's share) due to the impact of third-party events.
Refinery utilisation was 88% versus 98% a year earlier. The decline was due to unplanned downtime, a third-party pipeline outage and planned turnarounds at the Sarnia refinery. Petroleum product sales nevertheless rose to 474 thousand barrels per day from 464 thousand on higher export sales. The company expects debottlenecking rail logistics at Strathcona to raise utilisation by year end.
Free cash flow of USD 2,566 million covered dividends and share buybacks
Operating cash flow in the third quarter of 2026 was USD 2,297.9 million, and free cash flow was CAD 2,566 million. Free cash flow rose from CAD 1,316 million a year earlier. The increase was driven by higher profit rather than by working capital: changes in operating assets and liabilities contributed only CAD 271 million.
Capital expenditure was CAD 668 million versus CAD 505 million a year earlier. The increase is linked to upstream and downstream projects, including the renewable diesel facility. Free cash flow comfortably covered dividends of CAD 420 million and share buybacks of CAD 2,086 million.
The company returned CAD 2,506 million to shareholders in the quarter. Buybacks are running under an accelerated NCIB programme, which is expected to be completed before year end. The cash balance at quarter end was CAD 2,893 million versus CAD 1,861 million a year earlier. Leverage is moderate: net debt to LTM EBITDA at 0.29.
Leverage is moderate: net debt to LTM EBITDA at 0.29
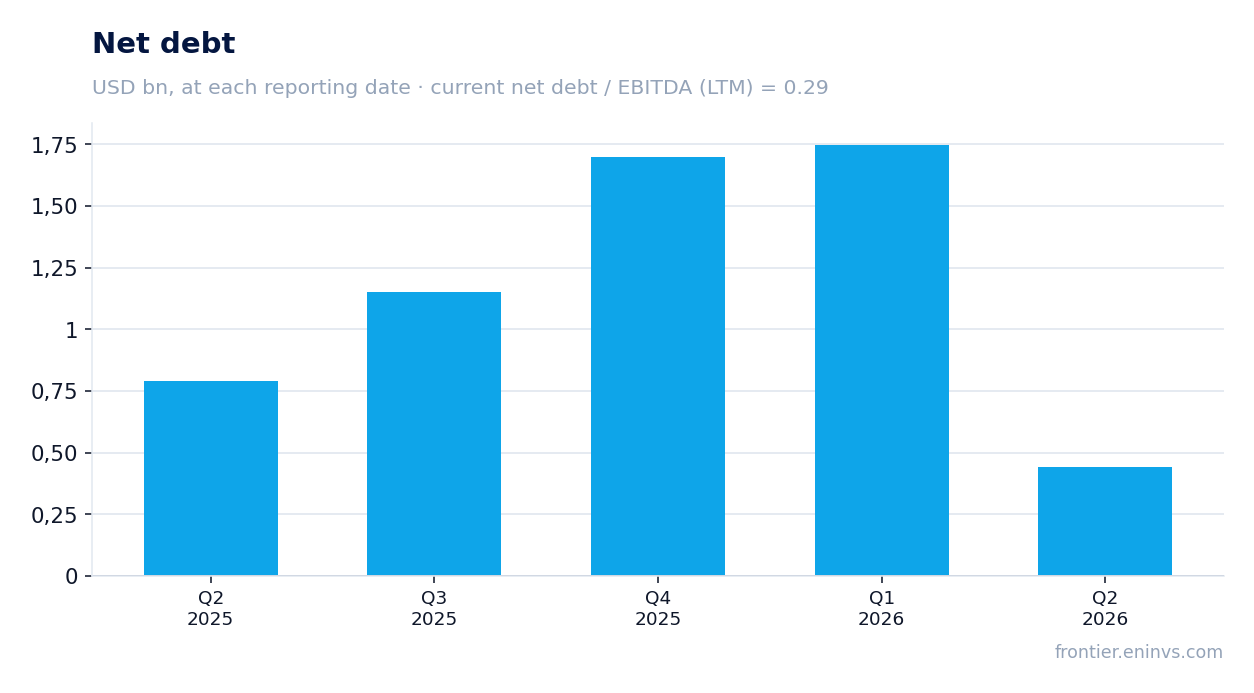
Net debt at the latest annual balance sheet date was USD 1,697.3 million, and the ratio of net debt to trailing-twelve-month EBITDA was 0.29. This is a low level for an oil and gas company. Total debt at 30 September 2026 was CAD 3,984 million, and shareholders' equity was CAD 24,467 million.
Trailing-twelve-month EBITDA was USD 5,788.8 million, covering net debt almost four times over. Interest expense is not disclosed in the source, but at this debt level it is not a significant factor for profit. Rating agencies are not mentioned in the release.
Cash flow supports debt servicing. Operating cash flow over the last twelve months was USD 6,170.4 million, more than three times net debt. The company increased its cash cushion to CAD 2,893 million, providing room for further buybacks and shareholder returns.
The share trades above its own history: EV/EBITDA 11.4 versus the 7.8 average
The trailing-twelve-month EV/EBITDA multiple is 11.4, which is 46% above its own three-year average of 7.8. The share trades more expensively than usual relative to its own history. The trailing P/E is 14.7, also above historical levels, although the three-year average for P/E is not given in the facts.
Market capitalisation is USD 64,182.4 million, and the trailing-twelve-month dividend yield is 1.82%. The yield is modest for an oil and gas company, which is explained by the high level of buybacks: the company returns capital mainly through buybacks rather than dividends. Return on equity is 40.5%, reflecting high profitability on a low equity base.
On the portal's model, the share's fair value corresponds to the current price, implying 0% upside. The model re-prices EBITDA at current commodity prices at the target EV/EBITDA. This means the market already prices in the current level of oil prices and refining margins. For the share to rise, either higher prices or a sustained improvement in operating performance would be needed.
Valuation on the latest reported figures
| Metric | Value |
|---|---|
| Market cap | 64.2 bn USD |
| P/E (LTM) | 14.7 |
| EV/EBITDA (LTM) | 11.4 |
| P/B | 3.95 |
| Net debt / EBITDA (LTM) | 0.29 |
| Operating cash flow (LTM) | 6.17 bn |
| ROE | 40.5% |
| Dividend yield (12m) | 1.8% |
| EV/EBITDA, 3-year average | 7.8 |
Bottom line
What was strong in the report was everything related to cash: free cash flow of CAD 2,566 million comfortably covered dividends and buybacks, and net debt to LTM EBITDA is just 0.29. But the 4.5x profit increase is largely due to one-off charges in the base period and high oil prices rather than to improved operating performance: production fell and refinery utilisation declined. The real question for a holder now is not the reported quarter but whether oil prices hold at current levels and whether the company can restore volumes after the outages. At an EV/EBITDA of 11.4 against its own three-year average of 7.8 the share looks expensive, and the verdict is neutral.
Open the company's financial profile IMO →
See also: market overview · valuation map · stock screeners