International Seaways: rates tripled, yet earnings came in at half of what the price implied
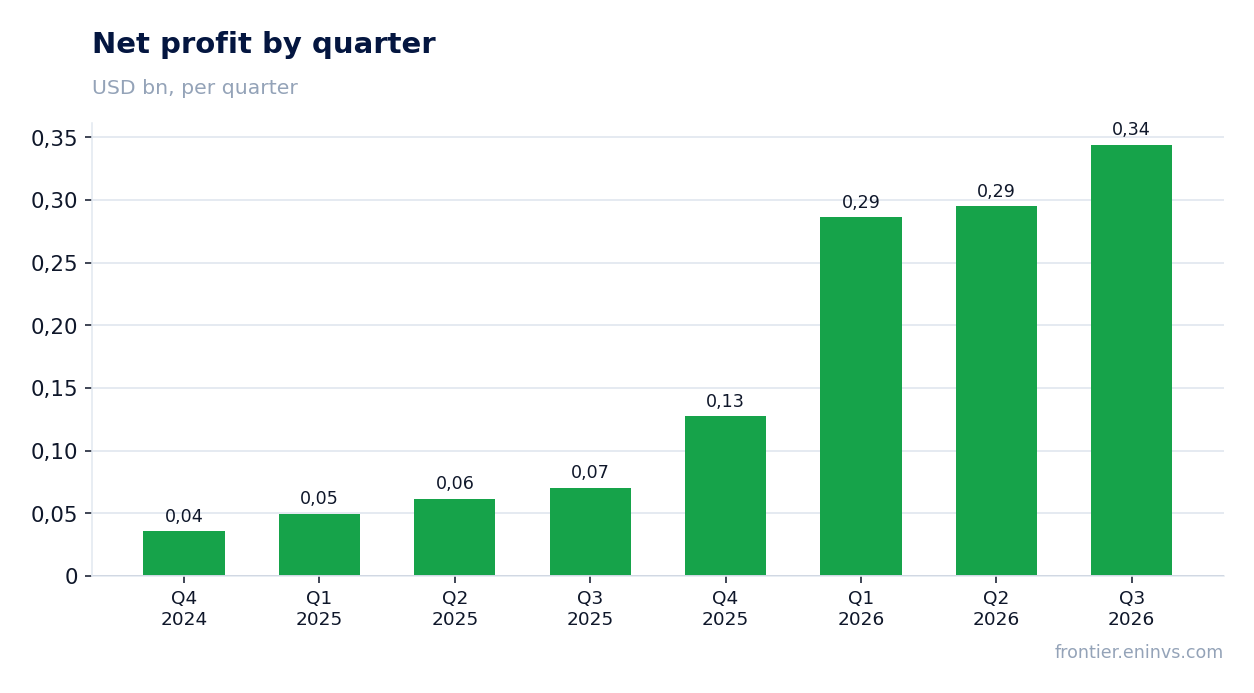
On 5 November International Seaways reported third-quarter 2026 results. The average VLCC TD3C rate on the Arabian Gulf–China route was $641,110 per day against $48,492 a year earlier, LR1 TC5 $120,352 against $25,466, and Suezmax TD20 $140,436 against $40,542. Revenue rose 146.0% to $483.2m, EBITDA 269.7% to $392.6m and net profit 388.0% to $344.2m. On our calculation, at year-ago volumes and costs those prices implied $996.2m of revenue and $906m of EBITDA, so the company earned roughly half the price-implied benchmark. The share looks neutral: EV/EBITDA of 4.6 matches its own three-year average of 4.5, and the gap to the price-implied figure keeps the valuation from re-rating higher.
Key takeaways
— Rates on all three key routes multiplied, and spot today is twice the quarterly average
— On our calculation, the quarter's prices at year-ago volumes implied $906m of EBITDA – the company earned $392.6m
— Revenue rose 146.0%, and the acceleration from 138.8% in the second quarter came from rates, not volumes
— The 81.3% EBITDA margin against 54.1% a year earlier is the rate effect on nearly flat vessel costs
— Of the $344.2m net profit, $52.8m came from vessel sales and a further $3.9m from revaluing the Bruton stake
— Net debt of $543.3m is 0.48x trailing EBITDA, and 0.23x at current prices
— The $5.05 per share dividend and a 13.3% trailing yield are the main argument for the share
Attractiveness
Key figures, USD bn
| Metric | Q3 2025 | Q3 2026 | Change |
|---|---|---|---|
| Revenue | 0.20 | 0.48 | +146.0% |
| EBITDA | 0.11 | 0.39 | +269.7% |
| Operating profit | 0.07 | 0.35 | +440.3% |
| Net profit | 0.07 | 0.34 | +388.0% |
| Operating cash flow | 0.08 | 0.24 | +210.3% |
| Capex | 0.09 | — | — |
| EBITDA margin | 54.1% | 81.3% | +27.2 pp |
| Net margin | 35.9% | 71.2% | +35.3 pp |
Rates on all three key routes multiplied, and spot today is twice the quarterly average
The average VLCC TD3C rate on the Arabian Gulf–China route was $641,110 per day in the third quarter against $48,492 a year earlier, up 1222.1%. Against the previous quarter the gain is smaller – 46.1% from $438,830. On LR1 TC5 Arabian Gulf–Japan the rate was $120,352 against $25,466 (+372.6%), and on Suezmax TD20 West Africa–UK Continent $140,436 against $40,542 (+246.4%).
Spot has not cooled after the quarter: on 30 October VLCC stood at $1,347,500 per day, 110.2% above the reported-period average, Suezmax at $429,250 (+205.7%) and LR1 at $244,750 (+103.4%). For the company this means the fourth quarter opens at prices twice those that already produced record profit.
In the release the company attributes the rate surge to disrupted supply routes; it gives no volume figures. For a holder what matters more is that the quarter's price backdrop was exceptional, and it, not fleet growth, set the result.
Commodity prices: period average and now
| Benchmark | Year ago | Q3 2026 | YoY | Spot 2026-10-30 |
|---|---|---|---|---|
| VLCC TD3C AG-China TCE, USD/day, USD | 48 492 | 641 110 | +1222,1% | 1 347 500 |
| LR1 TC5 AG-Japan TCE, USD/day, USD | 25 466 | 120 352 | +372,6% | 244 750 |
| Suezmax TD20 WAF-UKC TCE, USD/day, USD | 40 542 | 140 436 | +246,4% | 429 250 |
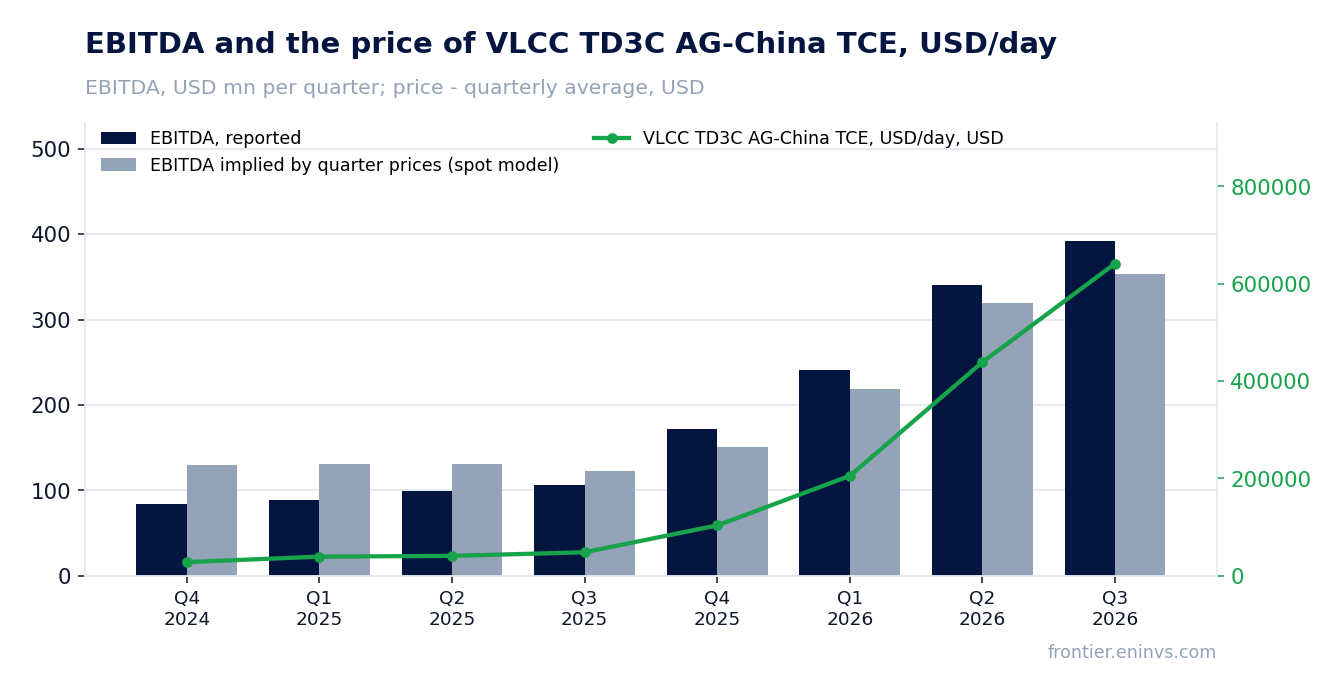
On our calculation, the quarter's prices at year-ago volumes implied $906m of EBITDA – the company earned $392.6m
Holding third-quarter 2025 volumes and costs and moving only the reported period's prices, revenue would have been $996.2m and EBITDA $906m. The company actually reported $483.2m of revenue and $392.6m of EBITDA, $513.0m and $513.4m below the price-implied figure. The 56.7% EBITDA gap is the main question the report raises.
Part of the gap is revenue mix: $153.7m came from voyage charters, where port and bunker costs ($40.6m) are deducted from revenue, while a year earlier such voyages were few. Realised rates also sit below the benchmark: VLCC spot $154,597 per day against the $641,110 TD3C average, Suezmax $102,501 against $140,436. The fleet trades in pools and on time charters, so the benchmark and actual revenue diverge.
The portal's spot model, re-priced from the average of the previous four quarters, expected $353.6m of EBITDA and $455.3m of revenue; the actual came in 11.0% and 6.1% above. That model tracks the run-rate rather than the quarter's price and so disagrees with the year-ago calculation. We treat the price-implied figure as the benchmark: it shows how much the company leaves on the table relative to what the rates themselves deliver.
What the prices implied and what the company earned
| Base (Q3 2025) | Implied at period prices | Reported | Reported vs implied | |
|---|---|---|---|---|
| Revenue, USD mn | 196,4 | 996,2 | 483,2 | -51,5% |
| EBITDA, USD mn | 106,2 | 906,0 | 392,6 | -56,7% |
| EBITDA, portal spot model, USD mn | — | 353,6 | 392,6 | +11,0% |
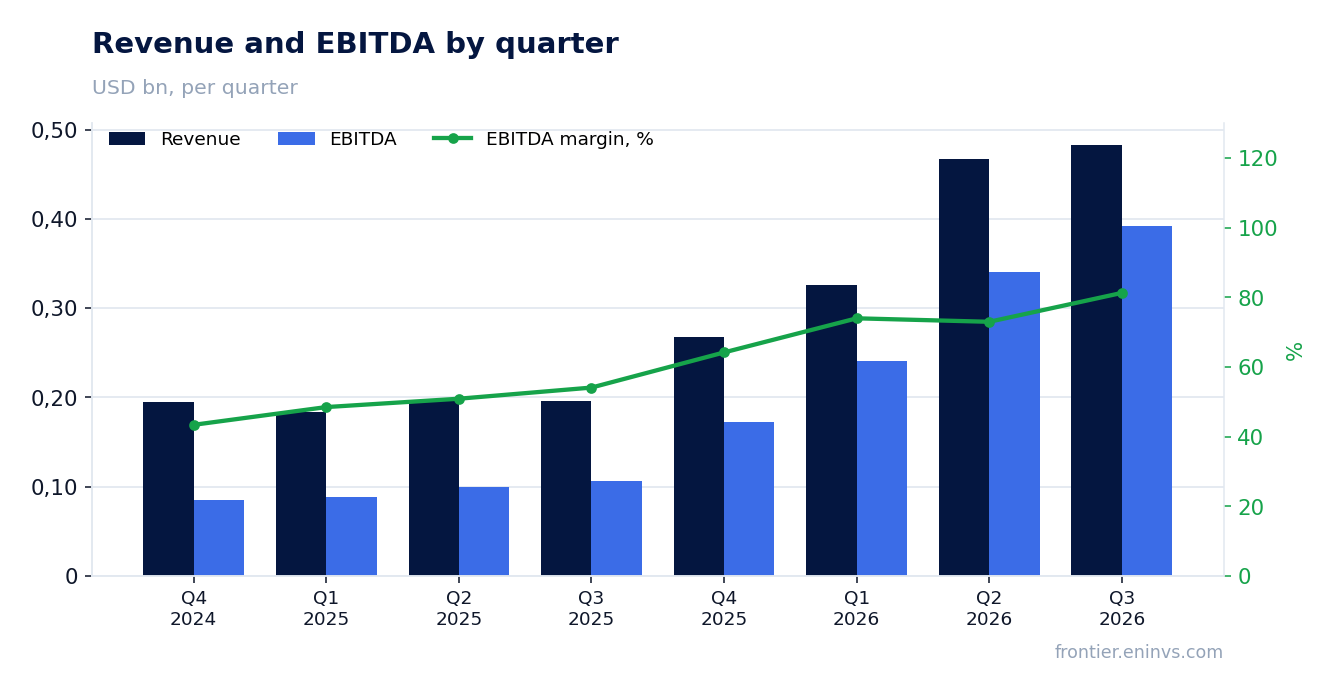
Revenue rose 146.0%, and the acceleration from 138.8% in the second quarter came from rates, not volumes
Third-quarter revenue was $483.2m against $196.4m a year earlier, up 146.0%. In the second quarter growth was 138.8%, so the pace accelerated. Both figures are a rate effect: revenue days fell to 5,840 from 6,245 a year earlier, meaning volumes declined.
The crude tanker segment generated $359m of revenue against $96m a year earlier, product carriers $124m against $100m. The difference in pace reflects fleet mix: VLCCs and Suezmaxes benefited more from the rate surge than MRs and LR1s. The company also cites roughly $75m higher profit-sharing on time charters – revenue tied to the spot market.
Fewer revenue days alongside a threefold revenue increase is the defining feature of the quarter: the company earned not by carrying more cargo but by charging more for each voyage. For the next quarter this means repeating the result depends on rates holding, not on fleet utilisation.
Production, realised price and unit cost (company release)
| Metric | Year ago | Reported period | YoY |
|---|---|---|---|
| VLCC Average TCE Rate (spot), $ per day | 34 809 | 154 597 | +344,1% |
| VLCC Average TCE Rate (fixed), $ per day | 41 552 | 315 258 | +658,7% |
| Suezmax Average TCE Rate (spot), $ per day | 33 310 | 102 501 | +207,7% |
The 81.3% EBITDA margin against 54.1% a year earlier is the rate effect on nearly flat vessel costs
Reported EBITDA was $392.6m, a margin of 81.3% against 54.1% a year earlier. Operating profit reached $351.3m and net profit $344.2m, a net margin of 71.2% against 35.9%. Such margin expansion on tripled revenue means fixed costs barely moved.
Vessel expenses were $64.1m against $65.8m a year earlier – they even declined slightly. General and administrative costs rose to $19.6m from $11.8m, small against revenue. Voyage expenses jumped to $40.6m from $3.9m, but they are deducted from revenue in TCE and barely affect EBITDA.
Depreciation stayed at $41.3m, so EBITDA exceeds operating profit by exactly that amount. Other income and charges – interest, taxes – sit below operating profit and do not affect EBITDA; they explain the difference between operating and net profit. Interest expense was $11.4m.
Of the $344.2m net profit, $52.8m came from vessel sales and a further $3.9m from revaluing the Bruton stake
Net profit for the quarter was $344.2m, or $6.90 per diluted share. It included a $52.8m gain on disposal of vessels and other assets; for the nine months such gains totalled $140.9m. Adjusted profit excluding these items was $291.4m, or $5.84 per share.
The revaluation of the previously held Bruton stake added $3.9m, but that item belongs to the nine months, not the quarter. The sale of a 2012-built Suezmax brought $74m net and a $53m gain – a one-off that flatters the reported result but will not repeat.
For earnings quality the adjusted figure matters: $291.4m is what the company earned from transportation. The $52.8m gap to reported profit is the price of selling older tonnage, which also removes future revenue.
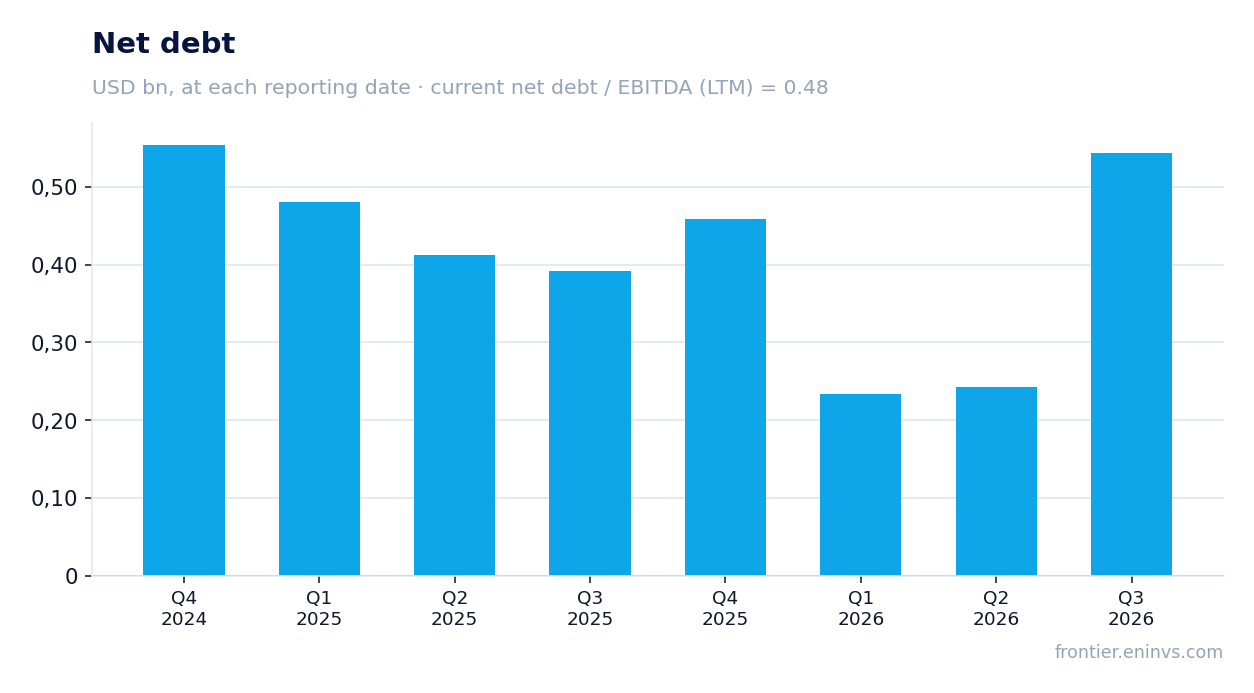
Net debt of $543.3m is 0.48x trailing EBITDA, and 0.23x at current prices
At 30 September net debt was $543.3m against $243.4m at 30 June, an increase of $0.3bn. A year earlier, at 30 September 2025, it was $391.3m, so over 12 months it rose by $0.2bn. Net debt to trailing EBITDA is 0.48x, and 0.23x at current prices.
The increase funded new vessels: the company drew $73m under the Korean ECA facility for two LR1 deliveries and spent $199.3m on vessels and construction over nine months. Liquidity remains high at $964m, including $454m of cash and short-term investments and $510m of undrawn revolver capacity.
Operating cash flow was $243.0m for the quarter and $651.8m for nine months. The company puts free cash flow at $234.1m for the quarter. Interest expense of $11.4m against such EBITDA creates no strain. Debt is rising with the fleet, not to cover losses.
The $5.05 per share dividend and a 13.3% trailing yield are the main argument for the share
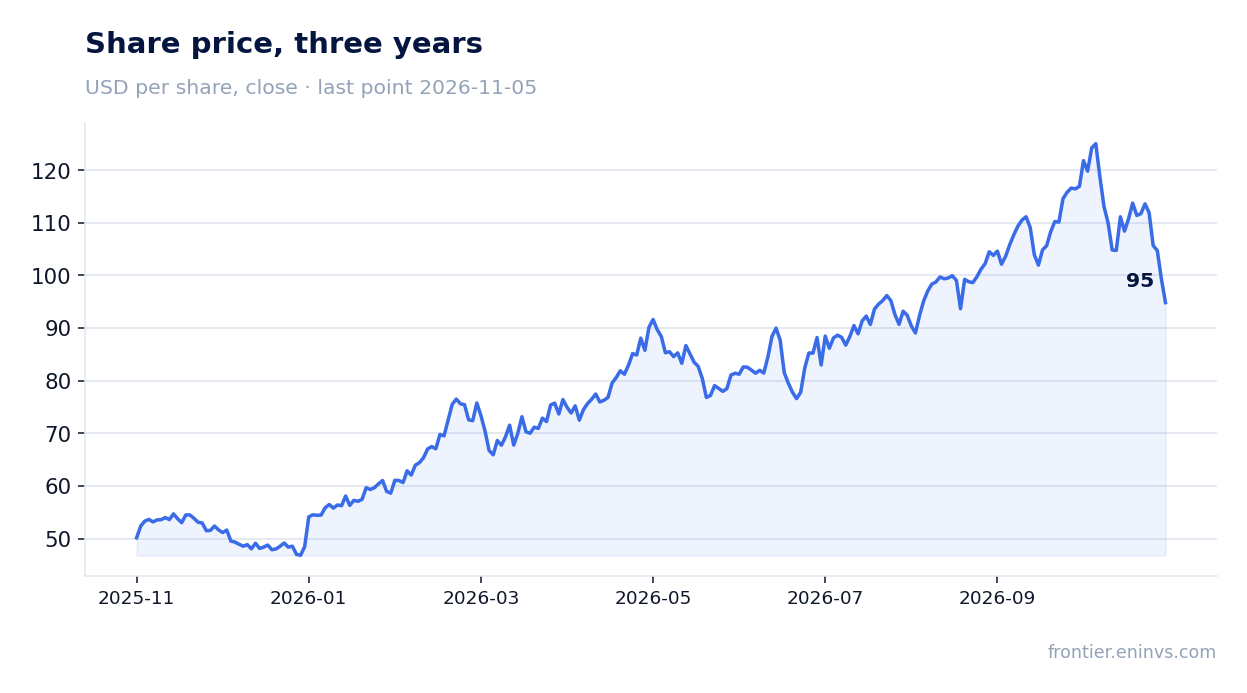
The board declared a quarterly dividend of $5.05 per share payable on 23 December 2026 – the same as the previous quarter. Nine-month payments were $11.75 per share and trailing 12-month payments $16.80, which the company calls a 22% yield at the then price. At the current price the trailing yield is 13.3%.
Our estimate for the 2026 dividend starts from the policy of paying at least 85% of adjusted profit. Nine-month adjusted profit was $780.4m, or about $15.65 per share; if rates hold, the fourth quarter could add several more dollars per share. The dividend is based on adjusted, not reported, profit, so one-off vessel sales do not increase it.
A 13.3% yield is well above the key rate, generous for a tanker company with debt at 0.48x EBITDA. The risk is that the dividend is tied to quarterly profit: a halving of rates would cut the payout base too. The company also raised its buyback programme to $100m, which supports the price.
The payout would shrink on lower rates or higher capex for new vessels. Four LR1s ordered for $244m and remaining Bruton installments of $279m are future outlays competing with the dividend for cash flow.
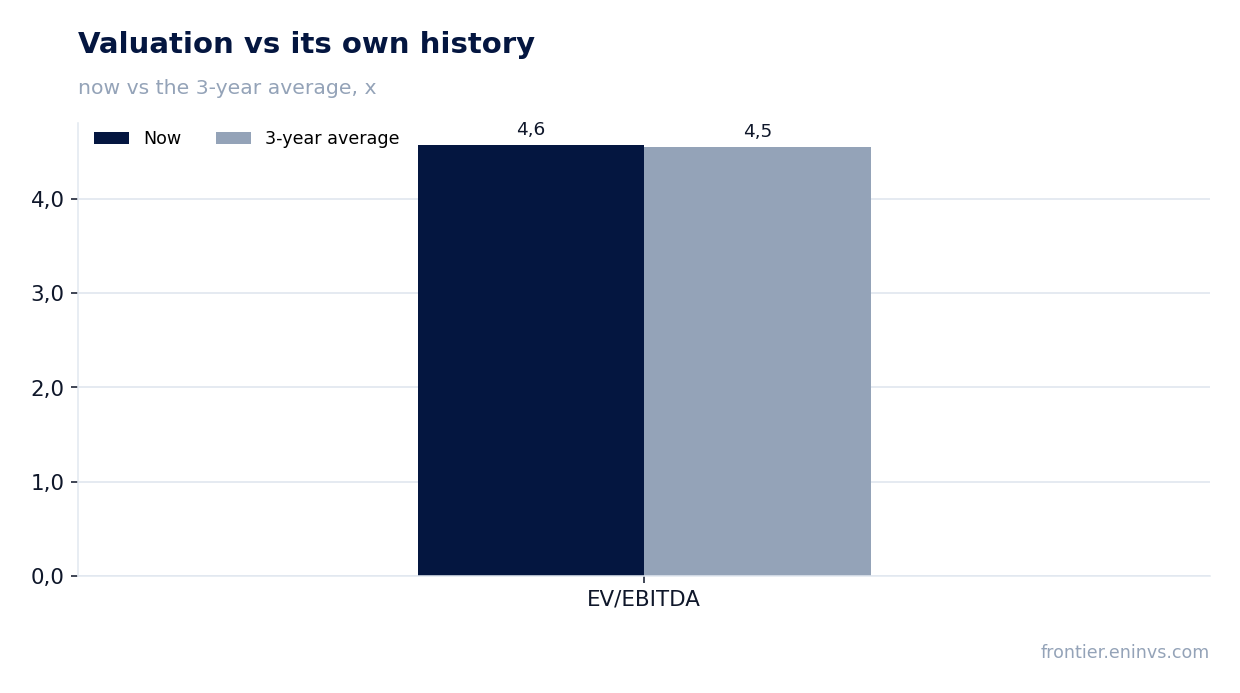
EV/EBITDA of 4.6 matches the three-year average of 4.5, and at current prices the multiple falls to 2.2
Trailing EV/EBITDA is 4.6 against a three-year average of 4.5, so the share is valued exactly as it has been historically. Trailing P/E is 4.5. These multiples rest on earnings made at past prices and so do not reflect the current rate level.
At 30 October prices the portal's spot model puts annual EBITDA at $2,404.4m against $1,146.5m over the last 12 months, more than double. On that base EV/EBITDA falls to 2.2 and net debt to EBITDA to 0.23. On the portal's model the upside to fair value is 30%.
The market is not pricing current rates: since the release the share has lost 4.5%, and the same from the release to 5 November. That is caution about rate durability, not about debt. If rates hold for a quarter, the multiple on current earnings will make the share cheap without any price move.
Valuation on the latest reported figures
| Metric | Value |
|---|---|
| Market cap | 4.70 bn USD |
| P/E (LTM) | 4.5 |
| EV/EBITDA (LTM) | 4.6 |
| P/B | 2.33 |
| Net debt / EBITDA (LTM) | 0.48 |
| Operating cash flow (LTM) | 0.80 bn |
| ROE | 19.8% |
| Dividend yield (12m) | 13.3% |
| EV/EBITDA, 3-year average | 4.5 |
Bottom line
The quarter was exceptional on rates: VLCC rates rose 13-fold year on year, and the company posted record net profit of $344.2m. But on our calculation the same prices at year-ago volumes implied $906m of EBITDA – the company earned $392.6m, and the 56.7% gap shows the fleet and pools do not fully capture the benchmark. Part of the profit is one-off: $52.8m came from vessel sales. Debt at 0.48x EBITDA poses no risk, and the 13.3% dividend yield remains the main argument. The share is valued neutrally: EV/EBITDA of 4.6 against its own three-year average of 4.5, while at current prices the multiple falls to 2.2 – the verdict would change if rates hold for another quarter or if the gap to the price-implied figure narrows.
Open the company's financial profile INSW →
See also: market overview · valuation map · stock screeners