International Petroleum: profit up 15.8x, but a one-off drove almost all of the EBITDA jump
International Petroleum's Q3 2026 results showed revenue of $211.955m (+23.0% YoY), EBITDA of $124.178m (+100.5%) and net profit of $59.896m (+1475.8%). The EBITDA margin rose to 58.6% from 35.9% a year earlier, but a jump of that size on revenue growth of only 23.0% points to a one-off in cost of sales rather than a durable improvement. At an LTM EV/EBITDA of 11.4 against its own three-year average of 6.5, the share is more expensive than its own history, so at the current price it is rated neutral.
Key takeaways
— Revenue accelerated to +23.0% YoY, but a one-off in cost of sales produced the entire EBITDA increase
— The 58.6% EBITDA margin versus 35.9% a year earlier is a low-base effect, not operating leverage
— Net profit of $59.896m rose 15.8x, and most of that increase is non-recurring
— Free cash flow of $18.293m lags profit because capital spending is still high
— Net debt of $466.345m equals 1.6x LTM EBITDA and barely moved over the quarter
— LTM EV/EBITDA of 11.4 versus its own three-year average of 6.5 puts the share 74% above its own history
— The portal model implies -15% to fair value, which outweighs a strong report
Attractiveness
Key figures, USD bn
| Metric | Q3 2025 | Q3 2026 | Change |
|---|---|---|---|
| Revenue | 0.17 | 0.21 | +23.0% |
| EBITDA | 0.06 | 0.12 | +100.5% |
| Operating profit | 0.03 | 0.09 | +235.0% |
| Net profit | 0.00 | 0.06 | +1475.8% |
| Operating cash flow | 0.04 | 0.05 | +24.6% |
| EBITDA margin | 35.9% | 58.6% | +22.7 pp |
| Net margin | 2.2% | 28.3% | +26.1 pp |
Revenue accelerated to +23.0% YoY, but a one-off in cost of sales produced the entire EBITDA increase
Q3 2026 revenue was $211.955m, up 23.0% from a year earlier. Growth accelerated from 20.8% in Q2 2026 and from a 5.2% decline in Q1 2026. Sequentially revenue actually slipped from $218.098m in Q2, so the annual growth rests on a weak Q3 2025 base of $172.297m.
Operating profit rose to $93.328m from $27.862m a year earlier, a 3.3x increase. With revenue up 23.0%, that jump means costs did not scale with sales. The gap between revenue and EBITDA was about $88.6m this quarter versus about $110.4m a year earlier, so cost of sales and cash costs per dollar of revenue fell sharply.
That cost decline, not volume, produced almost all of the EBITDA increase. Had costs stayed at the Q3 2025 level, EBITDA on $211.955m of revenue would have been about $76m, not $124.178m. The roughly $48m difference is the cost factor, which the report does not label as one-off but which cannot be durable at 23.0% revenue growth.
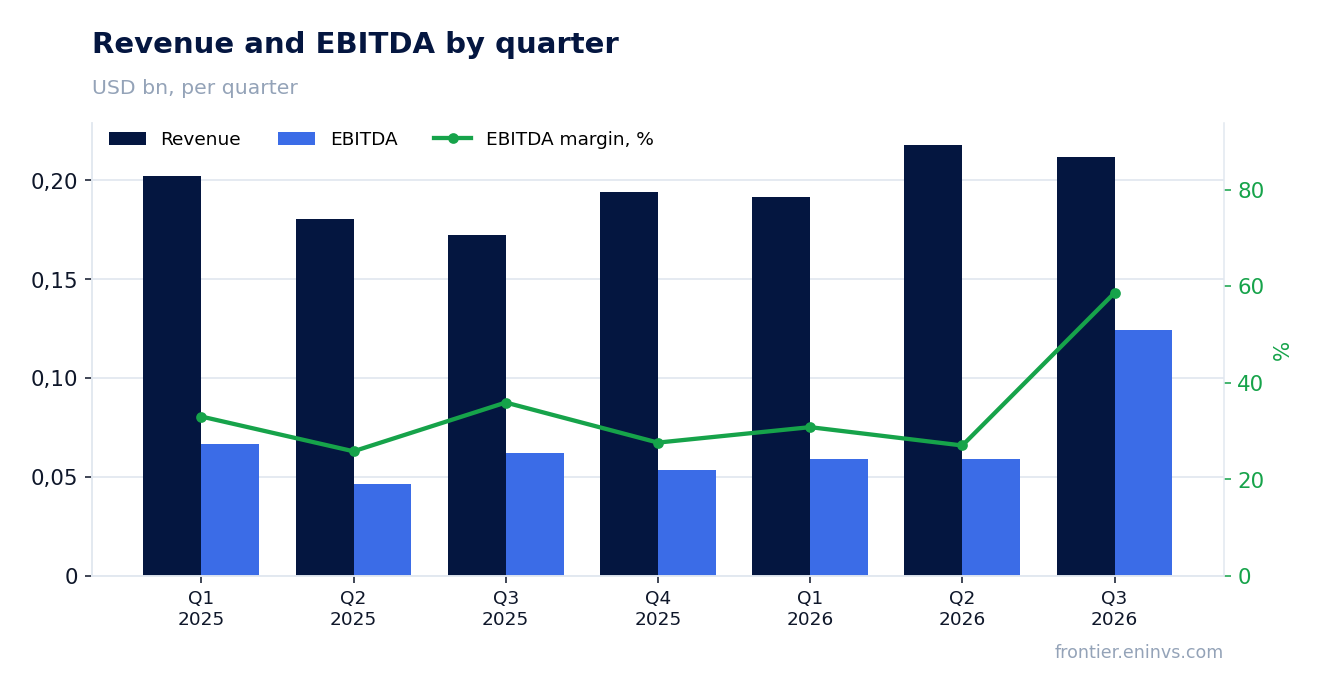
The 58.6% EBITDA margin versus 35.9% a year earlier is a low-base effect, not operating leverage
The Q3 2026 EBITDA margin was 58.6% versus 35.9% a year earlier. A 22.7 percentage point gain on 23.0% revenue growth is nearly a doubling of the margin, which cannot be explained by utilisation alone. For comparison, Q2 2026 EBITDA was $58.900m on $218.098m of revenue, a margin of about 27.0%, and Q1 2026 was about 30.8%.
The gap between Q3 and the first two quarters is so wide that it points to a one-off in the reported quarter. Cost of sales likely carried less repair, production or feedstock expense, but the facts do not give the cause. The honest statement is that the margin jumped and the report does not name the source.
For a holder this means the 58.6% margin cannot be carried into coming quarters. If Q4 2026 returns to the first-half level, EBITDA on roughly $200m of revenue would be around $55–60m, not $124m. That normalisation is the basis for a cautious view.
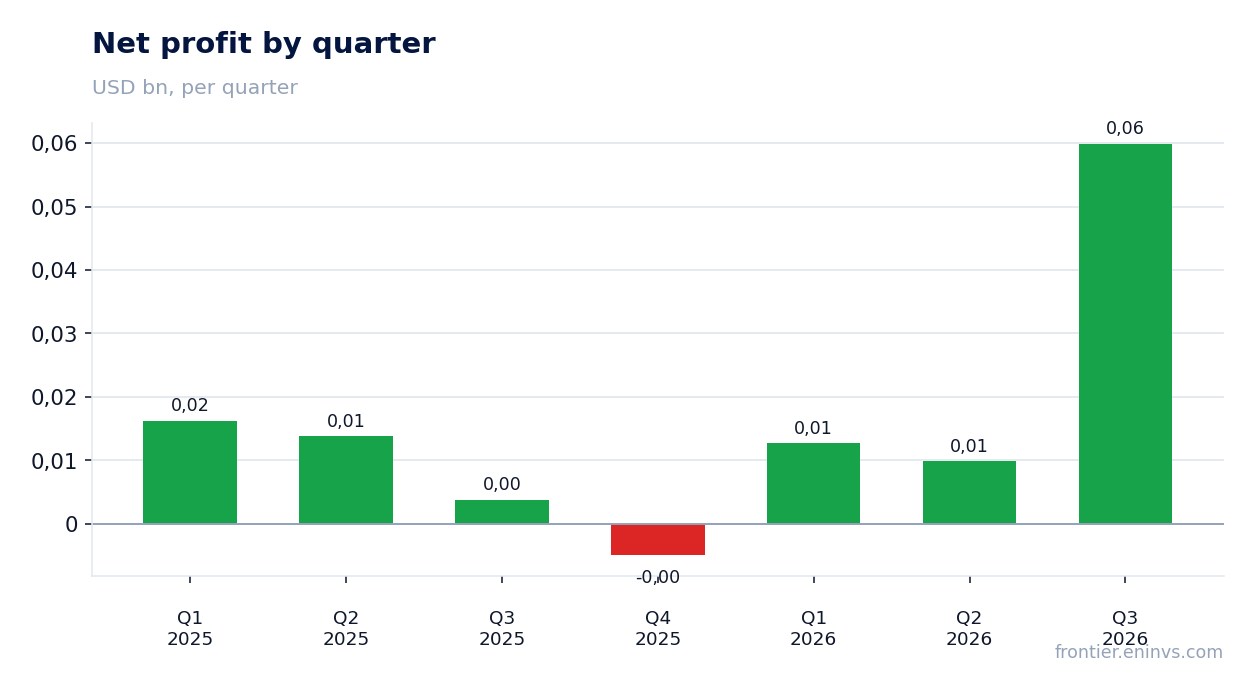
Net profit of $59.896m rose 15.8x, and most of that increase is non-recurring
Q3 2026 net profit was $59.896m versus $3.801m a year earlier, a 15.8x increase. The net margin rose to 28.3% from 2.2%. Profit growth of that size on 23.0% revenue growth is almost entirely explained by the same cost factor that inflated EBITDA, not by higher sales.
The gap between operating profit of $93.328m and net profit of $59.896m – about $33.4m – is interest and tax. A year earlier the gap between $27.862m and $3.801m was about $24.1m. Interest and tax rose only modestly, so almost all of the operating gain reached the bottom line.
Over the last twelve months net profit was $77.6m. That means one third quarter produced about 77% of the annual figure. If the one-off does not repeat, profit in coming quarters will be materially lower and the full-year number will be smaller than the current quarterly run-rate implies.
Free cash flow of $18.293m lags profit because capital spending is still high
Q3 2026 operating cash flow was $54.262m and capital expenditure was $35.969m. Free cash flow, the difference, was about $18.293m. That is well below net profit of $59.896m because capex absorbs about 17% of revenue.
Capex is falling: $70.762m in Q1 2026, $48.028m in Q2 and $35.969m in Q3. The near halving over the quarter is the main reason free cash flow stays positive despite high debt. If capex returns to the Q1 level, free cash flow could turn negative.
Operating cash flow over the last twelve months was $172.9m, which on revenue of $838.9m is a conversion of about 20.6%. That is low for a company showing a 58.6% EBITDA margin in the reported quarter, and the gap reflects both capex and working-capital movements the facts do not detail.
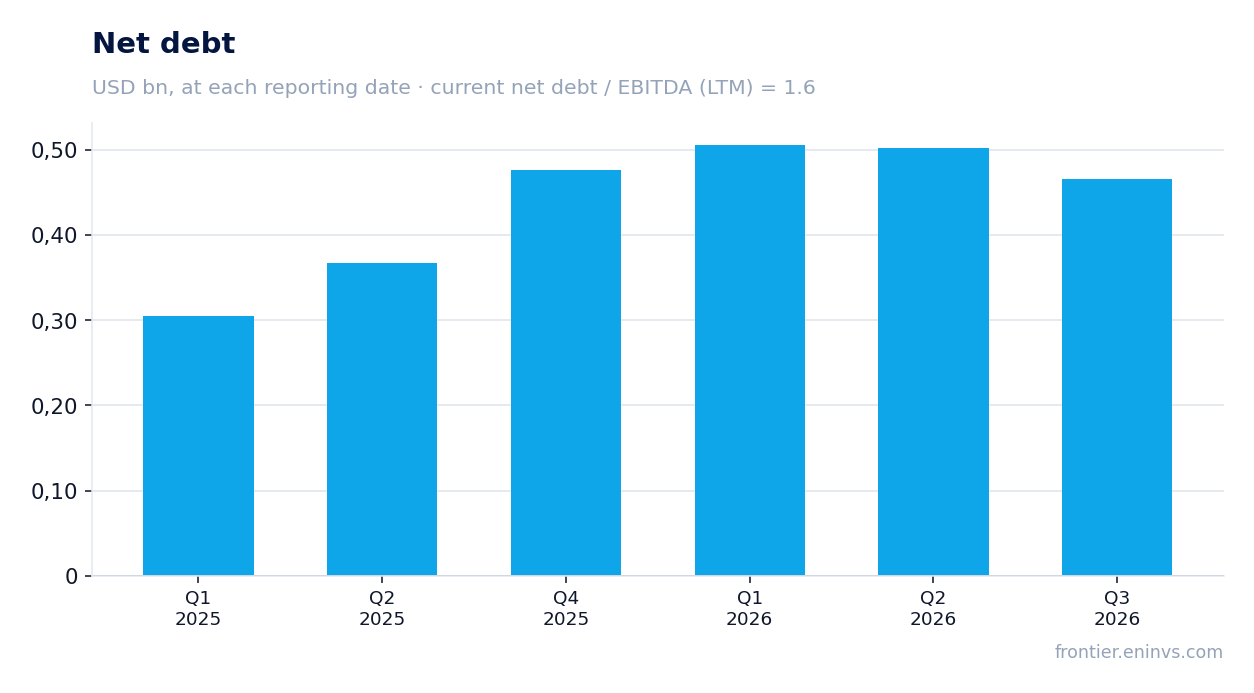
Net debt of $466.345m equals 1.6x LTM EBITDA and barely moved over the quarter
Net debt at 30 September 2026 was $466.345m versus $502.131m at 30 June 2026, a decrease of $35.786m over the quarter. Over twelve months, from 30 June 2025, net debt rose from $0.4bn to $0.5bn, about $0.1bn. The ratio of net debt to LTM EBITDA is 1.6, and that is a level, not a direction: the facts give no earlier value for the ratio.
With LTM EBITDA of $292.2m, debt of $466.345m looks moderate. But LTM EBITDA includes a quarter with a 58.6% margin, so the denominator is inflated. Stripping out the roughly $48m one-off would lift the ratio to 1.9–2.0. That is still acceptable but closer to the upper bound of comfort.
Interest expense for the quarter can be inferred from the gap between operating and net profit adjusted for tax, but the facts give no exact rate. What matters is that debt is dollar-denominated and, at current EBITDA, the company services it without strain. The risk arises if EBITDA returns to the first-half level while debt stays put.
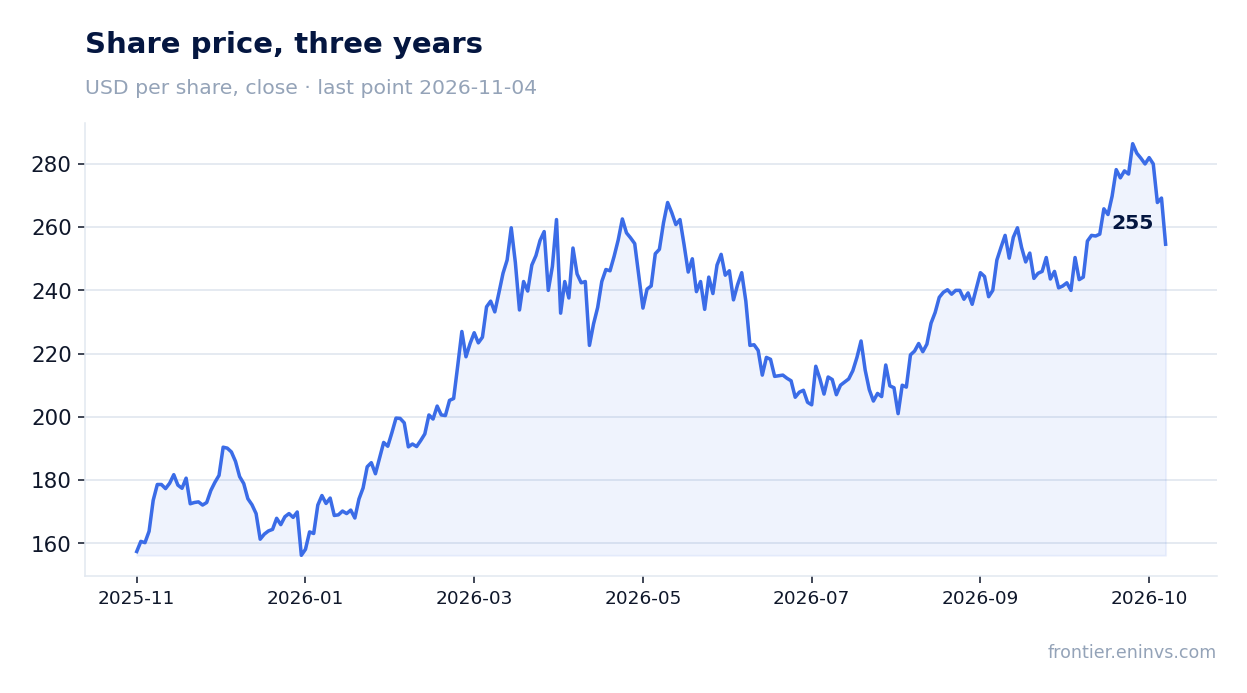
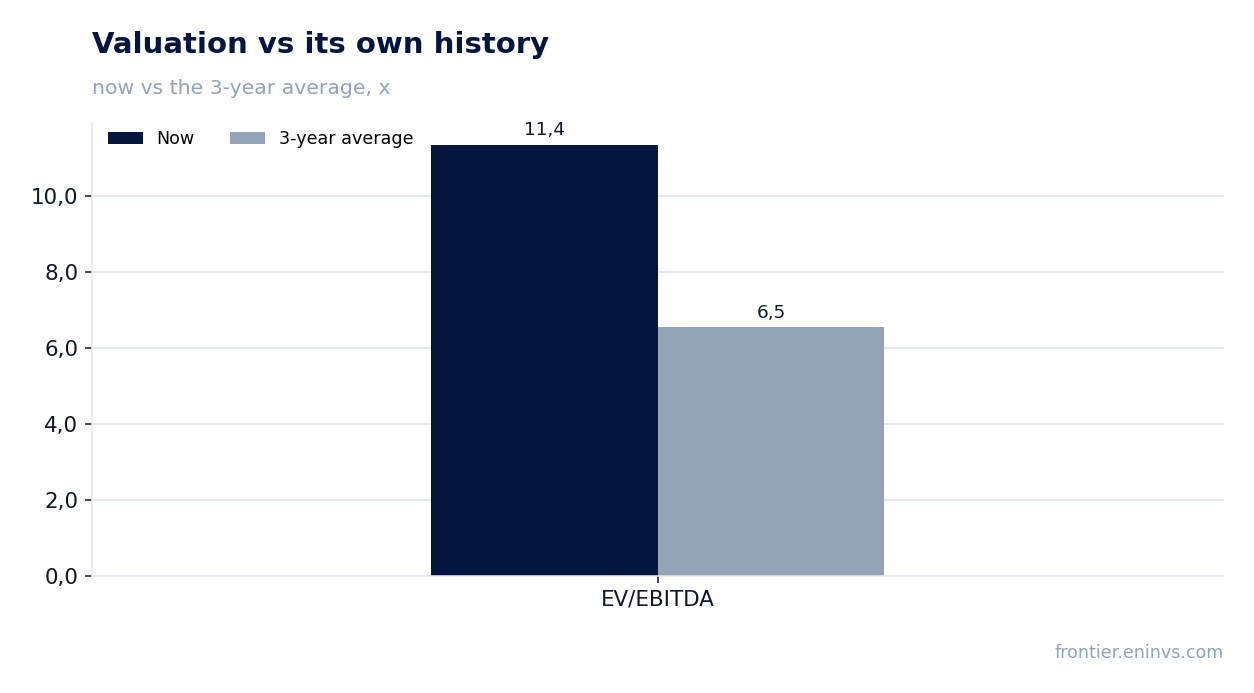
LTM EV/EBITDA of 11.4 versus its own three-year average of 6.5 puts the share 74% above its own history
The LTM EV/EBITDA multiple is 11.4 against its own three-year average of 6.5. That is 74% above the historical level. LTM P/E is 36.6, which on LTM net profit of $77.6m and a market cap of $2,841.4m reflects the same one-off quarter in the denominator.
Market cap of $2,841.4m plus net debt of $466.345m gives an enterprise value of about $3,307.7m. On LTM EBITDA of $292.2m that is the 11.4. If EBITDA normalises to about $244m, the same multiple would give an enterprise value of about $2,782m and a market cap of about $2,316m, some 18% below the current level.
That is why the current price looks expensive against its own history. The market either believes the high margin is durable or prices in revenue growth the report does not yet show. Confirmation would require the 58.6% margin to hold for at least one more quarter.
The portal model implies -15% to fair value, which outweighs a strong report
The portal model, which re-prices EBITDA at current commodity prices and the target EV/EBITDA, puts fair value 15% below the current market price. This is our own estimate, not a market consensus and not a target price. It rests on normalised EBITDA, not on the one-off quarter.
The model is consistent with the multiple: at EV/EBITDA of 11.4 against a three-year average of 6.5, the share already discounts a lot of good news. For the model to show zero upside, EBITDA would have to stay at the LTM level of $292.2m, which requires the 58.6% margin to repeat in coming quarters.
For a holder this means the current price leaves no room for error. The strong report is already in the price, and the one-off nature of the profit makes the current valuation vulnerable. If the margin normalises, the share could lose more than the 15% built into the model.
Valuation on the latest reported figures
| Metric | Value |
|---|---|
| Market cap | 2.84 bn USD |
| P/E (LTM) | 36.6 |
| EV/EBITDA (LTM) | 11.4 |
| P/B | 3.07 |
| Net debt / EBITDA (LTM) | 1.60 |
| Operating cash flow (LTM) | 0.17 bn |
| ROE | 25.8% |
| EV/EBITDA, 3-year average | 6.5 |
Bottom line
The strong side of the report was revenue: it accelerated to +23.0% YoY, and capex fell to $35.969m, supporting free cash flow. But almost all of the EBITDA and profit increase came from a one-off in cost of sales that lifted the margin to 58.6% from 35.9% a year earlier. Net debt of $466.345m at 1.6x EBITDA looks moderate, but the denominator is inflated by the one-off quarter. At EV/EBITDA of 11.4 against its own three-year average of 6.5 and -15% on the portal model, the share looks expensive against its own history. The verdict is neutral: the strong report is already in the price, and its durability is unconfirmed.
Open the company's financial profile IPCO →
See also: market overview · valuation map · stock screeners