Industrias Peñoles: silver up 58%, yet EBITDA came in 14% below what prices implied
Contents

On 10 November Industrias Peñoles reported results for the third quarter of 2026. The average gold price in the period was 4,268 USD/oz versus 3,459 a year earlier (+23.4%), silver was 62.8 versus 39.9 USD (+57.6%), zinc was 3,744 versus 2,824 USD (+32.6%). At those prices, with year-ago volumes and costs, revenue should have been 2,537.9 mn USD and EBITDA 1,263.9 mn; the company actually delivered 2,364.9 mn of revenue and 1,087.7 mn of EBITDA – 6.8% and 13.9% below the implied level. EBITDA nonetheless rose 54.4% year on year and the margin climbed to 46.0% from 35.6%. The share looks neutral: an EV/EBITDA of 3.0 is below what current metal prices imply, but the gap to the price-implied level and the retreat in prices from quarterly highs leave little room for optimism.
Key takeaways
— Silver rose 57.6% year on year, yet revenue grew only 19.5% – the price effect did not reach the top line
— At the period's prices, our calculation puts EBITDA at 1,263.9 mn USD, while the company reported 1,087.7 mn – a 13.9% gap
— EBITDA rose 54.4% year on year and the margin climbed to 46.0% from 35.6% – price gains outran cost inflation
— Net profit added only 9.8%, to 331.0 mn USD, as items below operating income absorbed part of the EBITDA gain
— Net debt turned into net cash of 781.4 mn USD, while operating cash flow for the quarter was 861.7 mn against capex of 137.9 mn
— At current metal prices EBITDA is estimated at 4,746 mn USD versus 6,329.4 mn over the last twelve months – the cushion against a price decline is thin
— Trailing twelve-month dividend yield is 0.86%, which makes the stock a metals story rather than an income one
Attractiveness
Key figures, USD bn
| Metric | Q3 2025 | Q3 2026 | Change |
|---|---|---|---|
| Revenue | 1.98 | 2.36 | +19.5% |
| EBITDA | 0.70 | 1.09 | +54.4% |
| Operating profit | 0.52 | 0.93 | +79.6% |
| Net profit | 0.30 | 0.33 | +9.8% |
| Operating cash flow | 0.42 | 0.86 | +103.3% |
| Capex | 0.14 | 0.14 | +1.4% |
| EBITDA margin | 35.6% | 46.0% | +10.4 pp |
| Net margin | 15.2% | 14.0% | -1.2 pp |
Silver rose 57.6% year on year, yet revenue grew only 19.5% – the price effect did not reach the top line
The average silver price in the third quarter of 2026 was 62.8 USD/oz versus 39.9 a year earlier, gold was 4,268 versus 3,459 USD, zinc was 3,744 versus 2,824 USD. Silver and gold together account for 61% of sales in the portal model, so such price gains should have lifted revenue noticeably.
Revenue for the quarter was 2,364.9 mn USD, up 19.5% year on year. That is well short of the rise in silver and gold prices and points either to lower sales volumes or to a realised price lagging the benchmark. The report does not disclose production or sales volumes, so the exact cause cannot be named.
The deceleration is also visible against the previous quarter: year-on-year revenue growth was 19.5% versus 38.9% in the second quarter. Silver prices fell 14.1% quarter on quarter and gold 5.5%, so part of the slowdown is the price retreat itself.
Spot is now below the period average: gold at 4,070 USD/oz (-4.6%), silver at 52.2 USD (-16.9%), zinc at 3,741 USD (-0.1%). That means next quarter's revenue will, all else equal, be lower.
Commodity prices: period average and now
| Benchmark | Year ago | Q3 2026 | YoY | Spot 2026-11-10 |
|---|---|---|---|---|
| Gold, USD | 3 459 | 4 268 | +23,4% | 4 070 |
| Silver, USD | 39,9 | 62,8 | +57,6% | 52,2 |
| Zinc, USD | 2 824 | 3 744 | +32,6% | 3 741 |
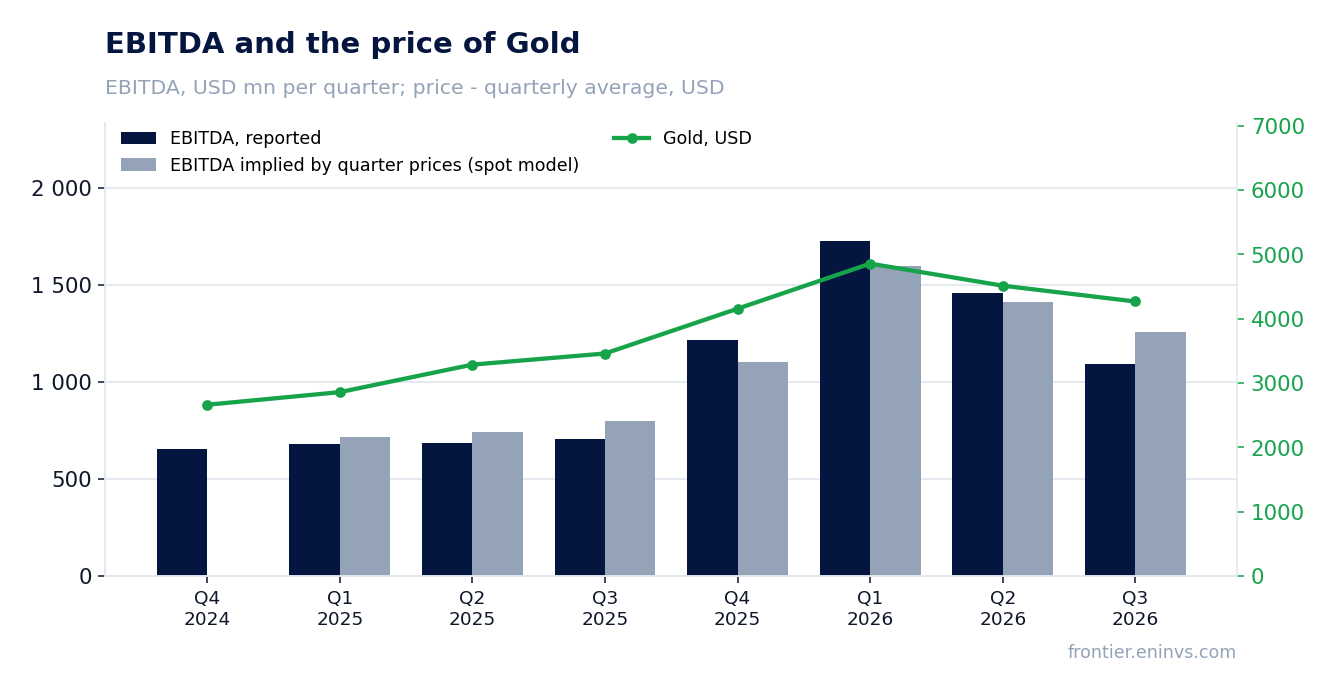
At the period's prices, our calculation puts EBITDA at 1,263.9 mn USD, while the company reported 1,087.7 mn – a 13.9% gap
Holding third-quarter 2025 volumes and costs and moving only prices to the reporting period's level would have produced revenue of 2,537.9 mn USD and EBITDA of 1,263.9 mn. Actual revenue was 172.9 mn lower and EBITDA 176.2 mn lower, or 13.9%.
The gap sits almost entirely in EBITDA rather than revenue: revenue was 6.8% below the implied level, while EBITDA was 13.9% below. That means volumes or realised prices are not the whole story – costs were higher than a year earlier and absorbed part of the price gain.
The portal's spot model, built from the average of the previous four quarters, expected EBITDA of 1,255.1 mn USD and revenue of 2,877.3 mn. Actual EBITDA of 1,087.7 mn is 13.3% below the model and revenue 17.8% below. Deviations from the model in the previous four quarters ranged from -11.6% to +8.4%, so the current gap is within normal volatility but at the lower end.
The exact cause of the gap cannot be named from the available data: the company discloses neither volumes, nor unit costs, nor any hedging effect. All that is visible is that the price gain did not fully reach EBITDA.
What the prices implied and what the company earned
| Base (Q3 2025) | Implied at period prices | Reported | Reported vs implied | |
|---|---|---|---|---|
| Revenue, USD mn | 1 978 | 2 538 | 2 365 | -6,8% |
| EBITDA, USD mn | 704,5 | 1 264 | 1 088 | -13,9% |
| EBITDA, portal spot model, USD mn | — | 1 255 | 1 088 | -13,3% |
Revenue and EBITDA by quarter
| Period | Measure | bn USD |
|---|---|---|
| Q4 2024 | Revenue | 1.886936 |
| Q1 2025 | Revenue | 1.798035 |
| Q2 2025 | Revenue | 2.0786260000000003 |
| Q3 2025 | Revenue | 1.97852 |
| Q4 2025 | Revenue | 2.7920920000000002 |
| Q1 2026 | Revenue | 3.444491 |
| Q2 2026 | Revenue | 2.8869380000000002 |
| Q3 2026 | Revenue | 2.364928 |
| Q4 2024 | EBITDA | 0.6536409999999999 |
| Q1 2025 | EBITDA | 0.680779 |
| Q2 2025 | EBITDA | 0.684244 |
| Q3 2025 | EBITDA | 0.7045340000000002 |
| Q4 2025 | EBITDA | 1.214129 |
| Q1 2026 | EBITDA | 1.7280130000000002 |
| Q2 2026 | EBITDA | 1.456742 |
| Q3 2026 | EBITDA | 1.093882 |
EBITDA margin
| Period | Measure | % |
|---|---|---|
| Q4 2024 | EBITDA margin | 34.6 |
| Q1 2025 | EBITDA margin | 37.9 |
| Q2 2025 | EBITDA margin | 32.9 |
| Q3 2025 | EBITDA margin | 35.6 |
| Q4 2025 | EBITDA margin | 43.5 |
| Q1 2026 | EBITDA margin | 50.2 |
| Q2 2026 | EBITDA margin | 50.5 |
| Q3 2026 | EBITDA margin | 46.3 |
EBITDA rose 54.4% year on year and the margin climbed to 46.0% from 35.6% – price gains outran cost inflation
EBITDA for the third quarter of 2026 was 1,087.7 mn USD versus 704.5 mn a year earlier, up 54.4%. The margin rose to 46.0% from 35.6%. That means metal price gains outran cost inflation and operating leverage worked in the company's favour.
Operating profit was 928.6 mn USD and depreciation 165.3 mn; together they make up EBITDA. Everything below operating income – other income, interest, FX – is outside EBITDA and explains net profit only.
A 46.0% margin is a very high level for a mining company and reflects above all the price environment. At current metal prices, which are below the reporting-period averages, next quarter's margin will be lower unless costs fall.
Net profit added only 9.8%, to 331.0 mn USD, as items below operating income absorbed part of the EBITDA gain
Net profit for the third quarter was 331.0 mn USD versus 301.5 mn a year earlier, up 9.8%. That is well short of the 54.4% EBITDA growth, and the difference is explained by items below operating income.
The net margin fell to 14.0% from 15.2%. With EBITDA up 54.4% and net profit up only 9.8%, other income and expenses, interest or taxes must have been less favourable than a year earlier. The company does not disclose the detail, so the specific line cannot be named.
Over the last twelve months net profit was 2,190.0 mn USD. That level was earned at higher average metal prices than today's, so it is not a good base for estimating future profit.
Net debt
at each reporting date, current net debt / EBITDA (LTM) = -0.12
| Period | Measure | bn USD |
|---|---|---|
| Q4 2024 | Net debt | 1.3258230000000002 |
| Q1 2025 | Net debt | 1.139678 |
| Q2 2025 | Net debt | 0.7182479999999996 |
| Q3 2025 | Net debt | 0.14597100000000002 |
| Q4 2025 | Net debt | −0.426306 |
| Q1 2026 | Net debt | 0.2160680000000002 |
| Q2 2026 | Net debt | −0.563103 |
| Q3 2026 | Net debt | −0.7814369999999999 |
Net debt turned into net cash of 781.4 mn USD, while operating cash flow for the quarter was 861.7 mn against capex of 137.9 mn
As of 30 September 2026 net debt was negative – minus 781.4 mn USD, i.e. net cash. On 30 June 2026 the figure was minus 563.1 mn, and on 30 September 2025 it was plus 146.0 mn. Over the year net debt fell by 0.9 bn USD.
Operating cash flow for the third quarter was 861.7 mn USD against capital expenditure of 137.9 mn. Free cash flow was therefore solidly positive, and it allowed the company to build its net cash position.
Net debt to EBITDA over the last twelve months is minus 0.12. That is a level, not a direction: the company carries no debt burden, which gives it a cushion if metal prices fall.
Capex of 137.9 mn USD is small relative to EBITDA of 1,087.7 mn. With a reserve life of 8.3 years at the current production rate, the company can sustain output without heavy investment, but it has little room to grow.
At current metal prices EBITDA is estimated at 4,746 mn USD versus 6,329.4 mn over the last twelve months – the cushion against a price decline is thin
On the portal's spot model, at today's metal prices the company's annual EBITDA would be 4,746 mn USD versus 6,329.4 mn over the last twelve months, 13.2% lower. That means the trailing twelve months were earned at higher prices, and the current valuation should start from the lower base.
At current prices EV/EBITDA is 3.5 and net debt to EBITDA is minus 0.16. A multiple of 3.5 is low for a mining company, but it also reflects the risk of further price declines: silver has already fallen 16.9% from the reporting-period average.
Market capitalisation is 17.3 bn USD. With EBITDA of 4,746 mn and net cash of 0.8 bn the company looks inexpensive, but that is a valuation at current prices, which may keep falling.
A reserve life of 8.3 years at the current production rate limits long-term visibility. The company does not disclose plans to replenish reserves, so this factor remains uncertain.
Share price, three years
close, last point 2026-11-09
| Period | Measure | USD per share |
|---|---|---|
| 2025-11-10 | Closing price | 746.010009765625 |
| 2025-11-11 | Closing price | 758.4000244140625 |
| 2025-11-12 | Closing price | 743.0999755859375 |
| 2025-11-13 | Closing price | 745.5 |
| 2025-11-14 | Closing price | 725.0 |
| 2025-11-18 | Closing price | 716.4600219726562 |
| 2025-11-19 | Closing price | 732.969970703125 |
| 2025-11-20 | Closing price | 720.0 |
| 2025-11-21 | Closing price | 727.0900268554688 |
| 2025-11-24 | Closing price | 757.0 |
| 2025-11-25 | Closing price | 752.530029296875 |
| 2025-11-26 | Closing price | 776.1300048828125 |
| 2025-11-27 | Closing price | 761.3499755859375 |
| 2025-11-28 | Closing price | 770.0 |
| 2025-12-01 | Closing price | 822.969970703125 |
| 2025-12-02 | Closing price | 784.1599731445312 |
| 2025-12-03 | Closing price | 786.4000244140625 |
| 2025-12-04 | Closing price | 793.989990234375 |
| 2025-12-05 | Closing price | 788.0999755859375 |
| 2025-12-08 | Closing price | 772.1099853515625 |
| 2025-12-09 | Closing price | 781.3400268554688 |
| 2025-12-10 | Closing price | 781.3499755859375 |
| 2025-12-11 | Closing price | 800.0 |
| 2025-12-15 | Closing price | 786.489990234375 |
| 2025-12-16 | Closing price | 785.0 |
| 2025-12-17 | Closing price | 796.0 |
| 2025-12-18 | Closing price | 803.989990234375 |
| 2025-12-19 | Closing price | 867.6400146484375 |
| 2025-12-22 | Closing price | 932.6199951171875 |
| 2025-12-23 | Closing price | 956.7999877929688 |
| 2025-12-24 | Closing price | 958.4500122070312 |
| 2025-12-26 | Closing price | 980.989990234375 |
| 2025-12-29 | Closing price | 979.97998046875 |
| 2025-12-30 | Closing price | 950.0 |
| 2025-12-31 | Closing price | 945.97998046875 |
| 2026-01-02 | Closing price | 908.0 |
| 2026-01-05 | Closing price | 947.0399780273438 |
| 2026-01-06 | Closing price | 966.030029296875 |
| 2026-01-07 | Closing price | 952.2899780273438 |
| 2026-01-08 | Closing price | 961.5900268554688 |
| 2026-01-09 | Closing price | 986.489990234375 |
| 2026-01-12 | Closing price | 1070.0 |
| 2026-01-13 | Closing price | 1058.02001953125 |
| 2026-01-14 | Closing price | 1066.300048828125 |
| 2026-01-15 | Closing price | 1049.5 |
| 2026-01-16 | Closing price | 1069.0 |
| 2026-01-19 | Closing price | 1082.010009765625 |
| 2026-01-20 | Closing price | 1115.969970703125 |
| 2026-01-21 | Closing price | 1085.0 |
| 2026-01-22 | Closing price | 1067.8900146484375 |
| 2026-01-23 | Closing price | 1075.0 |
| 2026-01-26 | Closing price | 1111.0 |
| 2026-01-27 | Closing price | 1121.1600341796875 |
| 2026-01-28 | Closing price | 1207.8499755859375 |
| 2026-01-29 | Closing price | 1169.989990234375 |
| 2026-01-30 | Closing price | 1013.0 |
| 2026-02-03 | Closing price | 1025.0 |
| 2026-02-04 | Closing price | 1032.1400146484375 |
| 2026-02-05 | Closing price | 1026.6600341796875 |
| 2026-02-06 | Closing price | 1100.0 |
| 2026-02-09 | Closing price | 1112.0 |
| 2026-02-10 | Closing price | 1080.0 |
| 2026-02-11 | Closing price | 1081.3299560546875 |
| 2026-02-12 | Closing price | 1044.1099853515625 |
| 2026-02-13 | Closing price | 1059.9000244140625 |
| 2026-02-16 | Closing price | 1036.199951171875 |
| 2026-02-17 | Closing price | 993.530029296875 |
| 2026-02-18 | Closing price | 998.9500122070312 |
| 2026-02-19 | Closing price | 1009.7100219726562 |
| 2026-02-20 | Closing price | 1013.8900146484375 |
| 2026-02-23 | Closing price | 1049.5 |
| 2026-02-24 | Closing price | 1036.0699462890625 |
| 2026-02-25 | Closing price | 1048.9000244140625 |
| 2026-02-26 | Closing price | 1045.0 |
| 2026-02-27 | Closing price | 1096.300048828125 |
| 2026-03-02 | Closing price | 1049.8299560546875 |
| 2026-03-03 | Closing price | 976.4099731445312 |
| 2026-03-04 | Closing price | 1005.0 |
| 2026-03-05 | Closing price | 930.010009765625 |
| 2026-03-06 | Closing price | 916.5 |
| 2026-03-09 | Closing price | 917.989990234375 |
| 2026-03-10 | Closing price | 966.989990234375 |
| 2026-03-11 | Closing price | 963.3400268554688 |
| 2026-03-12 | Closing price | 955.9299926757812 |
| 2026-03-13 | Closing price | 906.02001953125 |
| 2026-03-17 | Closing price | 880.7899780273438 |
| 2026-03-18 | Closing price | 858.5499877929688 |
| 2026-03-19 | Closing price | 789.5800170898438 |
| 2026-03-20 | Closing price | 800.969970703125 |
| 2026-03-23 | Closing price | 780.2899780273438 |
| 2026-03-24 | Closing price | 771.7000122070312 |
| 2026-03-25 | Closing price | 795.9099731445312 |
| 2026-03-26 | Closing price | 769.3499755859375 |
| 2026-03-27 | Closing price | 746.0399780273438 |
| 2026-03-30 | Closing price | 792.510009765625 |
| 2026-03-31 | Closing price | 798.969970703125 |
| 2026-04-01 | Closing price | 866.97998046875 |
| 2026-04-06 | Closing price | 855.760009765625 |
| 2026-04-07 | Closing price | 869.510009765625 |
| 2026-04-08 | Closing price | 930.2000122070312 |
| 2026-04-09 | Closing price | 999.989990234375 |
| 2026-04-10 | Closing price | 950.0 |
| 2026-04-13 | Closing price | 958.0 |
| 2026-04-14 | Closing price | 971.6300048828125 |
| 2026-04-15 | Closing price | 966.1900024414062 |
| 2026-04-16 | Closing price | 957.489990234375 |
| 2026-04-17 | Closing price | 1008.030029296875 |
| 2026-04-20 | Closing price | 1001.5999755859375 |
| 2026-04-21 | Closing price | 970.010009765625 |
| 2026-04-23 | Closing price | 945.02001953125 |
| 2026-04-24 | Closing price | 966.9500122070312 |
| 2026-04-27 | Closing price | 951.6099853515625 |
| 2026-04-28 | Closing price | 909.3099975585938 |
| 2026-04-29 | Closing price | 884.2899780273438 |
| 2026-04-30 | Closing price | 886.0 |
| 2026-05-04 | Closing price | 873.2000122070312 |
| 2026-05-05 | Closing price | 894.530029296875 |
| 2026-05-06 | Closing price | 975.0900268554688 |
| 2026-05-07 | Closing price | 1022.0 |
| 2026-05-08 | Closing price | 1016.0 |
| 2026-05-11 | Closing price | 1042.1600341796875 |
| 2026-05-12 | Closing price | 1045.0 |
| 2026-05-13 | Closing price | 1058.5799560546875 |
| 2026-05-14 | Closing price | 1024.47998046875 |
| 2026-05-15 | Closing price | 951.989990234375 |
| 2026-05-18 | Closing price | 946.8699951171875 |
| 2026-05-19 | Closing price | 942.0999755859375 |
| 2026-05-20 | Closing price | 969.9299926757812 |
| 2026-05-21 | Closing price | 967.489990234375 |
| 2026-05-22 | Closing price | 933.6799926757812 |
| 2026-05-25 | Closing price | 932.8099975585938 |
| 2026-05-26 | Closing price | 950.989990234375 |
| 2026-05-27 | Closing price | 987.97998046875 |
| 2026-05-28 | Closing price | 978.010009765625 |
| 2026-05-29 | Closing price | 1010.0 |
| 2026-06-01 | Closing price | 963.0 |
| 2026-06-02 | Closing price | 976.280029296875 |
| 2026-06-03 | Closing price | 953.0 |
| 2026-06-04 | Closing price | 902.47998046875 |
| 2026-06-05 | Closing price | 839.0999755859375 |
| 2026-06-08 | Closing price | 844.25 |
| 2026-06-09 | Closing price | 810.3400268554688 |
| 2026-06-10 | Closing price | 784.010009765625 |
| 2026-06-11 | Closing price | 804.0 |
| 2026-06-12 | Closing price | 834.7100219726562 |
| 2026-06-15 | Closing price | 853.0999755859375 |
| 2026-06-16 | Closing price | 851.3599853515625 |
| 2026-06-17 | Closing price | 826.6300048828125 |
| 2026-06-18 | Closing price | 805.3900146484375 |
| 2026-06-19 | Closing price | 804.010009765625 |
| 2026-06-22 | Closing price | 792.3300170898438 |
| 2026-06-23 | Closing price | 788.260009765625 |
| 2026-06-24 | Closing price | 751.02001953125 |
| 2026-06-25 | Closing price | 791.0 |
| 2026-06-26 | Closing price | 774.8499755859375 |
| 2026-06-29 | Closing price | 779.0999755859375 |
| 2026-06-30 | Closing price | 763.2899780273438 |
| 2026-07-01 | Closing price | 769.4099731445312 |
| 2026-07-02 | Closing price | 768.1900024414062 |
| 2026-07-03 | Closing price | 772.989990234375 |
| 2026-07-06 | Closing price | 782.22998046875 |
| 2026-07-07 | Closing price | 768.52001953125 |
| 2026-07-08 | Closing price | 769.4000244140625 |
| 2026-07-09 | Closing price | 773.760009765625 |
| 2026-07-10 | Closing price | 786.8499755859375 |
| 2026-07-13 | Closing price | 766.0599975585938 |
| 2026-07-14 | Closing price | 782.260009765625 |
| 2026-07-15 | Closing price | 773.0499877929688 |
| 2026-07-16 | Closing price | 775.3800048828125 |
| 2026-07-17 | Closing price | 798.4099731445312 |
| 2026-07-20 | Closing price | 786.3200073242188 |
| 2026-07-21 | Closing price | 796.510009765625 |
| 2026-07-22 | Closing price | 815.969970703125 |
| 2026-07-23 | Closing price | 801.010009765625 |
| 2026-07-24 | Closing price | 802.27001953125 |
| 2026-07-27 | Closing price | 815.0999755859375 |
| 2026-07-28 | Closing price | 801.0 |
| 2026-07-29 | Closing price | 788.010009765625 |
| 2026-07-30 | Closing price | 815.8599853515625 |
| 2026-07-31 | Closing price | 796.3499755859375 |
| 2026-08-03 | Closing price | 794.989990234375 |
| 2026-08-04 | Closing price | 788.7999877929688 |
| 2026-08-05 | Closing price | 836.4199829101562 |
| 2026-08-06 | Closing price | 850.989990234375 |
| 2026-08-07 | Closing price | 885.97998046875 |
| 2026-08-10 | Closing price | 893.719970703125 |
| 2026-08-11 | Closing price | 884.2000122070312 |
| 2026-08-12 | Closing price | 895.9299926757812 |
| 2026-08-13 | Closing price | 870.9099731445312 |
| 2026-08-14 | Closing price | 849.6699829101562 |
| 2026-08-17 | Closing price | 856.8900146484375 |
| 2026-08-18 | Closing price | 840.2100219726562 |
| 2026-08-19 | Closing price | 860.260009765625 |
| 2026-08-20 | Closing price | 889.2000122070312 |
| 2026-08-21 | Closing price | 935.0700073242188 |
| 2026-08-24 | Closing price | 915.0499877929688 |
| 2026-08-25 | Closing price | 941.6900024414062 |
| 2026-08-26 | Closing price | 920.780029296875 |
| 2026-08-27 | Closing price | 925.22998046875 |
| 2026-08-28 | Closing price | 906.9600219726562 |
| 2026-08-31 | Closing price | 897.7999877929688 |
| 2026-09-01 | Closing price | 895.0 |
| 2026-09-02 | Closing price | 906.5900268554688 |
| 2026-09-03 | Closing price | 935.6099853515625 |
| 2026-09-04 | Closing price | 907.1699829101562 |
| 2026-09-07 | Closing price | 894.3900146484375 |
| 2026-09-08 | Closing price | 910.0 |
| 2026-09-09 | Closing price | 916.1799926757812 |
| 2026-09-10 | Closing price | 896.530029296875 |
| 2026-09-11 | Closing price | 902.030029296875 |
| 2026-09-14 | Closing price | 890.239990234375 |
| 2026-09-15 | Closing price | 857.6500244140625 |
| 2026-09-17 | Closing price | 879.7899780273438 |
| 2026-09-18 | Closing price | 900.0 |
| 2026-09-21 | Closing price | 885.3900146484375 |
| 2026-09-22 | Closing price | 905.010009765625 |
| 2026-09-23 | Closing price | 907.97998046875 |
| 2026-09-24 | Closing price | 900.0 |
| 2026-09-25 | Closing price | 900.5 |
| 2026-09-28 | Closing price | 892.3099975585938 |
| 2026-09-29 | Closing price | 892.8599853515625 |
| 2026-09-30 | Closing price | 869.010009765625 |
| 2026-10-01 | Closing price | 883.260009765625 |
| 2026-10-02 | Closing price | 883.010009765625 |
| 2026-10-05 | Closing price | 887.2100219726562 |
| 2026-10-06 | Closing price | 888.0 |
| 2026-10-07 | Closing price | 871.9400024414062 |
| 2026-10-08 | Closing price | 878.969970703125 |
| 2026-10-09 | Closing price | 912.969970703125 |
| 2026-10-12 | Closing price | 932.9500122070312 |
| 2026-10-13 | Closing price | 895.739990234375 |
| 2026-10-14 | Closing price | 867.52001953125 |
| 2026-10-15 | Closing price | 880.010009765625 |
| 2026-10-16 | Closing price | 895.5900268554688 |
| 2026-10-19 | Closing price | 896.3599853515625 |
| 2026-10-20 | Closing price | 878.010009765625 |
| 2026-10-21 | Closing price | 884.1699829101562 |
| 2026-10-22 | Closing price | 856.8200073242188 |
| 2026-10-23 | Closing price | 821.9400024414062 |
| 2026-10-26 | Closing price | 802.3099975585938 |
| 2026-10-27 | Closing price | 804.3599853515625 |
| 2026-10-28 | Closing price | 786.1900024414062 |
| 2026-10-29 | Closing price | 789.9400024414062 |
| 2026-10-30 | Closing price | 764.9500122070312 |
| 2026-11-03 | Closing price | 734.5 |
| 2026-11-04 | Closing price | 773.1599731445312 |
| 2026-11-05 | Closing price | 788.0 |
| 2026-11-06 | Closing price | 809.739990234375 |
| 2026-11-09 | Closing price | 822.9099731445312 |
Trailing twelve-month dividend yield is 0.86%, which makes the stock a metals story rather than an income one
The trailing twelve-month dividend yield was 0.86%. That is a low level and plays no role in valuing the stock. The company does pay dividends, but the amount is insignificant relative to the share price.
With net profit of 2,190.0 mn USD over the last twelve months and a market capitalisation of 17.3 bn USD, a 0.86% yield means only a small share of profit goes to dividends. The company prefers to direct funds to sustaining production and strengthening the balance sheet.
For an investor this means the return depends on metal prices, not on payouts. At current prices and with net cash the company could pay more, but its dividend policy does not provide for that.
Valuation on the latest reported figures
| Metric | Value |
|---|---|
| Market cap | 17.3 bn USD |
| P/E (LTM) | 7.9 |
| EV/EBITDA (LTM) | 3.0 |
| P/B | 4.12 |
| Net debt / EBITDA (LTM) | -0.12 |
| Operating cash flow (LTM) | 3.40 bn |
| ROE | 18.8% |
| Dividend yield (12m) | 0.9% |
Net profit by quarter
| Period | Measure | bn USD |
|---|---|---|
| Q4 2024 | Net profit | 0.09537699999999999 |
| Q1 2025 | Net profit | 0.185931 |
| Q2 2025 | Net profit | 0.333254 |
| Q3 2025 | Net profit | 0.30147399999999996 |
| Q4 2025 | Net profit | 0.55199 |
| Q1 2026 | Net profit | 0.665034 |
| Q2 2026 | Net profit | 0.642007 |
| Q3 2026 | Net profit | 0.330969 |
Bottom line
The strong points were EBITDA growth of 54.4% and a 46.0% margin – the company earned well on high silver and gold prices. But the price gain did not fully reach revenue, and EBITDA came in 13.9% below what prices implied. Net cash of 781.4 mn USD and strong operating cash flow are a cushion, but at current prices EBITDA is estimated at 4,746 mn versus 6,329.4 mn over the last twelve months. The share looks neutral: a multiple of 3.5 at current prices is inexpensive, but the risk of further metal price declines balances that argument.