Ithaca Energy: revenue and EBITDA rose, but depreciation and interest eat into profit
On August 25, Ithaca Energy released its Q2 2026 results. Revenue reached $811.1 million, EBITDA – $535.2 million, net profit – $59.7 million. The EBITDA margin rose to 66.0% from 52.8% a year earlier, and the net margin to 7.4% from 5.5%. Leverage is moderate: net debt of $1.0 billion as of June 30, 2026, with a net debt/EBITDA ratio of 0.52 for the trailing twelve months. The trailing twelve-month dividend yield is 9.7%. According to the portal's model, the stock has an upside to fair value of +45%. Given this, the stock looks attractive for income-oriented investors with moderate debt.
Key takeaways
— Revenue grew 8.7% year-on-year on higher production and hydrocarbon prices
— EBITDA rose 35.8% year-on-year, with the margin reaching 66.0%
— Net profit increased 45.3% year-on-year but remains small relative to EBITDA due to depreciation and interest
— Net debt fell to $1.0 billion as of June 30, 2026, from $1.3 billion at end-2025
— The trailing twelve-month dividend yield is 9.7%
— According to the portal's model, the stock has a +45% upside to fair value
Attractiveness
Key figures, USD bn
| Metric | Q2 2025 | Q2 2026 | Change |
|---|---|---|---|
| Revenue | 0.75 | 0.81 | +8.7% |
| EBITDA | 0.39 | 0.54 | +35.8% |
| Operating profit | 0.21 | 0.26 | +23.4% |
| Net profit | 0.04 | 0.06 | +45.3% |
| Operating cash flow | 0.57 | 0.53 | -6.6% |
| EBITDA margin | 52.8% | 66.0% | +13.2 pp |
| Net margin | 5.5% | 7.4% | +1.9 pp |
Revenue grew 8.7% year-on-year on higher production and hydrocarbon prices
Revenue for Q2 2026 was $811.1 million, up 8.7% from the same period last year. The growth was driven by both higher production and favourable hydrocarbon prices.
The company does not disclose details on production volumes and average realised prices in the provided facts, so the exact contribution of each factor is not given. However, the revenue growth is consistent with the overall trend in oil and gas prices during the reporting period.
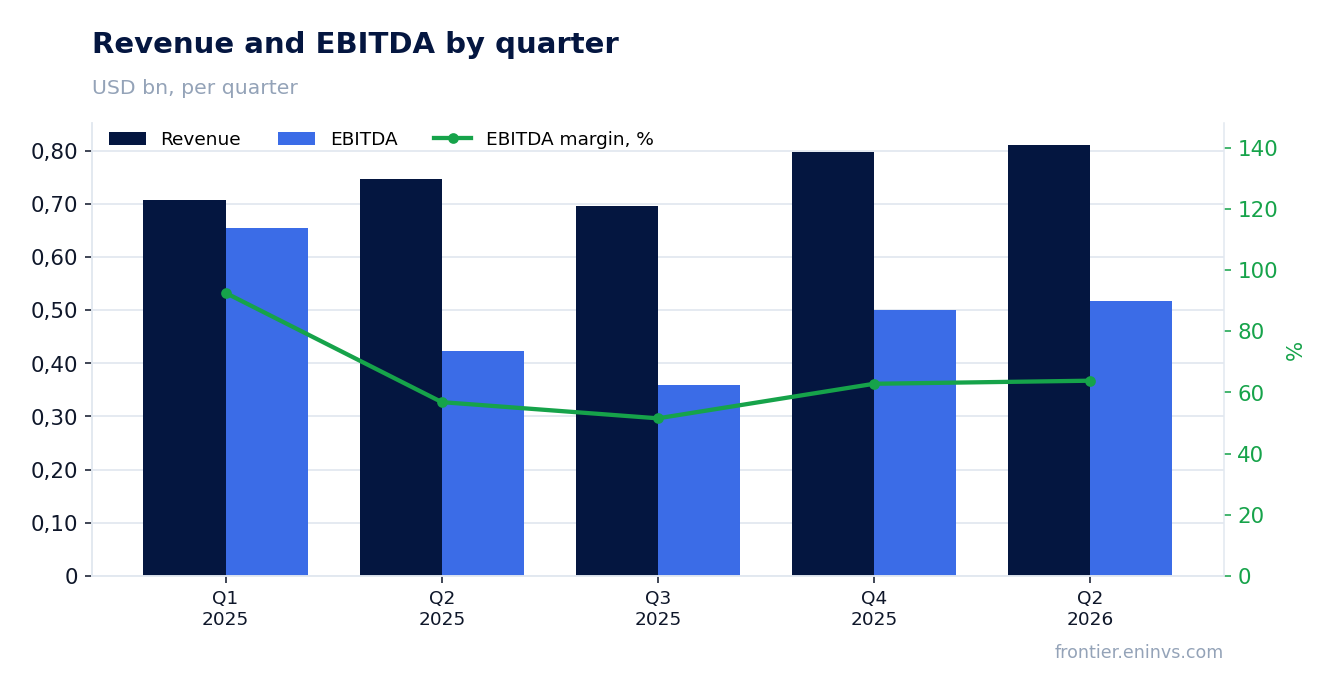
EBITDA rose 35.8% year-on-year, with the margin reaching 66.0%
EBITDA for Q2 2026 reached $535.2 million, up 35.8% year-on-year. The EBITDA margin rose to 66.0% from 52.8% a year earlier.
Such a significant margin expansion with a more modest revenue increase points to lower operating costs or an improved sales mix. The company does not disclose details, but this margin level is high for the oil and gas sector.
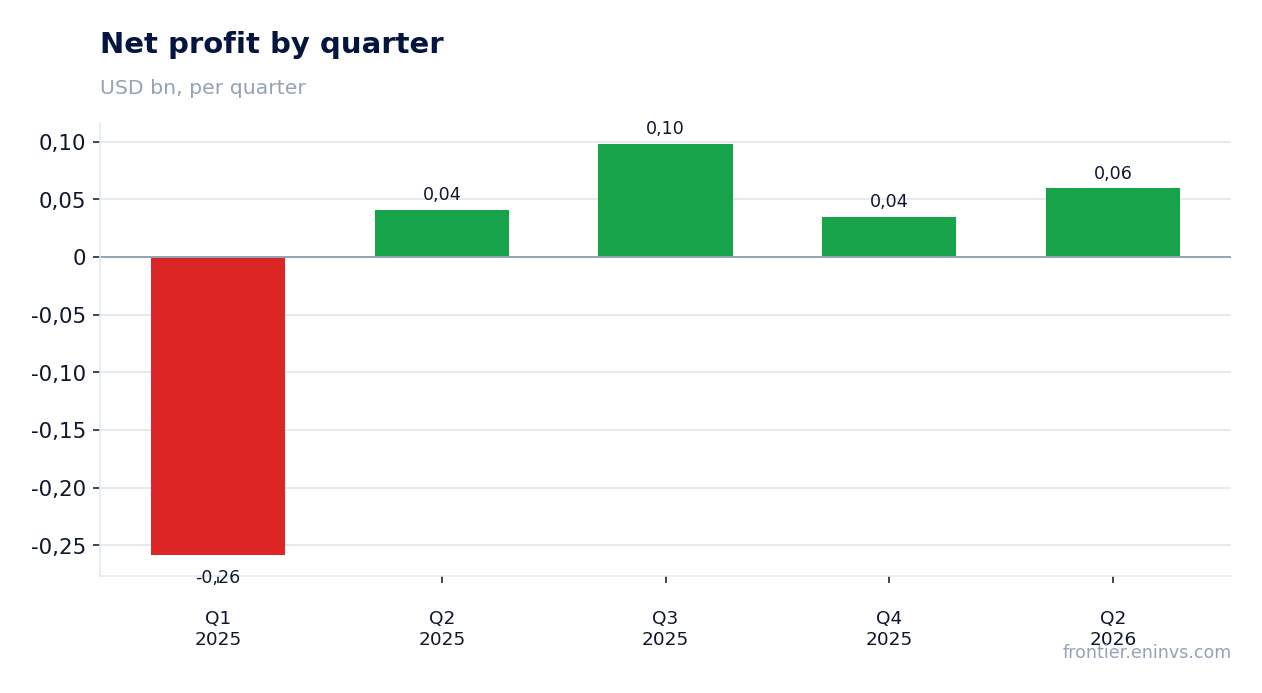
Net profit increased 45.3% year-on-year but remains small relative to EBITDA due to depreciation and interest
Net profit in Q2 2026 was $59.7 million, up 45.3% year-on-year. The net margin rose to 7.4% from 5.5%.
Despite the growth, net profit is only about 11% of EBITDA. The main deductions from EBITDA are depreciation and interest expenses, which are not disclosed in the provided facts, but their impact is significant.
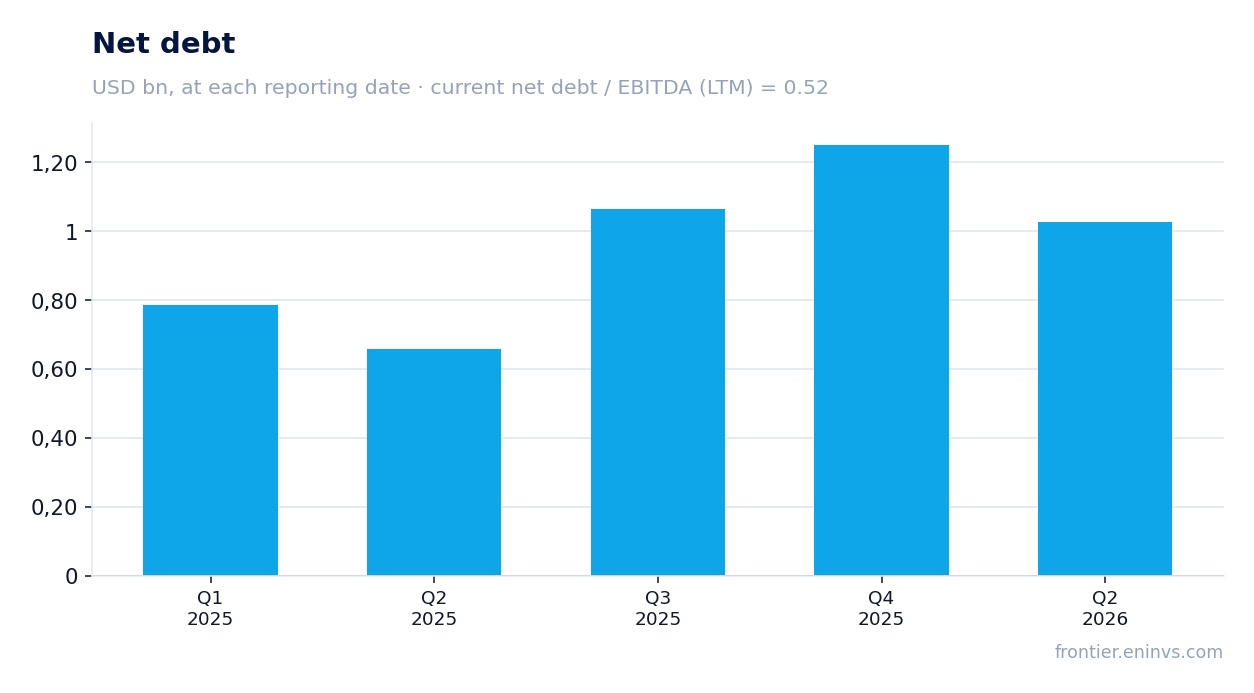
Net debt fell to $1.0 billion as of June 30, 2026, from $1.3 billion at end-2025
Net debt as of June 30, 2026, was $1.0 billion, down from $1.3 billion as of December 31, 2025. Over 12 months, net debt rose from $0.7 billion on June 30, 2025, to $1.0 billion on June 30, 2026.
The net debt/EBITDA ratio for the trailing twelve months is 0.52. This is a moderate level that does not raise concerns. Operating cash flow in Q2 2026 was $531.5 million, covering capital expenditures and dividends.
The trailing twelve-month dividend yield is 9.7%
The trailing twelve-month dividend yield is 9.7%. The company does not disclose the size of the last dividend and the period for which it was paid in the provided facts.
At the current share price and stable operating cash flow, dividend payments appear sustainable. However, the size of future dividends depends on profit and capital expenditures, which are not detailed.
According to the portal's model, the stock has a +45% upside to fair value
According to the portal's model, which re-prices EBITDA at current commodity prices at the target EV/EBITDA, the upside to fair value is estimated at +45%. This is the portal's own estimate, not a market consensus.
The current EV/EBITDA for the trailing twelve months is 3.70. This is a low multiple, which may indicate undervaluation compared to historical levels, although the exact historical average is not provided.
Valuation on the latest reported figures
| Metric | Value |
|---|---|
| Market cap | 6.02 bn USD |
| EV/EBITDA (LTM) | 3.7 |
| P/B | 2.34 |
| Net debt / EBITDA (LTM) | 0.52 |
| ROE | 9.6% |
| Dividend yield (12m) | 9.7% |
Bottom line
Bottom line: Ithaca Energy delivered strong revenue and EBITDA growth in Q2 2026, significantly improving margins. Net profit also increased but remains small relative to EBITDA due to depreciation and interest. Leverage is moderate, and a dividend yield of nearly 10% makes the stock attractive for income-oriented investors. According to the portal's model, the upside potential is 45%, supporting an 'attractive' rating.
Open the company's financial profile ITH →
See also: market overview · valuation map · stock screeners