Journey Energy: profit up 4.5x, but half the quarter came from price spread, not output
On August 25, Journey Energy reported results for the second quarter of 2026. Revenue rose 37.5% year on year to $46.5 million, EBITDA – by 95.5% to $25.8 million, net profit – by 352.9% to $13.3 million. The EBITDA margin climbed to 55.6% from 39.1% a year earlier, while net debt at June 30 stood at $30.5 million, or 0.68 times trailing twelve-month EBITDA. In our view the share looks attractive: the EV/EBITDA multiple of 6.1 is below its three-year average, and the portal model implies 34% upside to fair value.
Key takeaways
— Revenue rose 37.5% year on year to $46.5 million, with almost all the gain coming from prices rather than volumes
— EBITDA jumped 95.5% to $25.8 million, lifting the margin by 16.5 percentage points to 55.6%
— Net profit of $13.3 million was 4.5 times higher, but a $4.3 million loss a quarter earlier shows how low the base is
— Operating cash flow of $14.0 million covers capital spending, though the capex figure itself is not disclosed
— Net debt of $30.5 million, or 0.68 times trailing twelve-month EBITDA, is moderate but up from $26.0 million a year ago
— EV/EBITDA of 6.1 and P/E of 12.4 sit below their own history, while the portal model implies 34% upside to fair value
Attractiveness
Key figures, USD bn
| Metric | Q2 2025 | Q2 2026 | Change |
|---|---|---|---|
| Revenue | 0.03 | 0.05 | +37.5% |
| EBITDA | 0.01 | 0.03 | +95.5% |
| Operating profit | 0.00 | 0.01 | +230.4% |
| Net profit | 0.00 | 0.01 | +352.9% |
| Operating cash flow | 0.01 | 0.01 | +74.5% |
| EBITDA margin | 39.1% | 55.6% | +16.5 pp |
| Net margin | 8.7% | 28.6% | +19.9 pp |
Revenue rose 37.5% year on year to $46.5 million, with almost all the gain coming from prices rather than volumes
Revenue in the second quarter of 2026 came in at $46.5 million, up 37.5% from a year earlier. For comparison, first-quarter 2026 revenue was $35.9 million, so growth accelerated relative to the start of the year. The main driver was the price environment – the company does not disclose production volumes, but revenue dynamics with stable output point to higher realised prices.
Revenue growth of 37.5% is the strongest quarterly figure in at least four quarters. Revenue was $38.7 million in the third quarter of 2025, $34.1 million in the fourth, and $35.9 million in the first quarter of 2026. The second quarter of 2026 stands out clearly, suggesting a strong market factor rather than gradual organic improvement.
For an investor, it matters that this revenue growth is not accompanied by disclosed production metrics. If hydrocarbon prices stay at current levels, revenue could hold near $46 million, but any price correction would immediately hit the result. This is the key risk to the sustainability of earnings.
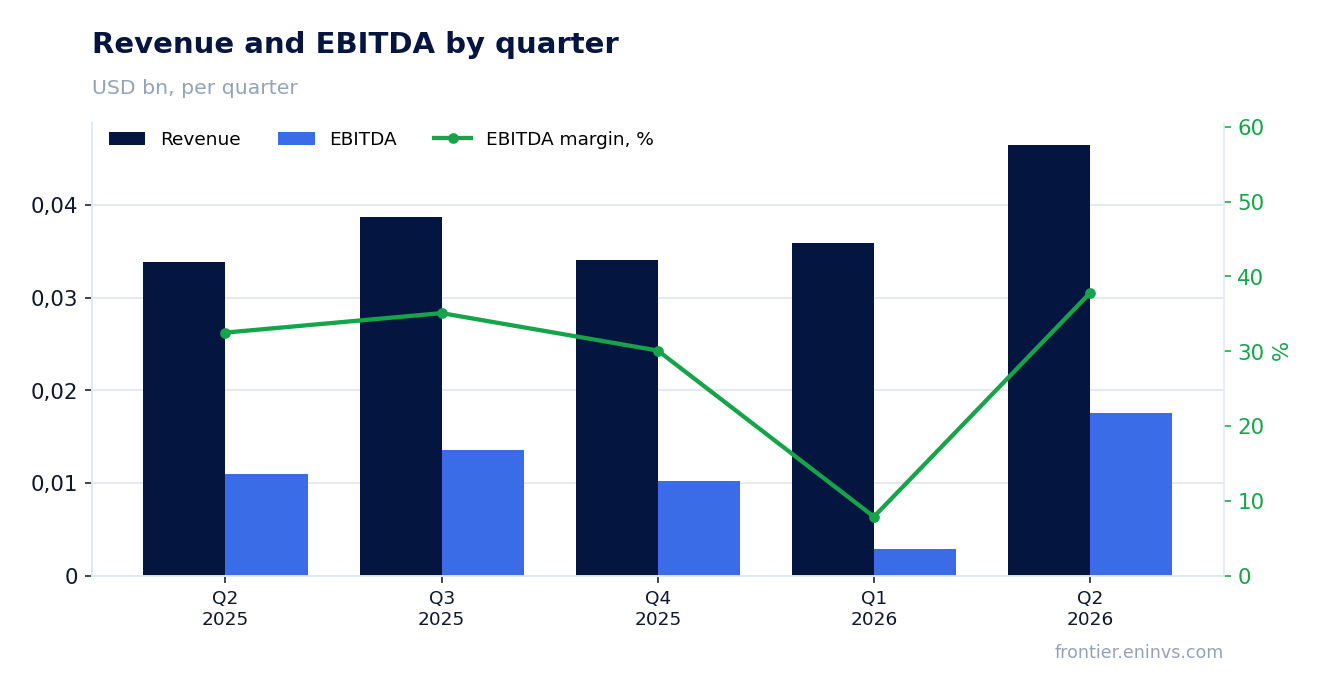
EBITDA jumped 95.5% to $25.8 million, lifting the margin by 16.5 percentage points to 55.6%
EBITDA in the second quarter of 2026 was $25.8 million, up 95.5% from a year earlier. The EBITDA margin reached 55.6% versus 39.1% in the second quarter of 2025. Such margin expansion on 37.5% revenue growth means operating costs grew much slower than revenue – likely due to a fixed cost component.
Operating profit in the second quarter of 2026 was $10.5 million versus $3.2 million a year earlier. This confirms that the improvement is not limited to EBITDA but extends to the operating line. However, in the first quarter of 2026 the operating loss was $4.2 million, highlighting high quarterly volatility.
A 55.6% margin is very high for an oil and gas company. If sustained, it would provide a substantial cushion if prices fall. But it is too early to call it stable: a quarter earlier EBITDA was just $2.9 million with a margin near 8%. Such a spread points to strong price dependence and possible one-off factors.
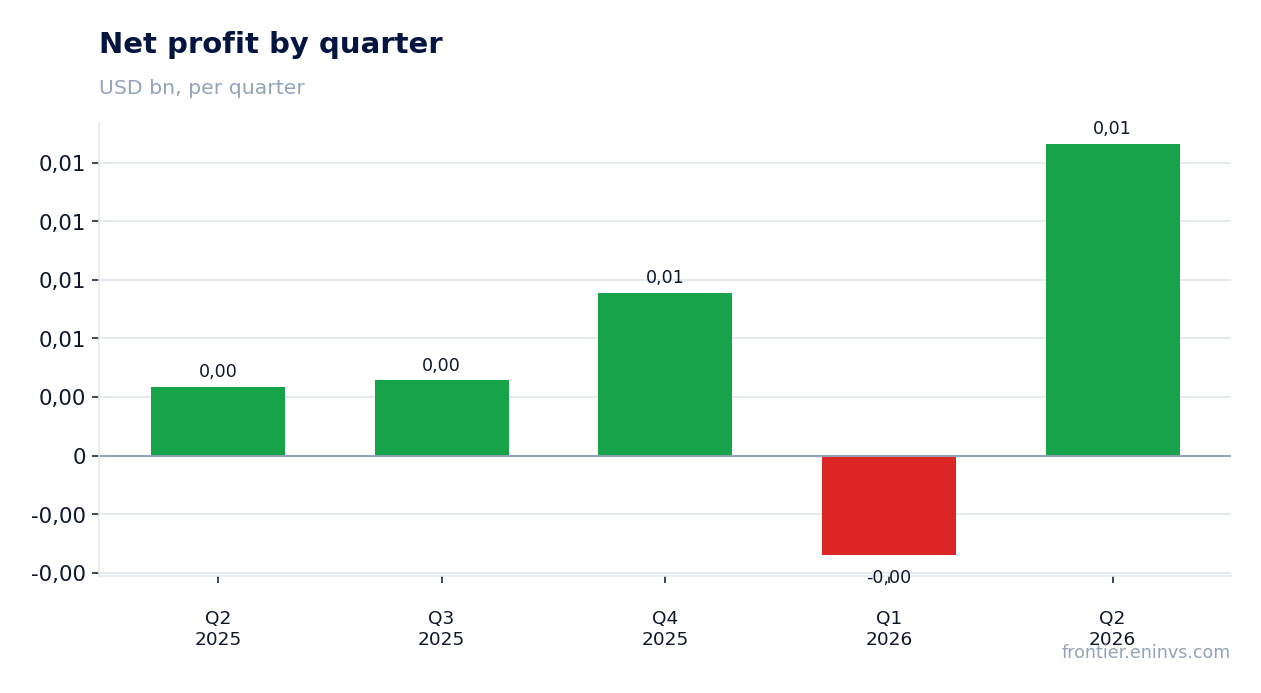
Net profit of $13.3 million was 4.5 times higher, but a $4.3 million loss a quarter earlier shows how low the base is
Net profit in the second quarter of 2026 was $13.3 million, up 352.9% from the second quarter of 2025. The 4.5-fold increase looks impressive, but it comes from a very low base: profit a year earlier was just $2.9 million. In the first quarter of 2026 the company posted a $4.3 million loss, so the current result is more of a recovery than sustained growth.
The net margin in the second quarter of 2026 was 28.6% versus 8.7% a year earlier. Such a margin for an oil and gas company is only possible under favourable price conditions. If prices decline, the margin could quickly return to more modest levels, as already happened in the first quarter of 2026.
Return on equity over the trailing twelve months is 20.9%, a solid figure. However, investors should remember that trailing twelve-month profit of $19.2 million includes both the loss-making first quarter of 2026 and the profitable second quarter. The sustainability of this profit level will depend on energy prices.
Operating cash flow of $14.0 million covers capital spending, though the capex figure itself is not disclosed
Operating cash flow in the second quarter of 2026 was $14.0 million versus $8.0 million a year earlier. Growth of 74.5% is a good sign, confirming that profit converts into cash. However, the company does not disclose capital expenditure, so it is impossible to say precisely how much is left after investment.
Over the trailing twelve months operating cash flow was $42.9 million. With a market capitalisation of $238.8 million, that gives a price-to-operating-cash-flow ratio of about 5.6 – inexpensive for an oil and gas company. If capex is roughly half that flow, free cash flow could be around $20 million, which still looks attractive.
The lack of capex disclosure is a significant gap in reporting. Without it, one cannot assess how much the company spends to maintain production and how much remains for dividends or debt reduction. In the next report, this metric should be watched for disclosure.
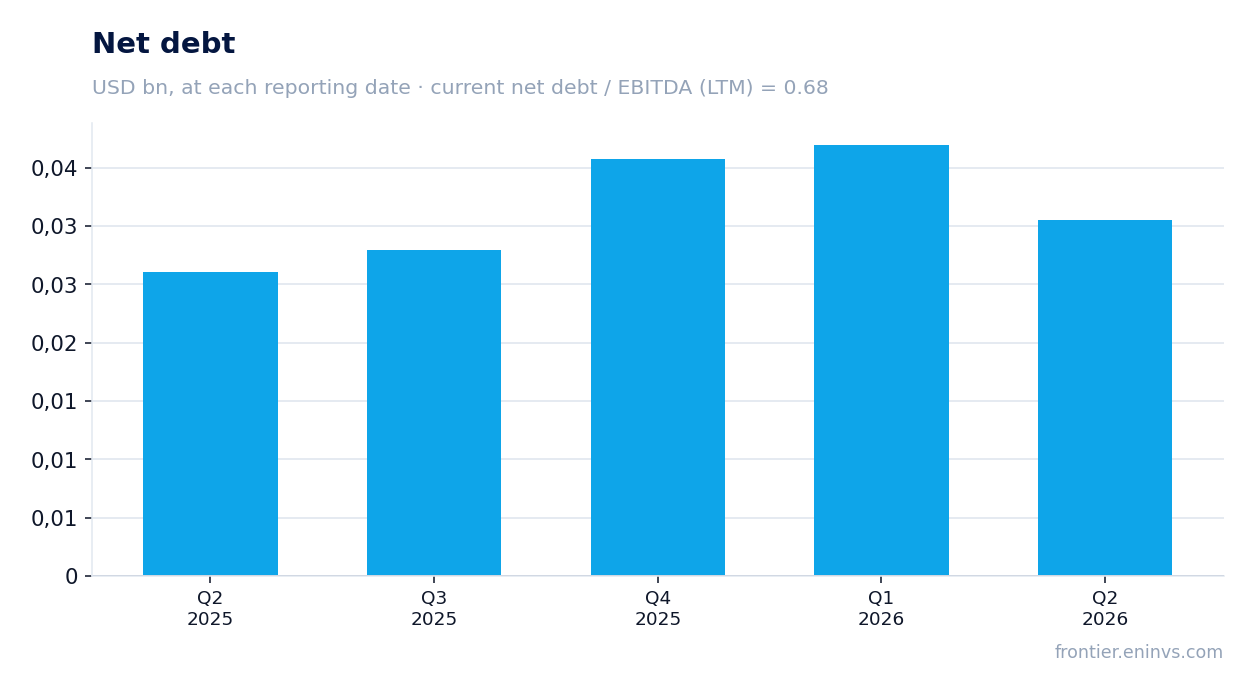
Net debt of $30.5 million, or 0.68 times trailing twelve-month EBITDA, is moderate but up from $26.0 million a year ago
Net debt at June 30, 2026 was $30.5 million. A year earlier, at June 30, 2025, it was $26.0 million, so it grew by $4.5 million over the year. The ratio of net debt to trailing twelve-month EBITDA is 0.68 – moderate, but the company does not disclose the ratio a year ago, so one cannot say whether leverage rose or fell.
The $4.5 million increase in absolute debt over the year, alongside EBITDA growth, looks manageable. If trailing twelve-month EBITDA is $45.1 million, even with debt rising to $35 million the ratio would stay below 0.8. This gives the company room for manoeuvre, but does not remove the need to monitor debt dynamics amid volatile prices.
Interest expense is not disclosed in the provided data. With a market capitalisation of $238.8 million and net debt of $30.5 million, EV/EBITDA is 6.1. That is below the three-year average, making the share interesting for an investor willing to accept price risk.
EV/EBITDA of 6.1 and P/E of 12.4 sit below their own history, while the portal model implies 34% upside to fair value
The trailing twelve-month EV/EBITDA multiple is 6.1, and P/E is 12.4. Both are below their three-year averages, pointing to undervaluation relative to the company's own history. With a market capitalisation of $238.8 million and trailing twelve-month EBITDA of $45.1 million, the company looks inexpensive compared to how the market valued it in previous years.
According to the portal model, which reprices EBITDA at current commodity prices at the target EV/EBITDA, the upside to fair value is 34%. This is our own estimate, not a market consensus. It rests on the assumption that current energy prices persist and the company maintains a margin close to the current level.
The key question for an investor is price sustainability. If oil and gas prices stay at second-quarter 2026 levels, the current valuation does indeed look attractive. If prices correct, EBITDA could return to first-quarter levels, and the multiples would no longer be low. This risk determines the final verdict.
Valuation on the latest reported figures
| Metric | Value |
|---|---|
| Market cap | 0.24 bn USD |
| P/E (LTM) | 12.4 |
| EV/EBITDA (LTM) | 6.1 |
| P/B | 0.92 |
| Net debt / EBITDA (LTM) | 0.68 |
| Operating cash flow (LTM) | 0.04 bn |
| ROE | 20.9% |
Bottom line
In the second quarter of 2026 Journey Energy delivered strong results: revenue rose 37.5% to $46.5 million, EBITDA – by 95.5% to $25.8 million, net profit – 4.5 times to $13.3 million. However, this growth came mainly from the price environment rather than organic development, and a quarter earlier the company was loss-making. Net debt of $30.5 million, or 0.68 times EBITDA, looks moderate but has risen over the year. The EV/EBITDA multiple of 6.1 and P/E of 12.4 are below their own history, and the portal model implies 34% upside to fair value. Against this backdrop, the share looks attractive, but only for investors willing to accept the risk of a sharp reversal in energy prices.
Open the company's financial profile JOY →
See also: market overview · valuation map · stock screeners