Karoon Energy: revenue up 16.8%, but net debt added USD 0.1 bn over nine months

Karoon Energy reported results for Q3 2026. Quarterly revenue came in at USD 191.6 mn, up 16.8% year on year from Q3 2025. Net debt stood at USD 269.2 mn as of 30 September 2026, or 1.54x LTM EBITDA. The LTM EV/EBITDA multiple of 5.5x is above its own three-year average of 3.4x, while the portal model puts the share's upside to fair value at +91%. With revenue growth, moderate leverage and a 2.6% dividend yield, the share looks rather attractive, though the premium to its own history caps that conclusion.
Key takeaways
— Q3 revenue added 16.8% year on year to USD 191.6 mn
— Net debt rose from USD 0.1 bn at end-2025 to USD 0.3 bn on 30 September 2026
— Leverage at 1.54x LTM EBITDA remains moderate
— LTM net profit of USD 125.5 mn implies a P/E of 6.6x and ROE of 12.5%
— Trailing twelve-month dividend yield stands at 2.6%
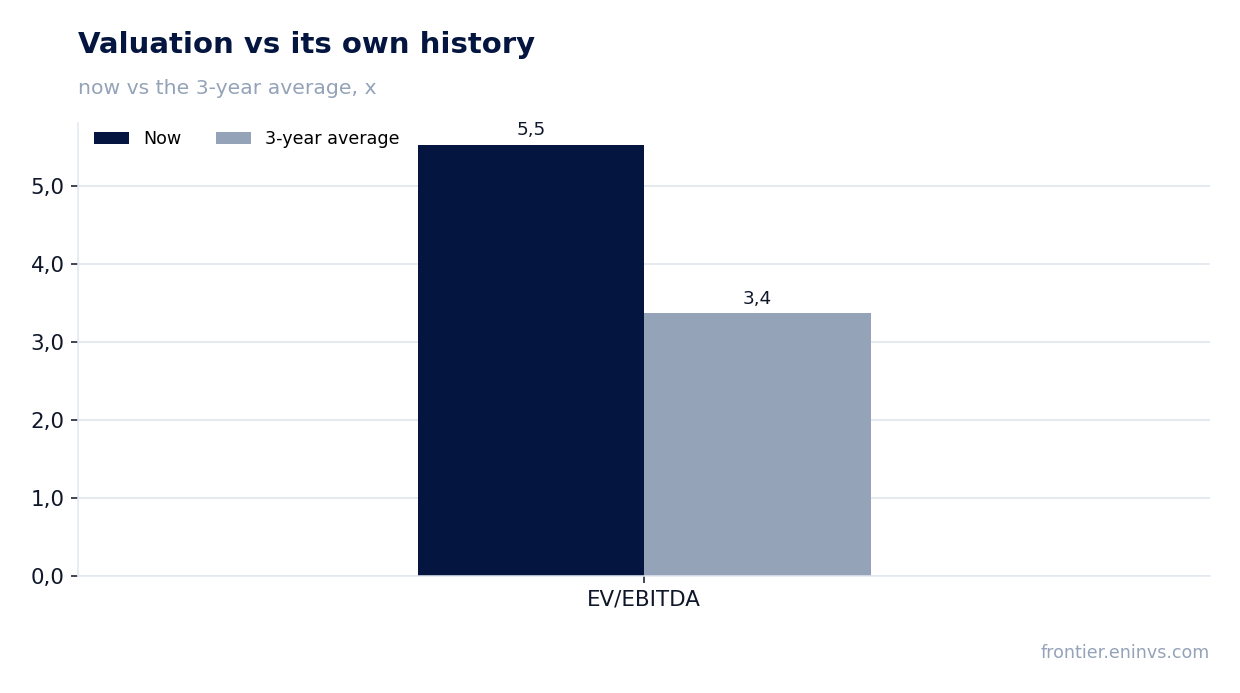
— EV/EBITDA of 5.5x is 64% above its own three-year average of 3.4x
— The portal model puts the share's upside to fair value at +91%
Attractiveness
Key figures, USD bn
| Metric | Q3 2025 | Q3 2026 | Change |
|---|---|---|---|
| Revenue | 0.16 | 0.19 | +16.8% |
Q3 revenue added 16.8% year on year to USD 191.6 mn
Q3 2026 revenue came in at USD 191.6 mn versus USD 164.1 mn in Q3 2025. The 16.8% year-on-year increase is the only growth rate confirmed on a quarterly basis.
Over the trailing twelve months revenue reached USD 628.6 mn. That base spans different quarters and is not directly comparable with quarterly dynamics, but it shows the scale behind the multiples.
Net debt rose from USD 0.1 bn at end-2025 to USD 0.3 bn on 30 September 2026
Net debt stood at USD 269.2 mn on 30 September 2026. At end-2025 it was USD 0.1 bn, so it added USD 0.1 bn over nine months. Over twelve months, from 30 September 2025, the change is the same – plus USD 0.1 bn.
Rising debt alongside rising revenue means part of the cash flow went somewhere other than debt repayment. The facts do not say where, so we stick to the level: absolute debt increased rather than fell.
For a holder the ratio to earnings matters more than the absolute figure, and that ratio remains moderate.
Leverage at 1.54x LTM EBITDA remains moderate
The ratio of net debt to LTM EBITDA is 1.54x. That is a level at which debt service does not look burdensome for a business with USD 628.6 mn of LTM revenue.
The facts do not give the direction of the ratio: the earlier value is not disclosed, so we cannot say leverage rose or fell. We record the current level only.
With LTM EBITDA of USD 174.6 mn, debt coverage remains adequate for the company to meet its obligations without strain on operating cash flow.
LTM net profit of USD 125.5 mn implies a P/E of 6.6x and ROE of 12.5%
LTM net profit is USD 125.5 mn. Against a market capitalisation of USD 833.0 mn that gives a P/E of 6.6x and a return on equity of 12.5%.
Profit at that level on USD 628.6 mn of revenue means the company retains a meaningful share of revenue as net income. The facts do not isolate one-off items, so we treat it as the operating base.
The price-to-earnings ratio is lower than many commodity companies', which partly offsets the EV/EBITDA premium to its own history.
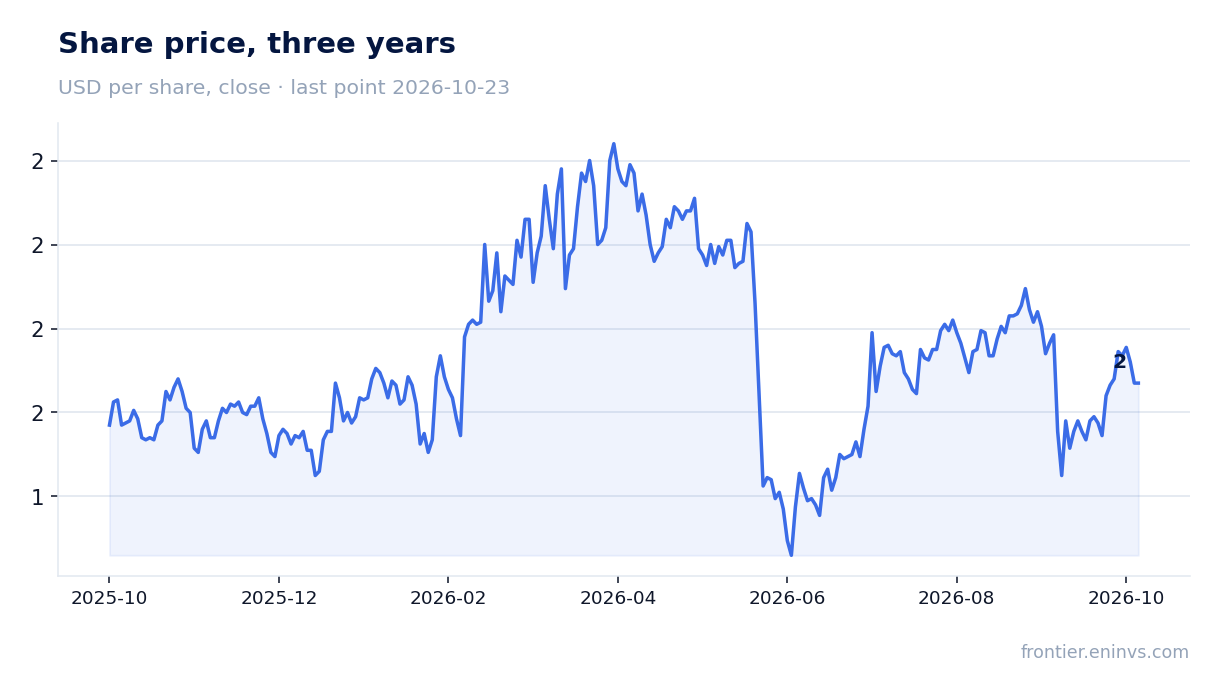
Trailing twelve-month dividend yield stands at 2.6%
The trailing twelve-month dividend yield is 2.6%. That is a modest level for a commodity company, but it reflects the current share price and amounts actually paid.
The facts do not disclose what was paid and for which year, so we do not give a forward dividend estimate. A 2.6% yield is lower than one might expect from a business on a P/E of 6.6x – the payout ratio is probably conservative, but the facts do not confirm it.
For a holder the dividend is not the main argument here: the bulk of the return should come from a re-rating if the portal model is right.
EV/EBITDA of 5.5x is 64% above its own three-year average of 3.4x
The LTM EV/EBITDA multiple is 5.5x. Its own three-year average is 3.4x, so the current valuation is 64% above history. On this multiple the share is more expensive than it has typically been over the past three years.
The premium to its own history means the market has already priced in part of future growth. At the same time, a P/E of 6.6x and ROE of 12.5% suggest the share is not stretched on earnings.
On the portal model, which re-prices EBITDA at current commodity prices at the target EV/EBITDA, the upside to fair value is +91%. That is our own estimate, not a market consensus.
The portal model puts the share's upside to fair value at +91%
Our model re-prices EBITDA at current commodity prices and values the share at the target EV/EBITDA. The result is +91% upside to fair value.
That calculation rests on current commodity prices and the target multiple, so its sensitivity to oil prices is high. If prices fall, the valuation falls.
The model is not a consensus and not a target price. It shows how far the current market price diverges from the estimate under the stated assumptions, and it supports the rather-attractive verdict.
Valuation on the latest reported figures
| Metric | Value |
|---|---|
| Market cap | 0.83 bn USD |
| P/E (LTM) | 6.6 |
| EV/EBITDA (LTM) | 5.5 |
| P/B | 0.81 |
| Net debt / EBITDA (LTM) | 1.54 |
| ROE | 12.5% |
| Dividend yield (12m) | 2.6% |
| EV/EBITDA, 3-year average | 3.4 |
Bottom line
The strong side of the report remains revenue: USD 191.6 mn in Q3, up 16.8% year on year. LTM net profit of USD 125.5 mn and ROE of 12.5% confirm the business earns money, and leverage at 1.54x LTM EBITDA creates no strain. The weak spot is valuation: EV/EBITDA of 5.5x is 64% above its own three-year average of 3.4x, and the premium to history is already in the price. The 2.6% dividend yield is modest and does not offset that premium. The key question for a holder is whether the company will meet the growth expectations the market has already paid for; the portal model's +91% upside says it will, but that is our estimate, not a guarantee.
Open the company's financial profile KAR →
See also: market overview · valuation map · stock screeners