Kinross Gold: gold rose 23.4% but EBITDA fell – the price did not turn into profit
Contents
On 11 November Kinross Gold released its third-quarter 2026 results. The average gold price in the reporting period was 4268 USD/oz versus 3459 USD/oz a year earlier (+23.4%), yet revenue was flat year on year (–0.4% to 1774.7 mn USD) and EBITDA declined 1.4% to 1042.6 mn USD. At the year-ago volumes and costs and current prices, our calculation implies revenue of 2199.1 mn USD and EBITDA of 1353.2 mn USD; the company earned 424.4 mn USD and 310.6 mn USD less respectively. Our conclusion: the share is fairly valued – the portal model puts the upside to fair value at –9%. Our view: the share is fairly valued; upside on the portal model -9%.
Our view: is there upside
Our view in numbers
| Metric | Our read |
|---|---|
| Verdict | Neutral |
| Upside on the portal model | -9% |
| How the model works | spot model: EBITDA re-priced to current commodity prices at the target EV/EBITDA, against market cap |
| EV/EBITDA now and 3-year average | 4.4 vs 6.4 – a 32% discount to its history |
| Dividend yield, 12m | 0.6% |
| Net debt / EBITDA | -0.34 – net cash |
| Strongest case for | Net cash of 1899.2 mn USD and EV/EBITDA of 5.5 at current prices – 14% below its own three-year average – provide a margin of safety if the gold price turns higher. |
| Strongest case against | With gold 23.4% more expensive than a year earlier, EBITDA fell 1.4% and was 310.6 mn USD below the implied figure, and the release does not disclose the cause of the gap. |
| What would change the view | The verdict would improve on a sustained gold price above 4268 USD/oz and a narrowing of the gap between actual and implied EBITDA to the usual 7–10%. |
Key takeaways
— Gold averaged 4268 USD/oz in the quarter – 23.4% above a year earlier but already 5.5% below the previous quarter
— At the year-ago volumes and costs, our calculation implies EBITDA of 1353.2 mn USD; the reported figure was 310.6 mn USD lower
— Revenue of 1774.7 mn USD with gold 23.4% more expensive than a year earlier means volumes sold or the realised price lagged the benchmark
— Diesel fuel rose 45.3% year on year to 5.454 USD, directly lifting cash costs
— Net cash of 1899.2 mn USD and net debt/EBITDA of –0.34 – the balance sheet creates no risk
— EV/EBITDA LTM of 4.4 versus its own three-year average of 6.4 – a 32% discount, but LTM was earned at past, higher gold prices
— Trailing twelve-month dividend yield is just 0.56% – the payout does not compensate for the lack of growth
Key figures, USD bn
| Metric | Q3 2025 | Q3 2026 | Change |
|---|---|---|---|
| Revenue | 1.78 | 1.77 | -0.4% |
| EBITDA | 1.06 | 1.04 | -1.4% |
| Operating profit | 0.76 | 0.81 | +6.1% |
| Net profit | 0.58 | 0.58 | +0.8% |
| Operating cash flow | 0.98 | 0.71 | -27.2% |
| Capex | 0.31 | 0.44 | +43.5% |
| EBITDA margin | 59.3% | 58.7% | -0.6 pp |
| Net margin | 32.5% | 32.9% | +0.4 pp |
Gold averaged 4268 USD/oz in the quarter – 23.4% above a year earlier but already 5.5% below the previous quarter
The average gold price in the third quarter of 2026 was 4268 USD/oz versus 3459 USD/oz a year earlier. That is a 23.4% increase – the main external factor of the reporting period. Against the second quarter the price fell 5.5%: 4514 USD versus 4268 USD.
At the time of the release, 11 November, the spot price was 4045 USD – another 5.2% below the reporting-period average. For a gold producer this means the price backdrop in the next quarter will be weaker than in the one just closed.
Price is the main input but not the only one. Diesel fuel, which the company buys, rose 45.3% year on year to 5.454 USD and 1.1% quarter on quarter. That increase is already embedded in the calculation of what the company should have earned.
Commodity prices: period average and now
| Benchmark | Year ago | Q3 2026 | YoY | Spot 2026-11-11 |
|---|---|---|---|---|
| Gold, USD | 3 459 | 4 268 | +23,4% | 4 045 |
| US Diesel Index (EIA) (input cost), USD | 3,75 | 5,45 | +45,3% | 6,13 |
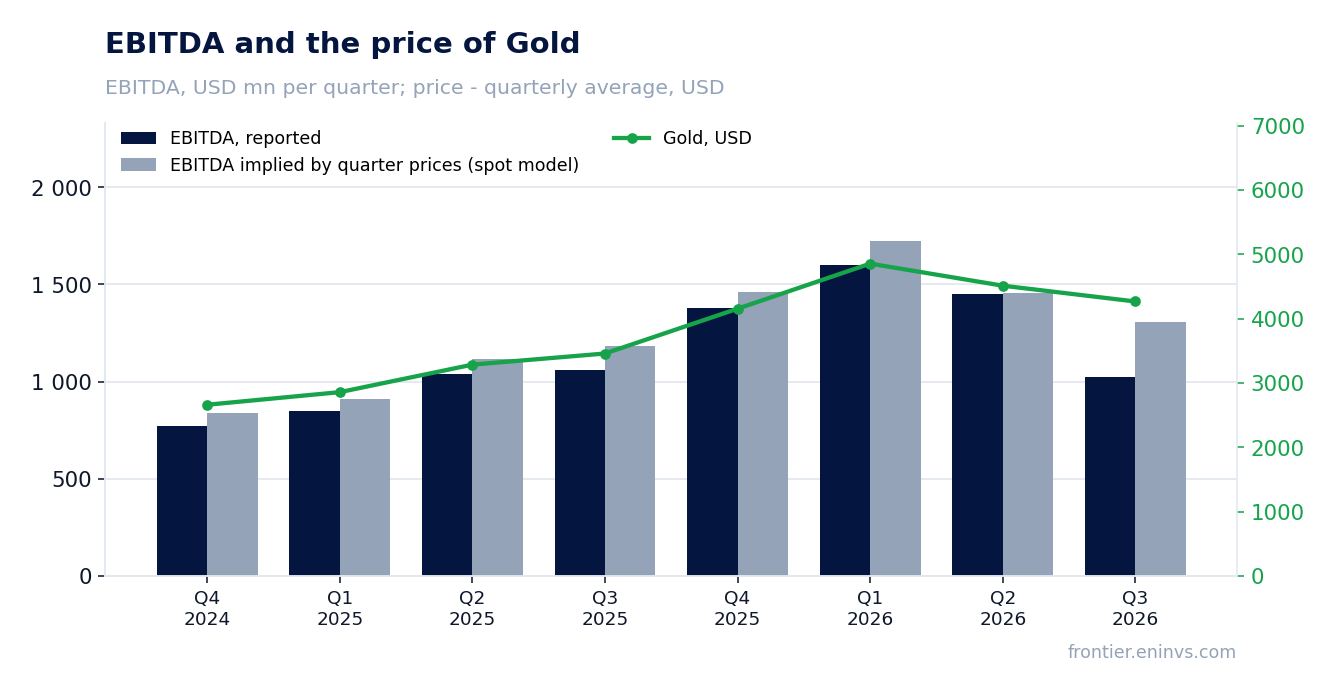
At the year-ago volumes and costs, our calculation implies EBITDA of 1353.2 mn USD; the reported figure was 310.6 mn USD lower
Taking the sales volumes and non-commodity costs of the third quarter of 2025 and substituting only the prices of the reporting period gives implied revenue of 2199.1 mn USD and EBITDA of 1353.2 mn USD. The price effect would have added 416.9 mn USD to revenue, while more expensive fuel would have taken 121.1 mn USD of costs.
Reported revenue is 1774.7 mn USD, 424.4 mn USD (19.3%) below the implied figure. Reported EBITDA is 1042.6 mn USD, 310.6 mn USD (23.0%) lower. A gap of this size cannot be explained by price alone: the price was higher than a year earlier.
The picture is similar against the previous quarter: at the volumes and costs of the second quarter of 2026 and the prices of the reporting period, revenue should have been 2116 mn USD and EBITDA 1324.3 mn USD. The actual figures are 341.3 mn USD and 281.7 mn USD lower respectively. The gold price fell 5.5% quarter on quarter, but that effect does not cover the whole gap either.
The portal's spot model, re-priced from the average of the previous four quarters, expected EBITDA of 1307.1 mn USD and revenue of 2125.5 mn USD. The actual figures are 20.2% and 16.5% below the model. The deviation of actual EBITDA from the model in the four preceding periods was –10.5%, –13.5%, –7.1% and +0.7%, so the current gap is noticeably wider than usual.
What the prices implied and what the company earned
| Base (Q3 2025) | Implied at period prices | Reported | Reported vs implied | |
|---|---|---|---|---|
| Revenue, USD mn | 1 782 | 2 199 | 1 775 | -19,3% |
| EBITDA, USD mn | 1 057 | 1 353 | 1 043 | -23,0% |
| EBITDA, portal spot model, USD mn | — | 1 307 | 1 043 | -20,2% |
Revenue and EBITDA by quarter
| Period | Measure | bn USD |
|---|---|---|
| Q4 2024 | Revenue | 1.4093639999999996 |
| Q1 2025 | Revenue | 1.4975 |
| Q2 2025 | Revenue | 1.7285 |
| Q3 2025 | Revenue | 1.782122 |
| Q4 2025 | Revenue | 2.023 |
| Q1 2026 | Revenue | 2.4076999999999997 |
| Q2 2026 | Revenue | 2.2380999999999998 |
| Q3 2026 | Revenue | 1.7747 |
| Q4 2024 | EBITDA | 0.7726029999999998 |
| Q1 2025 | EBITDA | 0.8462 |
| Q2 2025 | EBITDA | 1.0376999999999998 |
| Q3 2025 | EBITDA | 1.057346 |
| Q4 2025 | EBITDA | 1.379 |
| Q1 2026 | EBITDA | 1.602 |
| Q2 2026 | EBITDA | 1.45 |
| Q3 2026 | EBITDA | 1.0261 |
EBITDA margin
| Period | Measure | % |
|---|---|---|
| Q4 2024 | EBITDA margin | 54.8 |
| Q1 2025 | EBITDA margin | 56.5 |
| Q2 2025 | EBITDA margin | 60.0 |
| Q3 2025 | EBITDA margin | 59.3 |
| Q4 2025 | EBITDA margin | 68.2 |
| Q1 2026 | EBITDA margin | 66.5 |
| Q2 2026 | EBITDA margin | 64.8 |
| Q3 2026 | EBITDA margin | 57.8 |
Revenue of 1774.7 mn USD with gold 23.4% more expensive than a year earlier means volumes sold or the realised price lagged the benchmark
Revenue in the third quarter of 2026 was 1774.7 mn USD, 0.4% below a year earlier. That is a deceleration from the second quarter of 2026, when growth was 29.5%. With gold 23.4% more expensive, flat revenue means volumes sold or the realised price came in below what the benchmark implies.
The 424.4 mn USD gap to implied revenue is the part that price did not explain. The company's release does not disclose the causes, so we record the fact itself: revenue did not grow with significantly more expensive gold.
For an investor this is the main signal of the quarter. A gold producer should benefit from a higher price for its product; if revenue does not show it, either fewer ounces were sold or the realised price was below the benchmark.
Diesel fuel rose 45.3% year on year to 5.454 USD, directly lifting cash costs
Diesel is a key purchased input for a gold miner: it is used in haul trucks and processing. Over the year its average price rose from 3.754 to 5.454 USD, up 45.3%. That increase is already included in the calculation of what the company should have earned: it took 121.1 mn USD of costs.
But actual costs were higher even than that: EBITDA fell 310.6 mn USD short of the calculation in which fuel had already become more expensive. So cost pressure came from more than fuel.
On 11 November diesel costs 6.127 USD, another 12.3% above the reporting-period average. If the price holds, next quarter's costs will be higher than in the one just closed.
Net cash of 1899.2 mn USD and net debt/EBITDA of –0.34 – the balance sheet creates no risk
As of 30 September 2026 the company has net cash of 1899.2 mn USD: cash exceeds debt. Net debt to EBITDA over the last twelve months is –0.34. This is a level, not a trend: we cannot compare it with a prior period because the release does not provide one.
Operating cash flow in the third quarter was 714.4 mn USD and capital expenditure 439.6 mn USD. Free cash flow remains positive, though smaller than in previous quarters: in the second quarter operating cash flow was 1145.9 mn USD with capex of 411.0 mn USD.
Capex rose to 439.6 mn USD – the highest of the last four quarters. For a gold miner this is reinvestment that sustains production; without it volumes decline over time.
Valuation vs its own history
now vs the 3-year average
| Period | Measure | × |
|---|---|---|
| EV/EBITDA | Now | 4.407726426739779 |
| EV/EBITDA | 3-year average | 6.440525924249812 |
EV/EBITDA LTM of 4.4 versus its own three-year average of 6.4 – a 32% discount, but LTM was earned at past, higher gold prices
On the trailing twelve-month EV/EBITDA multiple the share trades at 4.4 versus its own three-year average of 6.4. That is a 32% discount to its own history – at first glance the share is cheap.
However, LTM EBITDA of 5660.2 mn USD was earned at the average prices of past quarters, which were higher than current ones. At today's commodity prices the portal's spot model puts EBITDA at 4373 mn USD, 18.6% below LTM. EV/EBITDA at current prices is 5.5, not 4.4.
That figure – 5.5 – should be the starting point for valuation. The discount to history narrows but remains: 5.5 versus 6.4 is 14% below its own average. There is a cushion, but it is smaller than the reported multiple suggests.
Share price, three years
close, last point 2026-11-10
| Period | Measure | USD per share |
|---|---|---|
| 2025-11-10 | Closing price | 25.440000534057617 |
| 2025-11-11 | Closing price | 25.350000381469727 |
| 2025-11-12 | Closing price | 26.030000686645508 |
| 2025-11-13 | Closing price | 25.510000228881836 |
| 2025-11-14 | Closing price | 25.440000534057617 |
| 2025-11-17 | Closing price | 24.940000534057617 |
| 2025-11-18 | Closing price | 25.360000610351562 |
| 2025-11-19 | Closing price | 25.559999465942383 |
| 2025-11-20 | Closing price | 24.219999313354492 |
| 2025-11-21 | Closing price | 24.389999389648438 |
| 2025-11-24 | Closing price | 25.969999313354492 |
| 2025-11-25 | Closing price | 26.09000015258789 |
| 2025-11-26 | Closing price | 27.440000534057617 |
| 2025-11-28 | Closing price | 28.110000610351562 |
| 2025-12-01 | Closing price | 28.34000015258789 |
| 2025-12-02 | Closing price | 27.489999771118164 |
| 2025-12-03 | Closing price | 27.1299991607666 |
| 2025-12-04 | Closing price | 27.34000015258789 |
| 2025-12-05 | Closing price | 27.280000686645508 |
| 2025-12-08 | Closing price | 26.459999084472656 |
| 2025-12-09 | Closing price | 26.90999984741211 |
| 2025-12-10 | Closing price | 27.260000228881836 |
| 2025-12-11 | Closing price | 28.549999237060547 |
| 2025-12-12 | Closing price | 27.920000076293945 |
| 2025-12-15 | Closing price | 28.15999984741211 |
| 2025-12-16 | Closing price | 27.809999465942383 |
| 2025-12-17 | Closing price | 27.940000534057617 |
| 2025-12-18 | Closing price | 27.989999771118164 |
| 2025-12-19 | Closing price | 28.59000015258789 |
| 2025-12-22 | Closing price | 29.350000381469727 |
| 2025-12-23 | Closing price | 29.450000762939453 |
| 2025-12-24 | Closing price | 29.270000457763672 |
| 2025-12-26 | Closing price | 29.700000762939453 |
| 2025-12-29 | Closing price | 28.209999084472656 |
| 2025-12-30 | Closing price | 28.610000610351562 |
| 2025-12-31 | Closing price | 28.15999984741211 |
| 2026-01-02 | Closing price | 28.299999237060547 |
| 2026-01-05 | Closing price | 29.1200008392334 |
| 2026-01-06 | Closing price | 30.389999389648438 |
| 2026-01-07 | Closing price | 30.540000915527344 |
| 2026-01-08 | Closing price | 30.899999618530273 |
| 2026-01-09 | Closing price | 31.239999771118164 |
| 2026-01-12 | Closing price | 32.939998626708984 |
| 2026-01-13 | Closing price | 33.369998931884766 |
| 2026-01-14 | Closing price | 33.290000915527344 |
| 2026-01-15 | Closing price | 33.25 |
| 2026-01-16 | Closing price | 33.65999984741211 |
| 2026-01-20 | Closing price | 36.560001373291016 |
| 2026-01-21 | Closing price | 35.31999969482422 |
| 2026-01-22 | Closing price | 36.63999938964844 |
| 2026-01-23 | Closing price | 37.15999984741211 |
| 2026-01-26 | Closing price | 37.869998931884766 |
| 2026-01-27 | Closing price | 37.869998931884766 |
| 2026-01-28 | Closing price | 38.06999969482422 |
| 2026-01-29 | Closing price | 36.599998474121094 |
| 2026-01-30 | Closing price | 31.559999465942383 |
| 2026-02-02 | Closing price | 31.579999923706055 |
| 2026-02-03 | Closing price | 33.29999923706055 |
| 2026-02-04 | Closing price | 32.97999954223633 |
| 2026-02-05 | Closing price | 31.25 |
| 2026-02-06 | Closing price | 32.09000015258789 |
| 2026-02-09 | Closing price | 33.93000030517578 |
| 2026-02-10 | Closing price | 34.310001373291016 |
| 2026-02-11 | Closing price | 34.81999969482422 |
| 2026-02-12 | Closing price | 32.36000061035156 |
| 2026-02-13 | Closing price | 34.400001525878906 |
| 2026-02-17 | Closing price | 33.560001373291016 |
| 2026-02-18 | Closing price | 34.560001373291016 |
| 2026-02-19 | Closing price | 33.45000076293945 |
| 2026-02-20 | Closing price | 33.45000076293945 |
| 2026-02-23 | Closing price | 35.529998779296875 |
| 2026-02-24 | Closing price | 36.060001373291016 |
| 2026-02-25 | Closing price | 36.040000915527344 |
| 2026-02-26 | Closing price | 36.7599983215332 |
| 2026-02-27 | Closing price | 36.9900016784668 |
| 2026-03-02 | Closing price | 36.790000915527344 |
| 2026-03-03 | Closing price | 33.79999923706055 |
| 2026-03-04 | Closing price | 33.970001220703125 |
| 2026-03-05 | Closing price | 32.7400016784668 |
| 2026-03-06 | Closing price | 32.54999923706055 |
| 2026-03-09 | Closing price | 32.52000045776367 |
| 2026-03-10 | Closing price | 32.790000915527344 |
| 2026-03-11 | Closing price | 32.560001373291016 |
| 2026-03-12 | Closing price | 32.52000045776367 |
| 2026-03-13 | Closing price | 30.56999969482422 |
| 2026-03-16 | Closing price | 31.049999237060547 |
| 2026-03-17 | Closing price | 31.0 |
| 2026-03-18 | Closing price | 28.950000762939453 |
| 2026-03-19 | Closing price | 27.420000076293945 |
| 2026-03-20 | Closing price | 26.540000915527344 |
| 2026-03-23 | Closing price | 27.809999465942383 |
| 2026-03-24 | Closing price | 27.920000076293945 |
| 2026-03-25 | Closing price | 29.020000457763672 |
| 2026-03-26 | Closing price | 27.889999389648438 |
| 2026-03-27 | Closing price | 28.739999771118164 |
| 2026-03-30 | Closing price | 28.600000381469727 |
| 2026-03-31 | Closing price | 30.520000457763672 |
| 2026-04-01 | Closing price | 32.02000045776367 |
| 2026-04-02 | Closing price | 31.510000228881836 |
| 2026-04-06 | Closing price | 31.360000610351562 |
| 2026-04-07 | Closing price | 31.6200008392334 |
| 2026-04-08 | Closing price | 33.09000015258789 |
| 2026-04-09 | Closing price | 32.84000015258789 |
| 2026-04-10 | Closing price | 33.77000045776367 |
| 2026-04-13 | Closing price | 33.58000183105469 |
| 2026-04-14 | Closing price | 34.0099983215332 |
| 2026-04-15 | Closing price | 33.38999938964844 |
| 2026-04-16 | Closing price | 33.869998931884766 |
| 2026-04-17 | Closing price | 34.939998626708984 |
| 2026-04-20 | Closing price | 34.70000076293945 |
| 2026-04-21 | Closing price | 32.060001373291016 |
| 2026-04-22 | Closing price | 32.59000015258789 |
| 2026-04-23 | Closing price | 32.119998931884766 |
| 2026-04-24 | Closing price | 32.790000915527344 |
| 2026-04-27 | Closing price | 32.13999938964844 |
| 2026-04-28 | Closing price | 30.520000457763672 |
| 2026-04-29 | Closing price | 29.860000610351562 |
| 2026-04-30 | Closing price | 30.239999771118164 |
| 2026-05-01 | Closing price | 29.549999237060547 |
| 2026-05-04 | Closing price | 28.889999389648438 |
| 2026-05-05 | Closing price | 28.809999465942383 |
| 2026-05-06 | Closing price | 30.780000686645508 |
| 2026-05-07 | Closing price | 30.420000076293945 |
| 2026-05-08 | Closing price | 31.510000228881836 |
| 2026-05-11 | Closing price | 31.809999465942383 |
| 2026-05-12 | Closing price | 31.729999542236328 |
| 2026-05-13 | Closing price | 31.270000457763672 |
| 2026-05-14 | Closing price | 30.889999389648438 |
| 2026-05-15 | Closing price | 28.3799991607666 |
| 2026-05-18 | Closing price | 28.510000228881836 |
| 2026-05-19 | Closing price | 27.440000534057617 |
| 2026-05-20 | Closing price | 28.6200008392334 |
| 2026-05-21 | Closing price | 28.68000030517578 |
| 2026-05-22 | Closing price | 28.290000915527344 |
| 2026-05-26 | Closing price | 29.489999771118164 |
| 2026-05-27 | Closing price | 28.510000228881836 |
| 2026-05-28 | Closing price | 29.290000915527344 |
| 2026-05-29 | Closing price | 30.18000030517578 |
| 2026-06-01 | Closing price | 29.139999389648438 |
| 2026-06-02 | Closing price | 28.989999771118164 |
| 2026-06-03 | Closing price | 28.170000076293945 |
| 2026-06-04 | Closing price | 28.600000381469727 |
| 2026-06-05 | Closing price | 26.219999313354492 |
| 2026-06-08 | Closing price | 25.860000610351562 |
| 2026-06-09 | Closing price | 25.270000457763672 |
| 2026-06-10 | Closing price | 23.65999984741211 |
| 2026-06-11 | Closing price | 24.860000610351562 |
| 2026-06-12 | Closing price | 25.579999923706055 |
| 2026-06-15 | Closing price | 27.34000015258789 |
| 2026-06-16 | Closing price | 27.989999771118164 |
| 2026-06-17 | Closing price | 27.280000686645508 |
| 2026-06-18 | Closing price | 26.670000076293945 |
| 2026-06-22 | Closing price | 26.299999237060547 |
| 2026-06-23 | Closing price | 25.010000228881836 |
| 2026-06-24 | Closing price | 23.700000762939453 |
| 2026-06-25 | Closing price | 24.040000915527344 |
| 2026-06-26 | Closing price | 24.260000228881836 |
| 2026-06-29 | Closing price | 23.780000686645508 |
| 2026-06-30 | Closing price | 23.6200008392334 |
| 2026-07-01 | Closing price | 23.469999313354492 |
| 2026-07-02 | Closing price | 24.709999084472656 |
| 2026-07-06 | Closing price | 24.719999313354492 |
| 2026-07-07 | Closing price | 23.8799991607666 |
| 2026-07-08 | Closing price | 23.059999465942383 |
| 2026-07-09 | Closing price | 24.200000762939453 |
| 2026-07-10 | Closing price | 24.139999389648438 |
| 2026-07-13 | Closing price | 23.479999542236328 |
| 2026-07-14 | Closing price | 23.90999984741211 |
| 2026-07-15 | Closing price | 23.65999984741211 |
| 2026-07-16 | Closing price | 22.920000076293945 |
| 2026-07-17 | Closing price | 22.56999969482422 |
| 2026-07-20 | Closing price | 22.530000686645508 |
| 2026-07-21 | Closing price | 23.40999984741211 |
| 2026-07-22 | Closing price | 24.239999771118164 |
| 2026-07-23 | Closing price | 23.670000076293945 |
| 2026-07-24 | Closing price | 23.850000381469727 |
| 2026-07-27 | Closing price | 23.920000076293945 |
| 2026-07-28 | Closing price | 23.510000228881836 |
| 2026-07-29 | Closing price | 23.209999084472656 |
| 2026-07-30 | Closing price | 23.6200008392334 |
| 2026-07-31 | Closing price | 23.100000381469727 |
| 2026-08-03 | Closing price | 23.43000030517578 |
| 2026-08-04 | Closing price | 23.600000381469727 |
| 2026-08-05 | Closing price | 25.700000762939453 |
| 2026-08-06 | Closing price | 25.6200008392334 |
| 2026-08-07 | Closing price | 27.639999389648438 |
| 2026-08-10 | Closing price | 27.399999618530273 |
| 2026-08-11 | Closing price | 27.239999771118164 |
| 2026-08-12 | Closing price | 27.479999542236328 |
| 2026-08-13 | Closing price | 26.850000381469727 |
| 2026-08-14 | Closing price | 27.309999465942383 |
| 2026-08-17 | Closing price | 27.719999313354492 |
| 2026-08-18 | Closing price | 27.1200008392334 |
| 2026-08-19 | Closing price | 29.899999618530273 |
| 2026-08-20 | Closing price | 31.43000030517578 |
| 2026-08-21 | Closing price | 32.7599983215332 |
| 2026-08-24 | Closing price | 32.97999954223633 |
| 2026-08-25 | Closing price | 33.47999954223633 |
| 2026-08-26 | Closing price | 32.31999969482422 |
| 2026-08-27 | Closing price | 32.5099983215332 |
| 2026-08-28 | Closing price | 31.270000457763672 |
| 2026-08-31 | Closing price | 30.68000030517578 |
| 2026-09-01 | Closing price | 29.43000030517578 |
| 2026-09-02 | Closing price | 30.260000228881836 |
| 2026-09-03 | Closing price | 31.59000015258789 |
| 2026-09-04 | Closing price | 30.8700008392334 |
| 2026-09-08 | Closing price | 30.149999618530273 |
| 2026-09-09 | Closing price | 30.229999542236328 |
| 2026-09-10 | Closing price | 28.93000030517578 |
| 2026-09-11 | Closing price | 29.1299991607666 |
| 2026-09-14 | Closing price | 28.18000030517578 |
| 2026-09-15 | Closing price | 28.040000915527344 |
| 2026-09-16 | Closing price | 27.81999969482422 |
| 2026-09-17 | Closing price | 28.489999771118164 |
| 2026-09-18 | Closing price | 28.079999923706055 |
| 2026-09-21 | Closing price | 27.790000915527344 |
| 2026-09-22 | Closing price | 28.700000762939453 |
| 2026-09-23 | Closing price | 27.6200008392334 |
| 2026-09-24 | Closing price | 24.420000076293945 |
| 2026-09-25 | Closing price | 25.049999237060547 |
| 2026-09-28 | Closing price | 24.110000610351562 |
| 2026-09-29 | Closing price | 24.31999969482422 |
| 2026-09-30 | Closing price | 24.079999923706055 |
| 2026-10-01 | Closing price | 24.059999465942383 |
| 2026-10-02 | Closing price | 24.059999465942383 |
| 2026-10-05 | Closing price | 23.579999923706055 |
| 2026-10-06 | Closing price | 23.809999465942383 |
| 2026-10-07 | Closing price | 23.18000030517578 |
| 2026-10-08 | Closing price | 23.34000015258789 |
| 2026-10-09 | Closing price | 23.739999771118164 |
| 2026-10-12 | Closing price | 23.549999237060547 |
| 2026-10-13 | Closing price | 23.440000534057617 |
| 2026-10-14 | Closing price | 22.239999771118164 |
| 2026-10-15 | Closing price | 23.850000381469727 |
| 2026-10-16 | Closing price | 24.020000457763672 |
| 2026-10-19 | Closing price | 23.649999618530273 |
| 2026-10-20 | Closing price | 23.639999389648438 |
| 2026-10-21 | Closing price | 23.81999969482422 |
| 2026-10-22 | Closing price | 22.68000030517578 |
| 2026-10-23 | Closing price | 22.34000015258789 |
| 2026-10-26 | Closing price | 22.399999618530273 |
| 2026-10-27 | Closing price | 23.0 |
| 2026-10-28 | Closing price | 22.979999542236328 |
| 2026-10-29 | Closing price | 21.600000381469727 |
| 2026-10-30 | Closing price | 20.1299991607666 |
| 2026-11-02 | Closing price | 20.559999465942383 |
| 2026-11-03 | Closing price | 19.93000030517578 |
| 2026-11-04 | Closing price | 21.420000076293945 |
| 2026-11-05 | Closing price | 21.59000015258789 |
| 2026-11-06 | Closing price | 22.239999771118164 |
| 2026-11-09 | Closing price | 22.850000381469727 |
| 2026-11-10 | Closing price | 21.6299991607666 |
Trailing twelve-month dividend yield is just 0.56% – the payout does not compensate for the lack of growth
The trailing twelve-month dividend yield is 0.56% – a low level for a gold miner with net cash. The payout provides no meaningful support for the share.
With a market capitalisation of 25952.6 mn USD and trailing twelve-month profit of 3176.9 mn USD, the company earns enough to pay more. But the current payout policy, judging by the actual yield, is conservative.
For an investor this means the main return driver remains the share price, which depends on the gold price. A 0.56% dividend does not compensate for the risk of a falling metal price.
Valuation on the latest reported figures
| Metric | Value |
|---|---|
| Market cap | 26.0 bn USD |
| P/E (LTM) | 8.2 |
| EV/EBITDA (LTM) | 4.4 |
| P/B | 3.03 |
| Net debt / EBITDA (LTM) | -0.34 |
| Operating cash flow (LTM) | 4.15 bn |
| ROE | 23.8% |
| Dividend yield (12m) | 0.6% |
| EV/EBITDA, 3-year average | 6.4 |
Net profit by quarter
| Period | Measure | bn USD |
|---|---|---|
| Q4 2024 | Net profit | 0.272742 |
| Q1 2025 | Net profit | 0.368 |
| Q2 2025 | Net profit | 0.5307000000000001 |
| Q3 2025 | Net profit | 0.578416 |
| Q4 2025 | Net profit | 0.9065 |
| Q1 2026 | Net profit | 0.843 |
| Q2 2026 | Net profit | 0.8442000000000001 |
| Q3 2026 | Net profit | 0.5832 |
Bottom line
The strength of the quarter remains the balance sheet: net cash of 1899.2 mn USD and net debt/EBITDA of –0.34. But the headline result disappoints: with gold 23.4% more expensive than a year earlier, EBITDA fell 1.4%, and against the implied figure it was 310.6 mn USD lower. The EV/EBITDA discount to its own history (4.4 versus 6.4) is partly explained by LTM being earned at past, higher prices; at current prices the multiple is 5.5. A 0.56% dividend yield provides no support. Our conclusion: the share is fairly valued – the portal model puts the upside to fair value at –9%. Our view: the share is fairly valued; upside on the portal model -9%.