Kosmos Energy: revenue up 31.9%, yet the quarter closed in the red again
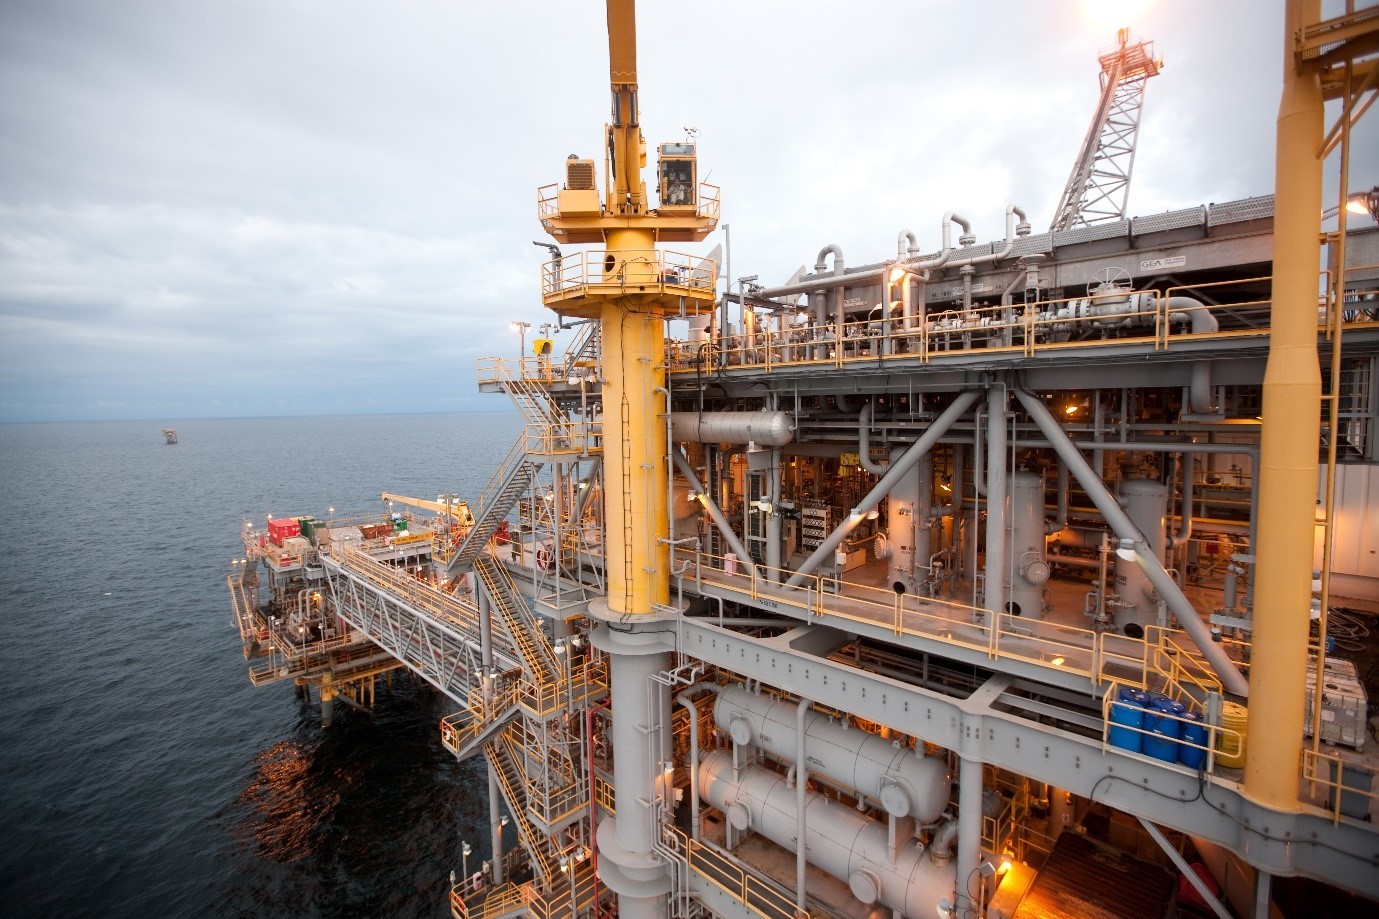
On 2 November Kosmos Energy reported results for the third quarter of 2026. Revenue came in at USD 410.1 million, up 31.9% year on year, but net profit was negative again at minus USD 43.0 million, with a net margin of -10.5% against -40.0% a year earlier. Operating cash flow stayed positive at USD 164.0 million, and net debt at the end of September stood at USD 2.5 billion. With an LTM EV/EBITDA of 38.8 and net debt/EBITDA of 23.56, the stock looks expensive against its own history, so our verdict on the share is neutral.
Key takeaways
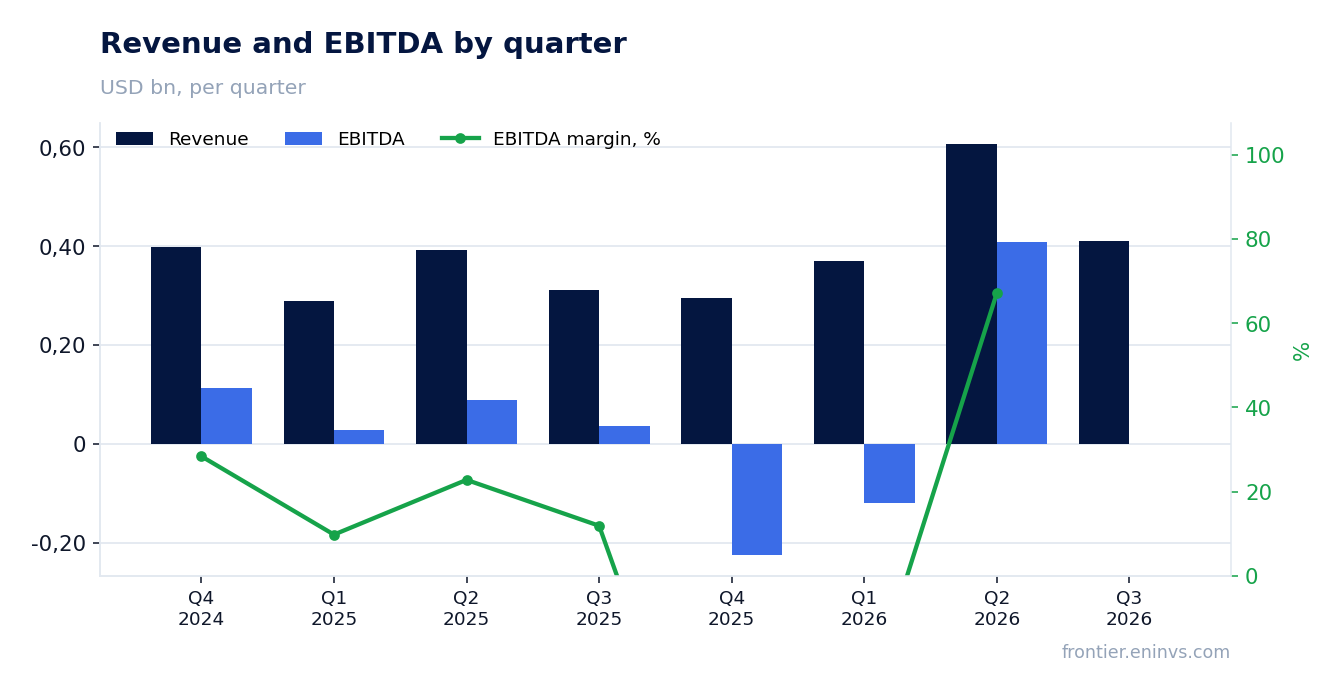
— Q3 revenue rose 31.9% year on year, but growth decelerated from 54.7% in Q2
— The net loss narrowed to USD 43.0 million, lifting the margin from -40.0% to -10.5%
— Operating cash flow of USD 164.0 million remains the main source of funds despite the loss
— Net debt fell from USD 2.9 billion on 30 September 2025 to USD 2.5 billion on 30 September 2026
— LTM EV/EBITDA of 38.8 and net debt/EBITDA of 23.56 point to a rich valuation
— The market reaction – down 13.5% on the release day and the same by 2 November – reflects disappointment with the weak result
Attractiveness
Key figures, USD bn
| Metric | Q3 2025 | Q3 2026 | Change |
|---|---|---|---|
| Revenue | 0.31 | 0.41 | +31.9% |
| EBITDA | 0.04 | — | — |
| Operating profit | -0.11 | — | — |
| Net profit | -0.12 | -0.04 | — |
| Operating cash flow | -0.03 | 0.16 | to profit |
| Capex | 0.07 | — | — |
| EBITDA margin | 11.9% | — | — |
| Net margin | -40.0% | -10.5% | +29.5 pp |
Q3 revenue rose 31.9% year on year, but growth decelerated from 54.7% in Q2
Revenue for the third quarter of 2026 came in at USD 410.1 million, up 31.9% on the third quarter of 2025. Growth remains in double digits but is markedly slower than in the second quarter, when revenue rose 54.7% year on year. The deceleration suggests the quarterly momentum is fading.
For context, revenue fell 23.7% in Q3 2025 and 26.0% in Q4 2025. The current growth is a rebound after a weak prior year, but its durability is not yet proven. The next report will show whether the positive trend holds.
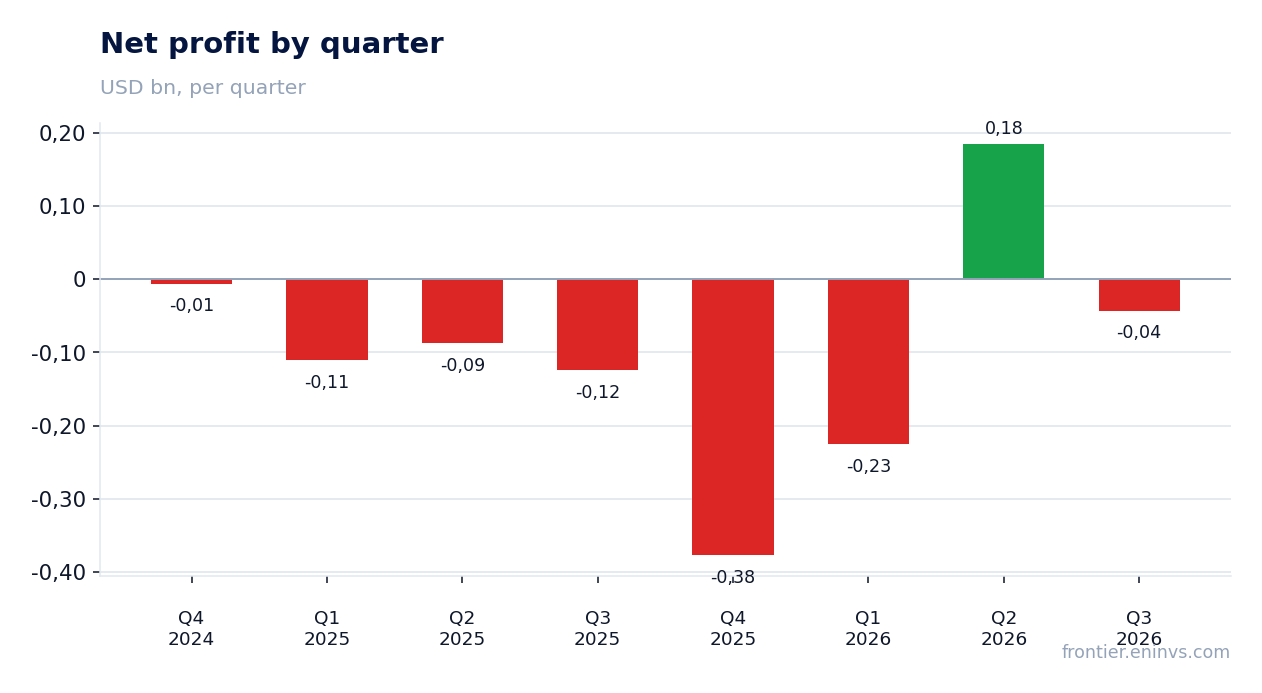
The net loss narrowed to USD 43.0 million, lifting the margin from -40.0% to -10.5%
The net loss for the third quarter of 2026 was USD 43.0 million, against a loss of USD 124.3 million a year earlier. The net margin improved from -40.0% to -10.5%, meaning the company is still losing money, but far less.
The margin improvement alongside revenue growth implies costs are rising more slowly than revenue. Whether this shift is durable depends on how one-off the factors behind the result were. The report does not disclose the specific drivers, so we limit ourselves to stating that the loss narrowed but did not disappear.
Operating cash flow of USD 164.0 million remains the main source of funds despite the loss
Operating cash flow for the third quarter of 2026 was USD 164.0 million. That is a positive figure that covers part of the company's financing needs despite the net loss of USD 43.0 million.
Over the trailing twelve months operating cash flow amounted to USD 480.9 million. That volume of cash matters for servicing debt and sustaining investment. With a net loss, however, the durability of this flow depends on revenue and cost dynamics.
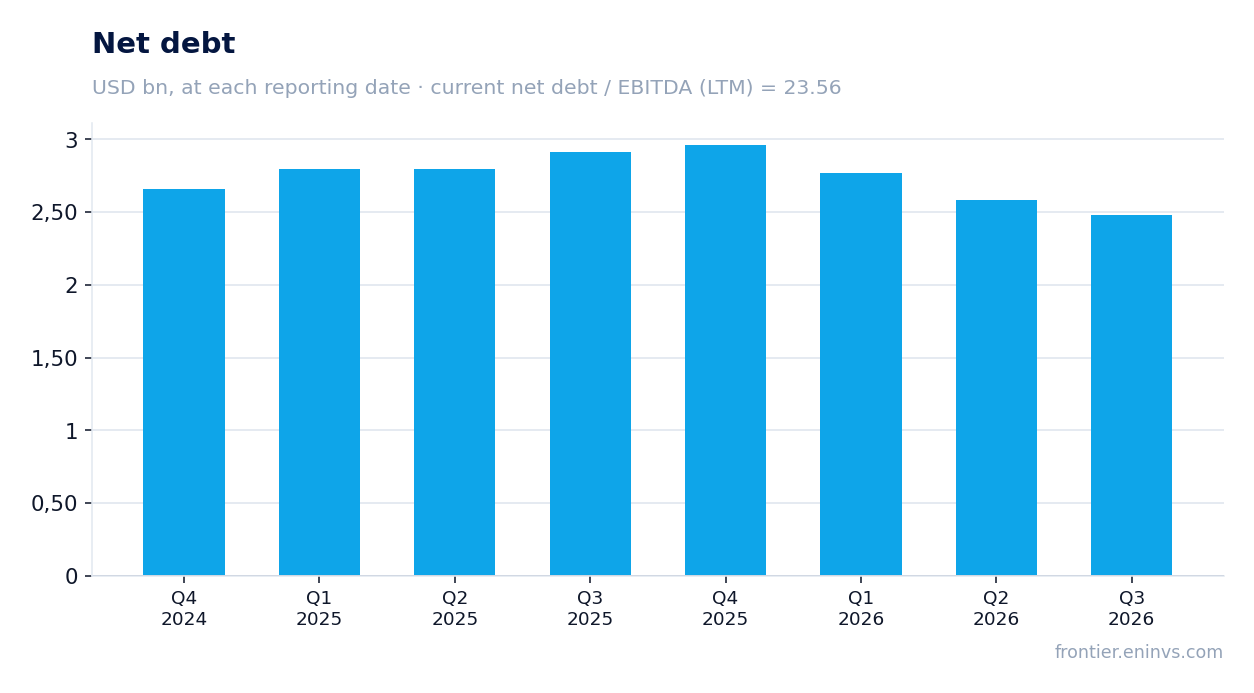
Net debt fell from USD 2.9 billion on 30 September 2025 to USD 2.5 billion on 30 September 2026
Net debt on 30 September 2026 stood at USD 2.5 billion, against USD 2.9 billion on 30 September 2025, a reduction of USD 0.4 billion over the year. Over the quarter the figure fell from USD 2.6 billion on 30 June 2026 to USD 2.5 billion on 30 September 2026.
The decline in debt alongside positive operating cash flow indicates that the company is directing part of its funds to reducing liabilities. The ratio of net debt to LTM EBITDA stands at 23.56, a high level that constrains financial flexibility.
LTM EV/EBITDA of 38.8 and net debt/EBITDA of 23.56 point to a rich valuation
LTM EV/EBITDA stands at 38.8. That is a high multiple, reflecting both a low EBITDA base and substantial debt in the capital structure. With a market capitalisation of USD 1.18 billion and net debt of USD 2.5 billion, the enterprise is valued well above equity.
Return on equity is negative at -25.0%, confirming losses at the net income level. A net debt/EBITDA ratio of 23.56 is a level that calls for a cautious approach to valuation. Reducing debt and restoring profit are the two conditions under which the multiples could normalise.
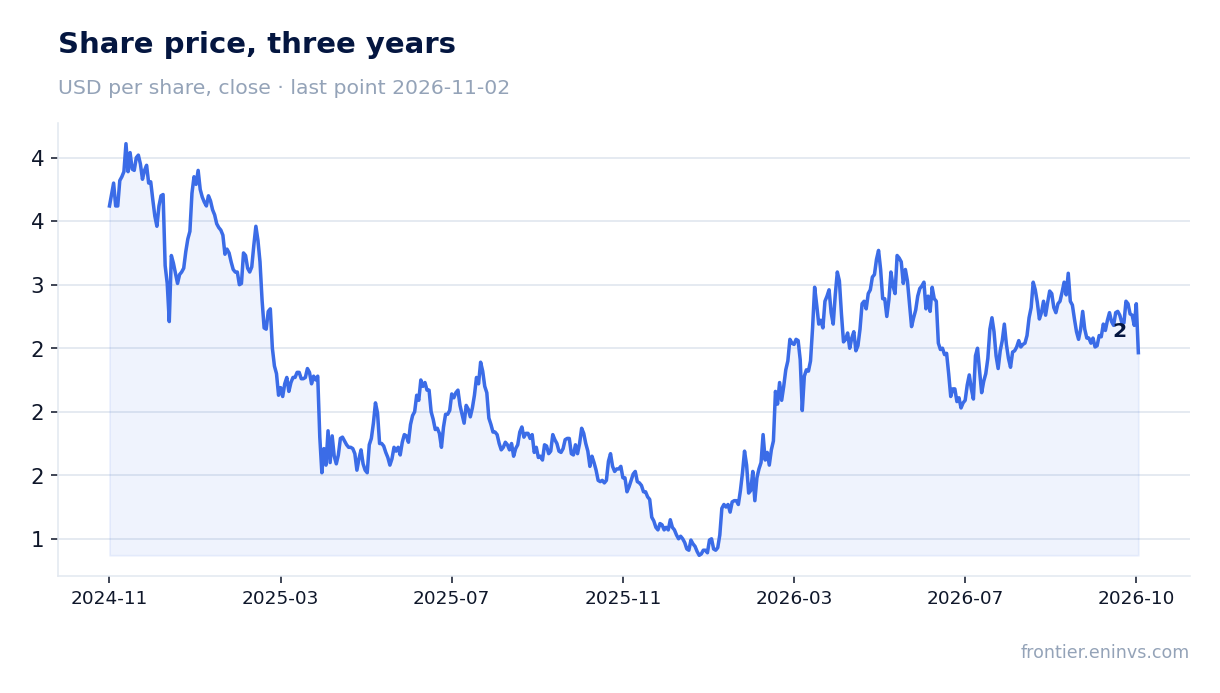
The market reaction – down 13.5% on the release day and the same by 2 November – reflects disappointment with the weak result
On the day the report was published the share fell 13.5%, and by 2 November the decline remained at the same level. The closing price before the release was USD 2.85, so the market reacted to the persistence of the loss and the high debt burden.
That reaction shows investors had expected a stronger profit recovery. For further gains the stock needs confirmation that operating cash flow is durable and that debt will continue to fall.
Valuation on the latest reported figures
| Metric | Value |
|---|---|
| Market cap | 1.18 bn USD |
| EV/EBITDA (LTM) | 38.8 |
| P/B | 2.23 |
| Net debt / EBITDA (LTM) | 23.56 |
| Operating cash flow (LTM) | 0.48 bn |
| ROE | -25.0% |
Bottom line
The strengths of the report are revenue growth of 31.9% and a narrowing of the net loss to USD 43.0 million, along with a reduction in net debt to USD 2.5 billion. However, the company remains loss-making, and the multiples – EV/EBITDA of 38.8 and net debt/EBITDA of 23.56 – point to a rich valuation. The market reacted with a 13.5% decline, reflecting disappointment. Our verdict is neutral: the current price does not offer a sufficient margin of safety given the persistent risks.
Open the company's financial profile KOS →
See also: market overview · valuation map · stock screeners