Kimbell Royalty Partners: oil up 32%, but hedges and fees ate almost the whole effect
On 5 November Kimbell Royalty Partners reported third-quarter 2026 results. The average WTI price in the quarter was 85.4 dollars against 64.9 a year earlier (+31.7%), while Henry Hub gas fell 6.2% to 2.893 dollars. Revenue rose 7.1% year on year to 86.3 million dollars and EBITDA 7.2% to 64.2 million, but at the quarter's prices and year-ago volumes and costs the company should have earned 70.2 million of EBITDA on our calculation: the 6.0 million gap is explained by a 13.1 million hedge loss booked inside revenue and weak gas realisations. At 7.8 times EV/EBITDA against its own three-year average of 8.8 and a 10.6% dividend yield the unit is cheaper than its history, but the portal model implies minus 44% to fair value, so the verdict is neutral.
Key takeaways
— Oil rose 31.7% while gas fell 6.2% – hedges took almost the entire oil gain
— At the quarter's prices EBITDA should have been 70.2 million on our calculation, but came in at 64.2 million – the gap came from hedges and gas realisations
— Production rose to a record 27,565 barrels of oil equivalent per day, but only 41 days of the quarter included the acquired production
— Cash G&A of 2.48 dollars per barrel of oil equivalent is a low base, but 4.4 million of non-cash costs weigh on profit
— The 13.1 million hedge loss sits inside revenue and is already in EBITDA, while the 11.8 million loss on derivatives net of settlements is below operating profit
— Debt of 0.5 billion dollars at 2.09 times EBITDA is moderate, and redeeming half the preferred units for 100.2 million will simplify the capital structure
— The 0.45 dollar per unit distribution at a 10.6% yield and a 75% payout of cash flow is the main argument for the unit
Attractiveness
Key figures, USD bn
| Metric | Q3 2025 | Q3 2026 | Change |
|---|---|---|---|
| Revenue | 0.08 | 0.09 | +7.1% |
| EBITDA | 0.06 | 0.06 | +7.2% |
| Operating profit | 0.03 | 0.03 | +8.5% |
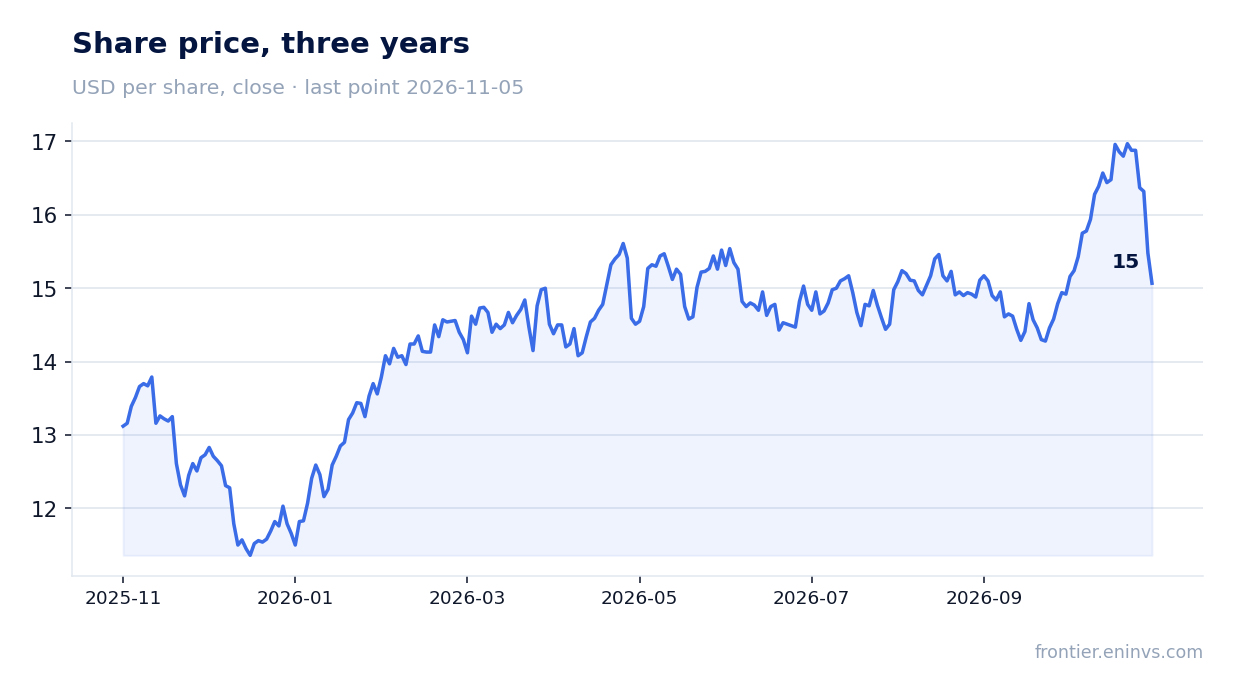
| Net profit | 0.02 | 0.02 | -22.7% |
| Operating cash flow | 0.06 | 0.06 | -7.4% |
| Capex | 0.00 | — | — |
| EBITDA margin | 74.3% | 74.4% | +0.1 pp |
| Net margin | 27.7% | 20.0% | -7.7 pp |
Oil rose 31.7% while gas fell 6.2% – hedges took almost the entire oil gain
The average WTI price in the third quarter of 2026 was 85.4 dollars per barrel against 64.9 a year earlier, up 31.7%. Henry Hub gas, which accounts for half of revenue in the portal model, fell 6.2% to 2.893 dollars. Against the previous quarter oil lost 7.9% and gas 1.1%.
Spot is now above the quarterly average: WTI at 91.3 dollars on 6 November (+6.9%) and Henry Hub at 2.99 dollars (+3.4%). For a company with 84% of its expected fourth-quarter oil production unhedged, that is a direct argument for next quarter's revenue.
Commodity prices: period average and now
| Benchmark | Year ago | Q3 2026 | YoY | Spot 2026-11-06 |
|---|---|---|---|---|
| Henry Hub, USD | 3,08 | 2,89 | -6,2% | 2,99 |
| WTI, USD | 64,9 | 85,4 | +31,7% | 91,3 |
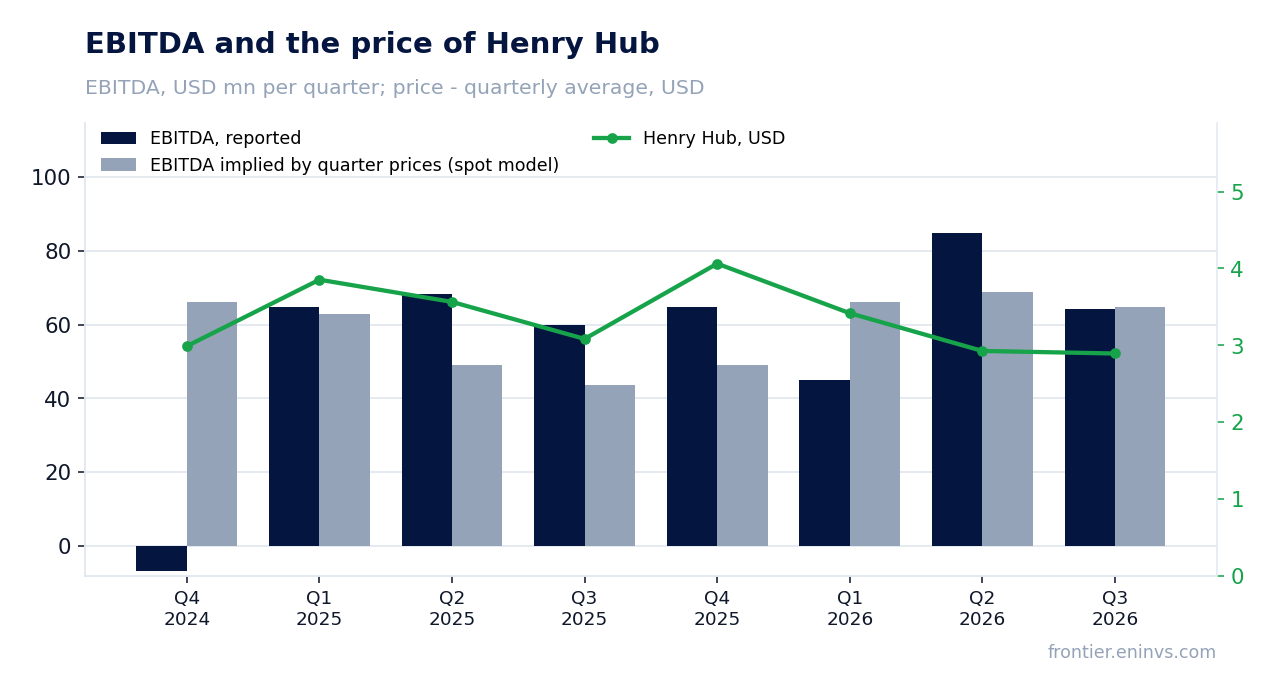
At the quarter's prices EBITDA should have been 70.2 million on our calculation, but came in at 64.2 million – the gap came from hedges and gas realisations
Holding third-quarter 2025 volumes and non-commodity costs and moving only prices to third-quarter 2026 levels would have produced revenue of 90.9 million dollars and EBITDA of 70.2 million. The company actually reported 86.3 million of revenue and 64.2 million of EBITDA, 4.6 million and 6.0 million below the implied level.
The gap has two causes from the release. A 13.1 million dollar loss on commodity derivatives is booked inside revenue under the line '(Loss) gain on commodity derivative instruments, net' and is already in EBITDA. The second is gas realisation: with Henry Hub averaging 2.893 dollars, the company sold gas at 2.21 dollars per Mcf, a discount to the benchmark.
The portal's spot model, re-priced from the average of the previous four quarters, expected EBITDA of 64.8 million and revenue of 87 million. The reported 64.2 million and 86.3 million came in 0.9% and 0.8% below – within the normal spread, which ranged from minus 31.8% to plus 37.5% in the four prior periods.
What the prices implied and what the company earned
| Base (Q3 2025) | Implied at period prices | Reported | Reported vs implied | |
|---|---|---|---|---|
| Revenue, USD mn | 80,6 | 90,9 | 86,3 | -5,0% |
| EBITDA, USD mn | 59,9 | 70,2 | 64,2 | -8,5% |
| EBITDA, portal spot model, USD mn | — | 64,8 | 64,2 | -0,9% |
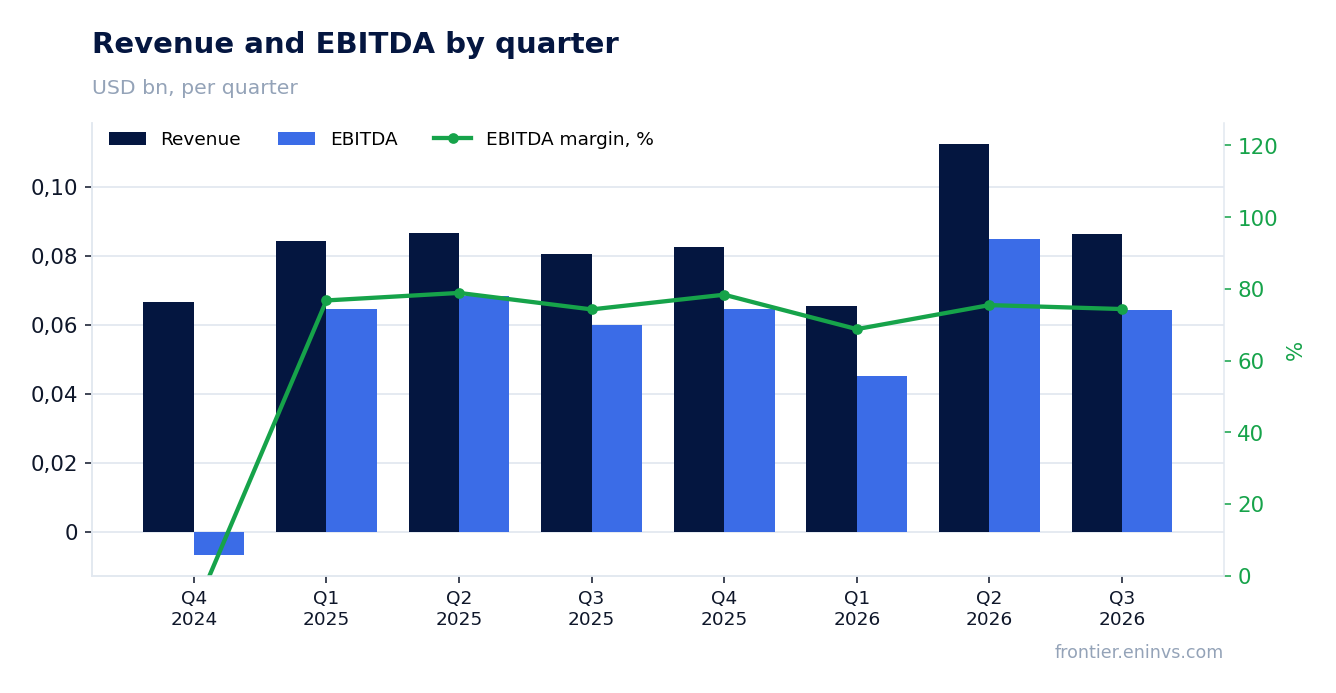
Production rose to a record 27,565 barrels of oil equivalent per day, but only 41 days of the quarter included the acquired production
Average daily production in the third quarter was 27,565 barrels of oil equivalent, of which 34% was oil, 21% natural gas liquids and 45% natural gas. That is a record for a third quarter, but only 41 days of it came from the 221.2 million dollar acquisition closed on 21 August with an effective date of 1 June.
After the closing the company estimates run-rate production at 28,910 barrels of oil equivalent per day. Including the acquired production from the effective date to 30 September, oil, gas and NGL revenue would have been 104.6 million dollars against the reported 96.9 million, and adjusted EBITDA 87.5 million against 80.4 million.
There are 93 rigs drilling on the company's acreage, about 16% of all land rigs in the continental United States and two more than in the second quarter. Reserve life at the current production rate is 13.3 years.
Production, realised price and unit cost (company release)
| Metric | Year ago | Reported period | YoY |
|---|---|---|---|
| Average daily production, Boe/d | — | 27 565 | — |
| Oil, % | — | 34,00 | — |
| Oil (before hedges), $/Bbl | — | 86,18 | — |
| Natural gas (before hedges), $/Mcf | — | 2,21 | — |
| NGLs (before hedges), $/Bbl | — | 25,23 | — |
| Cash G&A, $/Boe | — | 2,48 | — |
Cash G&A of 2.48 dollars per barrel of oil equivalent is a low base, but 4.4 million of non-cash costs weigh on profit
General and administrative expense in the third quarter was 10.7 million dollars, of which 6.3 million was cash, or 2.48 dollars per barrel of oil equivalent. The remaining 4.4 million was non-cash unit-based compensation, or 1.73 dollars per barrel.
For a company that does not drill or carry lease operating costs, cash cost of 2.48 dollars per barrel is almost the entire cost base. That is why the EBITDA margin held at 74.4% against 74.3% a year earlier despite the hedge loss: production and ad valorem taxes of 7.5 million and marketing deductions of 4.0 million grew more slowly than revenue.
The 13.1 million hedge loss sits inside revenue and is already in EBITDA, while the 11.8 million loss on derivatives net of settlements is below operating profit
The 13.1 million dollar loss on commodity derivatives is booked inside revenue, so it directly reduced both revenue and EBITDA. Together with the discount to the gas benchmark it explains the gap between implied and reported EBITDA.
Separately the release shows a loss on derivatives net of settlements of 11.8 million dollars – that line is used in the cash flow and adjusted EBITDA reconciliation but is not in our EBITDA figure. The hedge book at 30 September: for the fourth quarter of 2026, 150,144 barrels of oil are hedged at 63.33 dollars and 1,324,800 MMBTU of gas at 3.94 dollars. With WTI spot at 91.3 dollars those swaps will keep producing losses next quarter.
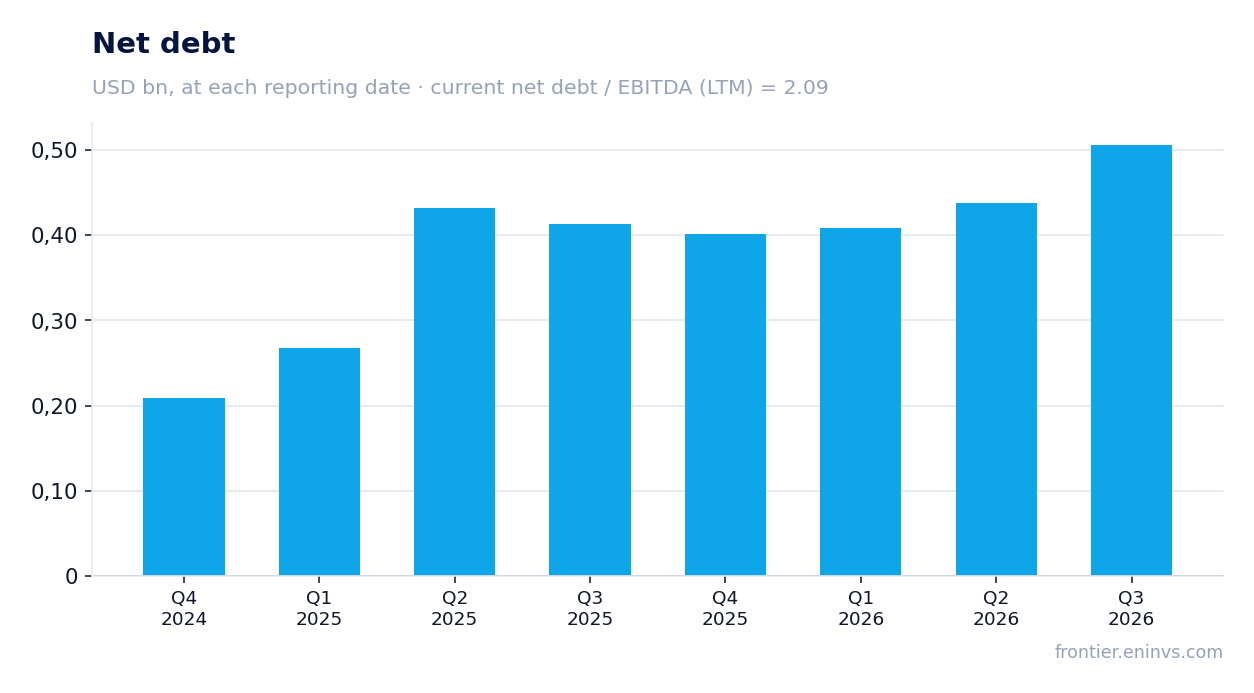
Debt of 0.5 billion dollars at 2.09 times EBITDA is moderate, and redeeming half the preferred units for 100.2 million will simplify the capital structure
Net debt at 30 September 2026 was 0.5 billion dollars against 0.4 billion at 30 June 2026 and 0.4 billion at 30 September 2025. Net debt to trailing-twelve-month EBITDA is 2.09. The company itself calculates the ratio on adjusted EBITDA and gets 1.5, but both figures describe a level, not a trend.
Debt rose with acquisitions: since June 2026 the company has closed 367 million dollars of deals. On 15 October the borrowing base and commitments on the revolving credit facility were raised from 660 million to 750 million dollars, and on 16 October it gave notice to redeem half the remaining Series A preferred units for about 100.2 million dollars, with closing expected on 16 November.
Operating cash flow in the third quarter was 58.1 million dollars against 62.8 million a year earlier. The company has almost no capital expenditure: it owns mineral and royalty interests and does not fund drilling, so cash flow goes almost entirely to distributions and debt.
The 0.45 dollar per unit distribution at a 10.6% yield and a 75% payout of cash flow is the main argument for the unit
For the third quarter of 2026 the company declared a cash distribution of 0.45 dollars per unit – 75% of cash available for distribution of 57.4 million dollars, or 0.54 dollars per unit. The remaining 25% will go to repay about 18.8 million dollars under the credit facility. A year earlier the distribution was 0.35 dollars per unit.
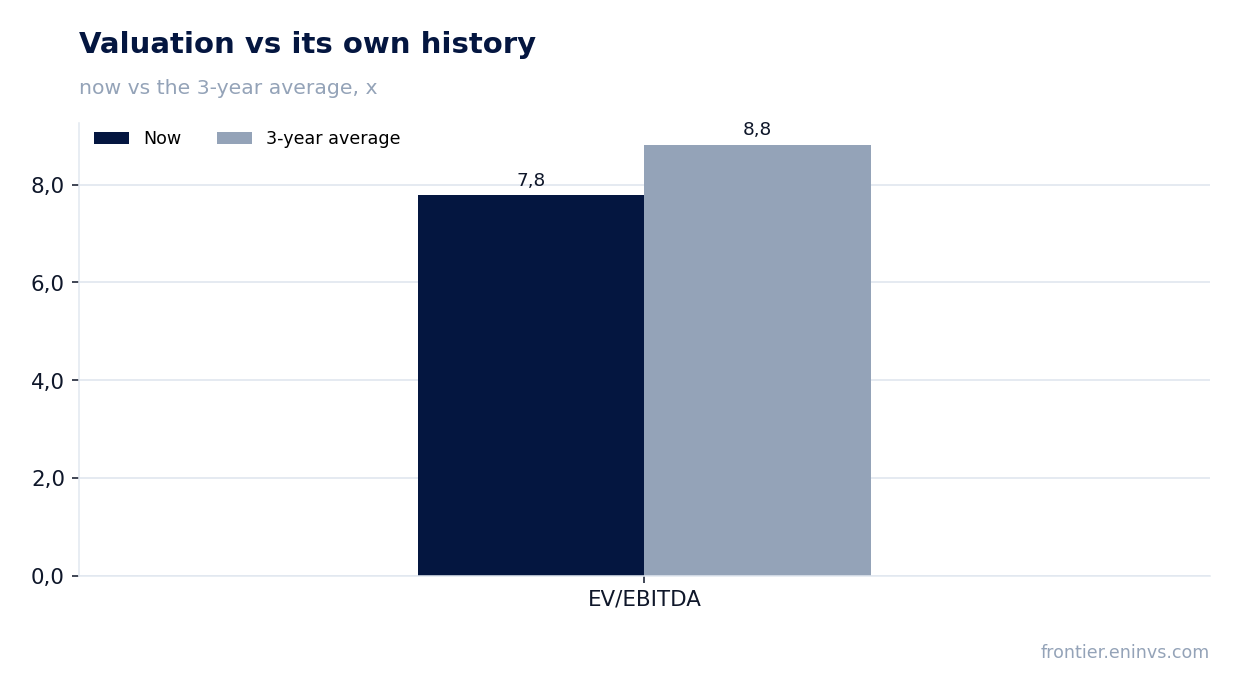
At the 16.88 dollar price on 30 October the yield is 10.7% annualised, and 10.6% on our trailing-twelve-month figure. About 76% of the payout is expected to be a return of capital and not subject to dividend tax. The facts give no key rate to compare against, so we state the level only.
Our estimate for the next quarter's payout is about 0.45 dollars per unit if oil and gas prices hold and the payout ratio stays at 75%. It rests on three things: the WTI price, now 6.9% above the quarterly average; production after a full quarter with the acquired assets; and the absence of large one-off hedge losses. A fall in oil below 63 dollars – the level of the fourth-quarter swaps – or more debt-funded acquisitions could cut the payout.
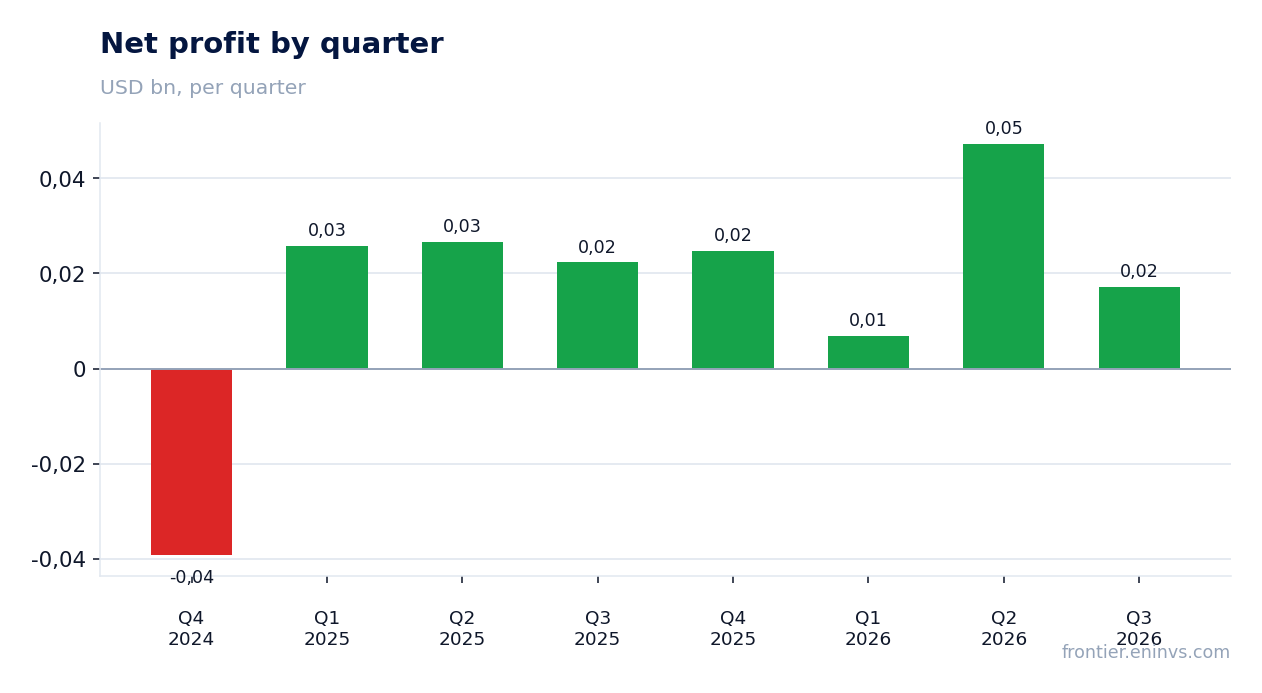
A multiple of 7.8 against its own average of 8.8 makes the unit cheaper than its history, but the portal model sees minus 44%
EV/EBITDA on the trailing twelve months is 7.8 against its own three-year average of 8.8, 12% below. P/E on the trailing twelve months is 15.4 and return on equity 8.6%. On this multiple the unit is cheaper than its three-year average.
But LTM earnings were earned at past prices. On the portal's spot model, annual EBITDA at today's prices is 266.6 million dollars against 258.8 million LTM (+3.0%), EV/EBITDA is 7.5 and net debt to EBITDA 1.9. That is the base from which valuation should start.
The portal model, re-pricing EBITDA to current prices at the target multiple, implies minus 44% to fair value. That is our own estimate, not a market consensus. The unit's reaction confirms the caution: it lost 2.7% on the release day and has stayed there since.
Valuation on the latest reported figures
| Metric | Value |
|---|---|
| Market cap | 1.49 bn USD |
| P/E (LTM) | 15.4 |
| EV/EBITDA (LTM) | 7.8 |
| P/B | 2.42 |
| Net debt / EBITDA (LTM) | 2.09 |
| Operating cash flow (LTM) | 0.23 bn |
| ROE | 8.6% |
| Dividend yield (12m) | 10.6% |
| EV/EBITDA, 3-year average | 8.8 |
Bottom line
The quarter's strength was production: a record 27,565 barrels of oil equivalent per day and 93 rigs on the acreage, with run-rate production at 28,910 barrels after the acquisition. But hedges took almost the entire 31.7% oil gain: the 13.1 million dollar loss is booked inside revenue, and on our calculation EBITDA came in 6.0 million below what prices allowed. The 0.45 dollar distribution at a 10.6% yield and a 75% payout of cash flow is a real argument, but it rests on the oil price, not on the company's result. A multiple of 7.8 against its own average of 8.8 signals cheapness, but the portal model implies minus 44%, so the verdict is neutral: the unit is fairly valued at current prices, and a change of view needs either a sustained WTI above 90 dollars or the hedge pressure easing in the fourth quarter.
Open the company's financial profile KRP →
See also: market overview · valuation map · stock screeners