Cheniere Energy: revenue accelerated to +37.3%, but profit rose only 11.5% – minority interest and interest costs absorb the effect
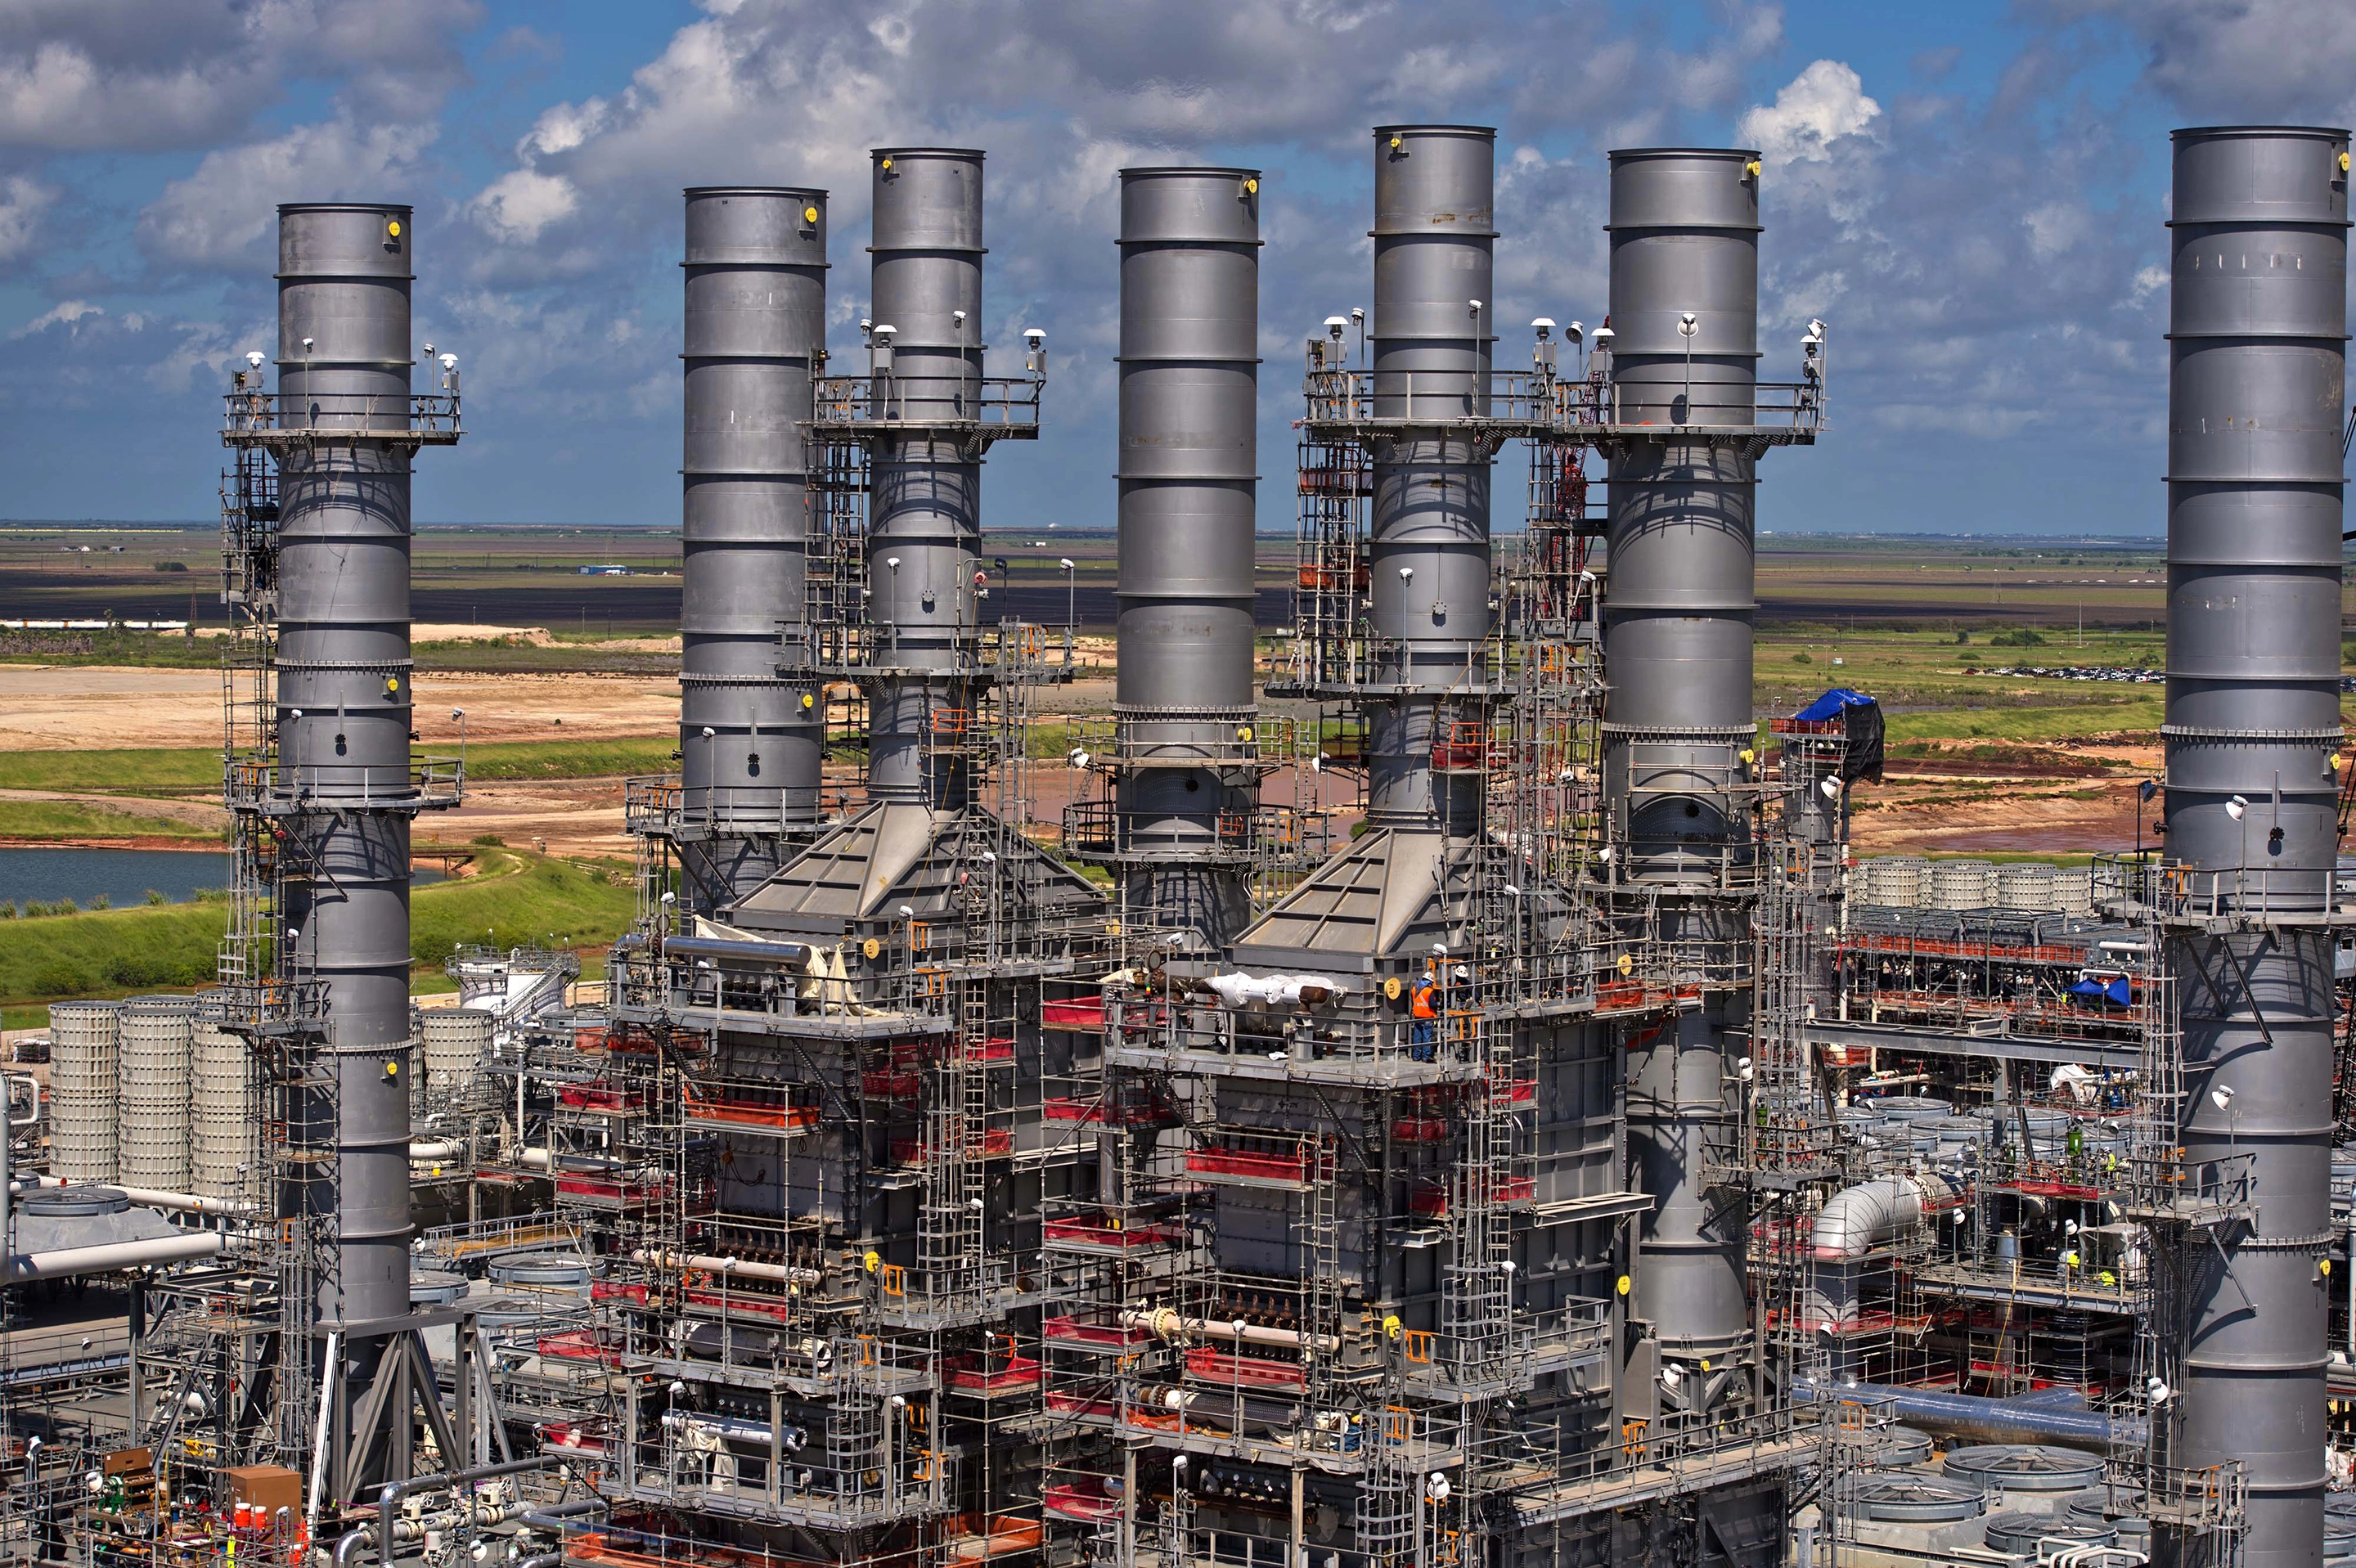
On October 29, Cheniere Energy reported third-quarter 2026 results. Revenue came in at USD 6,097 million, EBITDA at USD 2,308 million and net profit at USD 1,170 million. Revenue growth accelerated versus the second quarter (+23.5%), but net profit added only 11.5% year on year, and the net margin fell to 19.2% from 23.6%. At the current price the share looks neutral: the EV/EBITDA multiple is above its own three-year history, and profit growth lags revenue.
Key takeaways
— Revenue grew 37.3% year on year, an acceleration from +23.5% in the second quarter
— EBITDA added 46.0%, and the EBITDA margin rose to 37.9% from 35.6%
— Net profit grew only 11.5% because minority interest and interest costs took part of the operating result
— Free cash flow for the quarter was USD 1,734 million with capital expenditure of USD 732 million
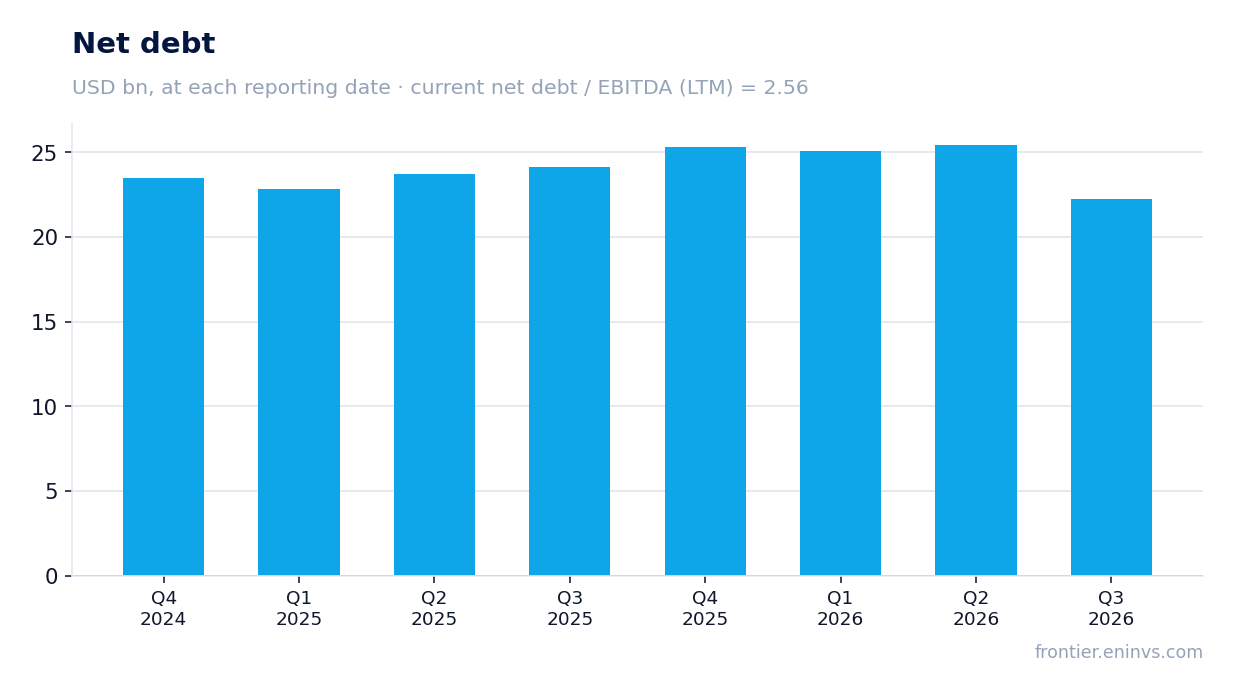
— Net debt fell to USD 22.3 billion from USD 25.5 billion at the end of June
— The dividend was raised by more than 12% to USD 0.625 per share, while the annual yield remains modest at 0.7%
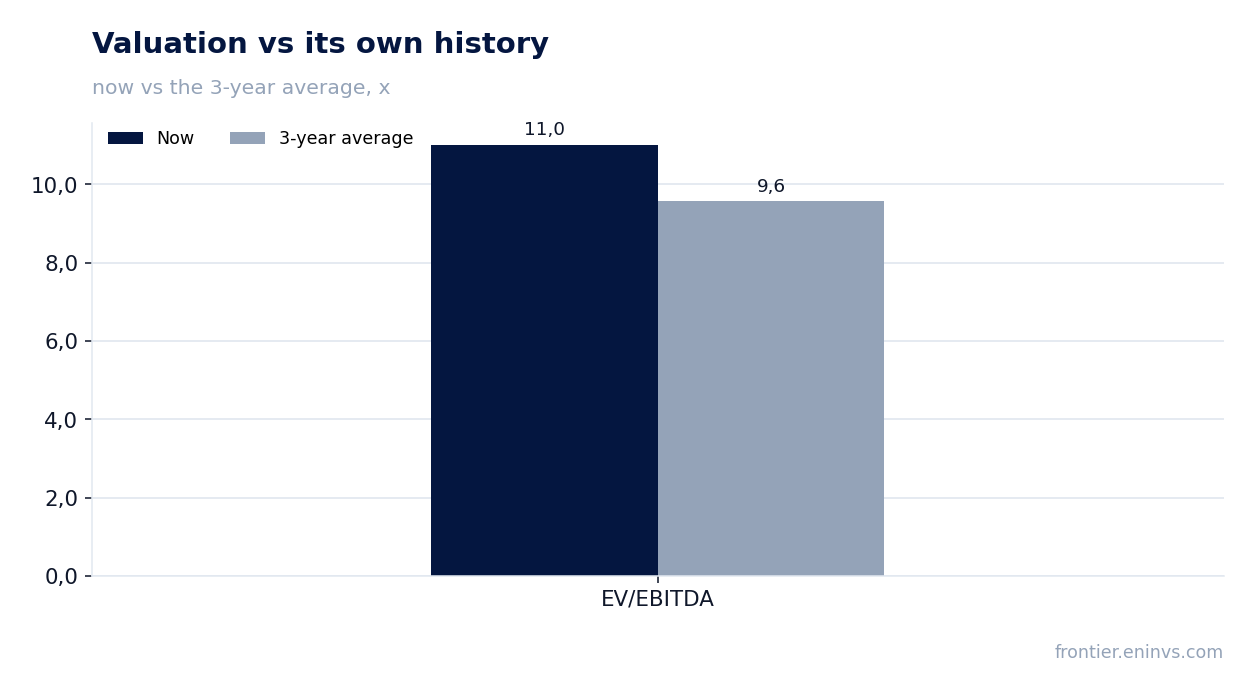
— EV/EBITDA of 11.0 is above its own three-year average of 9.6, meaning the share is more expensive than its history
Attractiveness
Key figures, USD bn
| Metric | Q3 2025 | Q3 2026 | Change |
|---|---|---|---|
| Revenue | 4.44 | 6.10 | +37.3% |
| EBITDA | 1.58 | 2.31 | +46.0% |
| Operating profit | 1.24 | 1.92 | +54.1% |
| Net profit | 1.05 | 1.17 | +11.5% |
| Operating cash flow | 1.43 | 2.47 | +73.1% |
| Capex | 0.69 | 0.73 | +6.6% |
| EBITDA margin | 35.6% | 37.9% | +2.3 pp |
| Net margin | 23.6% | 19.2% | -4.4 pp |
Revenue grew 37.3% year on year, an acceleration from +23.5% in the second quarter
Revenue for the third quarter of 2026 was USD 6,097 million, 37.3% above the year-earlier level. In the second quarter growth was more modest at 23.5%, so the dynamics accelerated. The company attributes the increase to higher recognised LNG volumes and higher margins per million British thermal units.
The number of exported cargoes rose to 188 from 163 a year earlier, and LNG volumes shipped rose to 684 TBtu from 586. This confirms that revenue growth rests on physical volumes, not only on prices. In August the company completed the seventh train of the CCL Stage 3 project, expanding production capacity by more than 20%.
The acceleration in revenue is a strong signal, but it did not translate into profit in the same proportion. The next section shows that part of the operating result went to other holders and creditors.
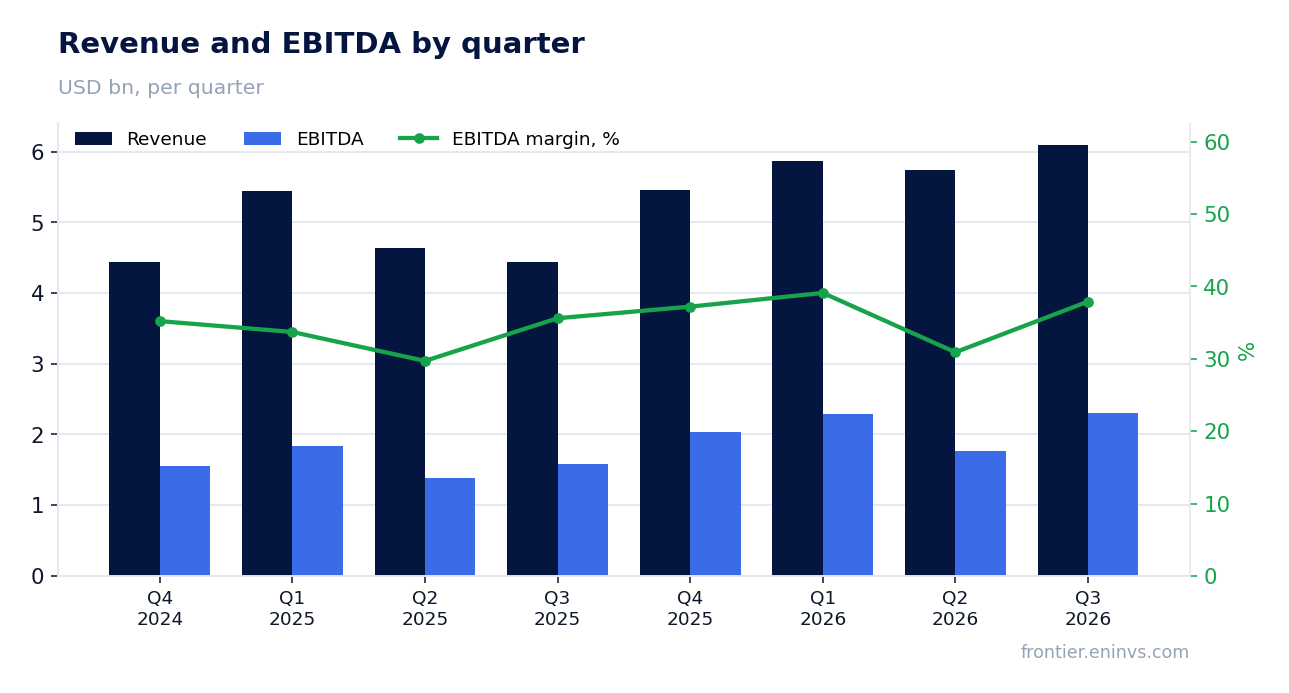
EBITDA added 46.0%, and the EBITDA margin rose to 37.9% from 35.6%
EBITDA for the third quarter was USD 2,308 million, 46.0% above the year-earlier level. The EBITDA margin rose to 37.9% from 35.6% a year earlier. EBITDA growing faster than revenue means operating costs rose more slowly than income.
The company links EBITDA growth to higher LNG volumes and margins. At the same time, cost of sales rose to USD 3,207 million from USD 1,750 million, partly due to changes in the fair value of commodity derivatives. These non-cash items are excluded from adjusted EBITDA, so the operating picture looks better than GAAP gross profit.
The 2.3 percentage point margin gain is positive, but it is partly explained by revenue recognition and derivatives. The next quarter will test whether this level holds.
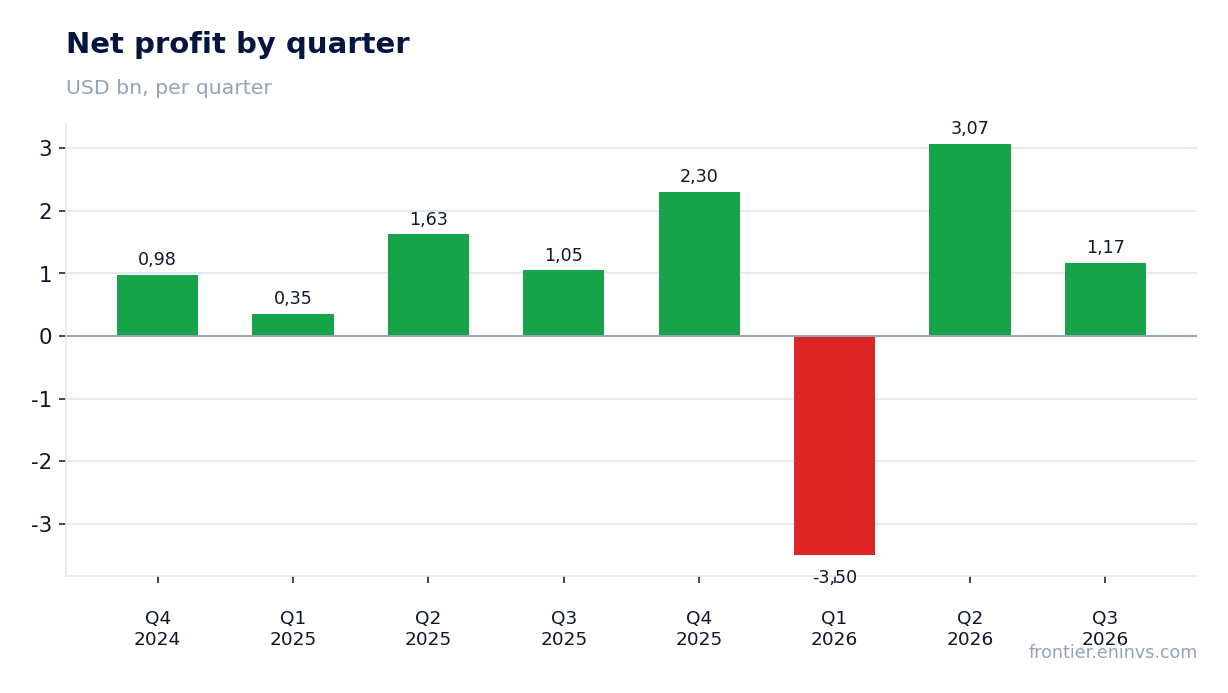
Net profit grew only 11.5% because minority interest and interest costs took part of the operating result
Net profit attributable to Cheniere was USD 1,170 million, 11.5% above the year-earlier level. The net margin fell to 19.2% from 23.6%. With revenue up 37.3% and EBITDA up 46.0%, this profit dynamic looks modest.
The reason lies in the structure of the result: pre-tax profit before minorities rose to USD 1,654 million from USD 1,599 million, but minority interest increased to USD 316 million from USD 247 million, and interest expense rose to USD 285 million from USD 236 million. In addition, income tax was USD 168 million versus USD 303 million a year earlier, which partly supported net profit.
Thus, the operating result grew much more than profit for Cheniere shareholders. This matters for valuation: part of the growth goes to partners in Cheniere Partners, not to holders of Cheniere shares.
Free cash flow for the quarter was USD 1,734 million with capital expenditure of USD 732 million
Operating cash flow for the third quarter was USD 2,466 million, capital expenditure – USD 732 million. Free cash flow was therefore USD 1,734 million. This is a substantial amount that covers both dividends and share buybacks.
During the quarter the company deployed about USD 1.5 billion under its capital allocation plan: it repurchased 2.8 million shares for USD 731 million, paid dividends of USD 114 million and invested USD 740 million in growth. Capital expenditure rose from USD 687 million a year earlier, linked to expansion projects.
Cash flow remains strong, but part of it goes to support growth and payouts. For dividend sustainability, not only the absolute flow but also the debt burden matters.
Net debt fell to USD 22.3 billion from USD 25.5 billion at the end of June
Net debt as of September 30, 2026 was USD 22,268 million. From June 30, 2026 it fell from USD 25.5 billion to USD 22.3 billion, a decrease of USD 3.2 billion. Over twelve months it fell from USD 24.1 billion to USD 22.3 billion.
The ratio of net debt to EBITDA over the last 12 months is 2.56. This is a moderate level for a capital-intensive business. Interest expense for the quarter was USD 285 million, which against EBITDA of USD 2,308 million leaves comfortable coverage.
The debt reduction was supported by strong cash flow and repayment of long-term obligations. In September SPL repaid about USD 54 million of senior secured notes. In October S&P upgraded Cheniere Corpus Christi Holdings to A- with a stable outlook.
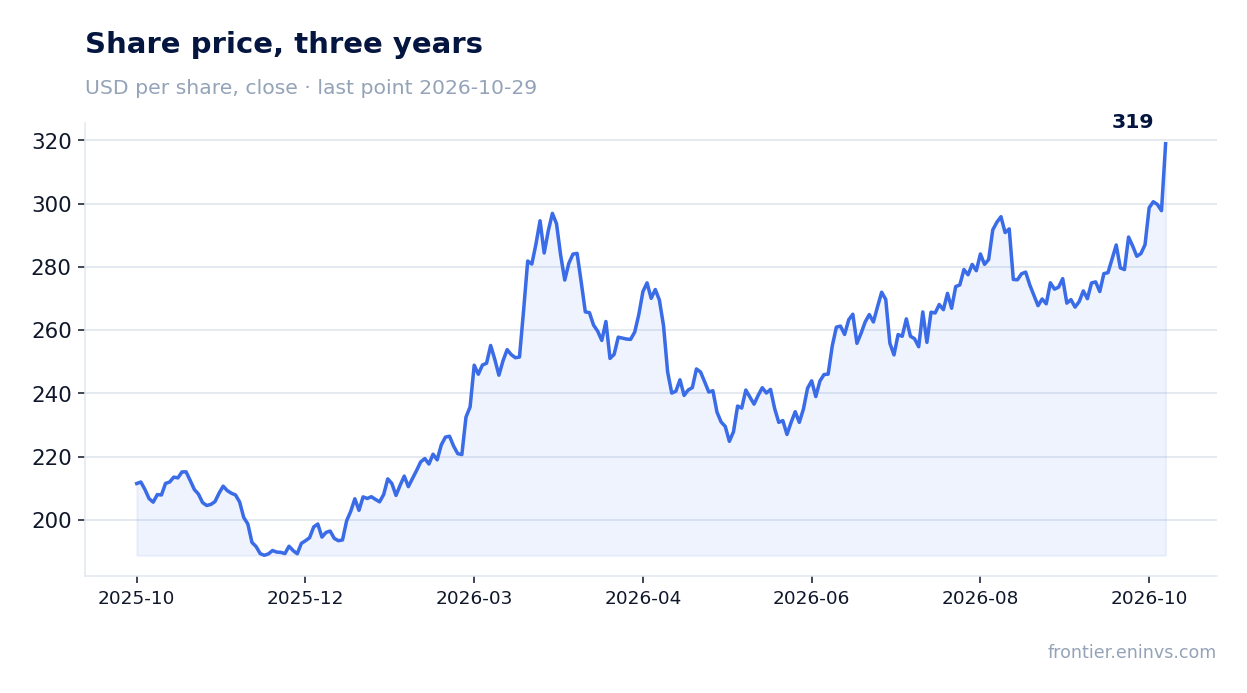
The dividend was raised by more than 12% to USD 0.625 per share, while the annual yield remains modest at 0.7%
The board declared a quarterly dividend of USD 0.625 per share, more than 12% above the previous quarter. Payment is scheduled for November 17, 2026. For the third quarter the company paid dividends of USD 114 million.
The trailing twelve-month yield is 0.7%. This is a modest level explained by the high share price and the priority given to buybacks. The company repurchased 2.8 million shares for USD 731 million in the quarter, significantly more than dividend payments.
The 12% dividend increase is a positive signal, but for a shareholder the main return of capital comes through buybacks, not the dividend. At the current yield the dividend is not the main argument for the share.
EV/EBITDA of 11.0 is above its own three-year average of 9.6, meaning the share is more expensive than its history
The trailing twelve-month EV/EBITDA multiple is 11.0 against its own three-year average of 9.6. The share trades 15% above its historical valuation on this multiple. The trailing P/E is 23.1.
Revenue and EBITDA growth support the valuation, but the current multiple already reflects part of the positive. On the portal's model, which re-prices EBITDA at current commodity prices at the target EV/EBITDA, the upside to fair value is +37%. This is our own model, not a market consensus.
Further multiple expansion requires sustained profit growth, not just revenue. While net profit grows more slowly than EBITDA, the valuation remains vulnerable.
Valuation on the latest reported figures
| Metric | Value |
|---|---|
| Market cap | 70.3 bn USD |
| P/E (LTM) | 23.1 |
| EV/EBITDA (LTM) | 11.0 |
| P/B | 8.88 |
| Net debt / EBITDA (LTM) | 2.56 |
| Operating cash flow (LTM) | 7.18 bn |
| ROE | 73.4% |
| Dividend yield (12m) | 0.7% |
| EV/EBITDA, 3-year average | 9.6 |
Bottom line
The strong side of the report was revenue growth of 37.3% and EBITDA growth of 46.0% with the EBITDA margin rising to 37.9%. However, net profit grew only 11.5% and its margin fell to 19.2%: part of the operating result went to minorities and creditors. Cash flow remains strong, net debt fell to USD 22.3 billion, and the dividend was raised by more than 12%. The main question for a holder is whether profit can catch up with revenue while the EV/EBITDA multiple of 11.0 is above its own three-year average of 9.6. The verdict is neutral: growth in operating metrics is already largely priced in.
Open the company's financial profile LNG →
See also: market overview · valuation map · stock screeners