Lundin Mining: profit up 40.5% but revenue growth slowed to 10.1% — the gain rests on metal prices, not volume
Lundin Mining reported third-quarter 2026 results: revenue of USD 1,109.2 million, net profit of USD 228.9 million and operating cash flow of USD 531.6 million. The net margin rose to 20.6% from 16.2% a year earlier, and net debt at the end of September turned negative at minus USD 237.0 million. The stock trades below its own history on EV/EBITDA (7.9 versus a three-year average of 8.8), but revenue growth slowed to 10.1% from 38.1% in the prior quarter, so the share looks rather attractive than outright cheap.
Key takeaways
— Revenue grew 10.1% year on year, but that is half the 38.1% pace of the prior quarter
— The margin rose to 20.6% from 16.2%, and profit grew 40.5%, faster than revenue
— Operating cash flow of USD 531.6 million covered capex of USD 221.6 million with room to spare
— Net debt turned negative at USD 237.0 million – leverage at minus 0.1 EBITDA
— A dividend yield of 0.35% barely affects the stock's total return
— EV/EBITDA of 7.9 is 10% below its own three-year average of 8.8
— The portal's model puts the share's upside to fair value at minus 2%
Attractiveness
Key figures, USD bn
| Metric | Q3 2025 | Q3 2026 | Change |
|---|---|---|---|
| Revenue | 1.01 | 1.11 | +10.1% |
| EBITDA | 0.52 | — | — |
| Operating profit | 0.35 | — | — |
| Net profit | 0.16 | 0.23 | +40.5% |
| Operating cash flow | 0.27 | 0.53 | +96.7% |
| EBITDA margin | 51.3% | — | — |
| Net margin | 16.2% | 20.6% | +4.4 pp |
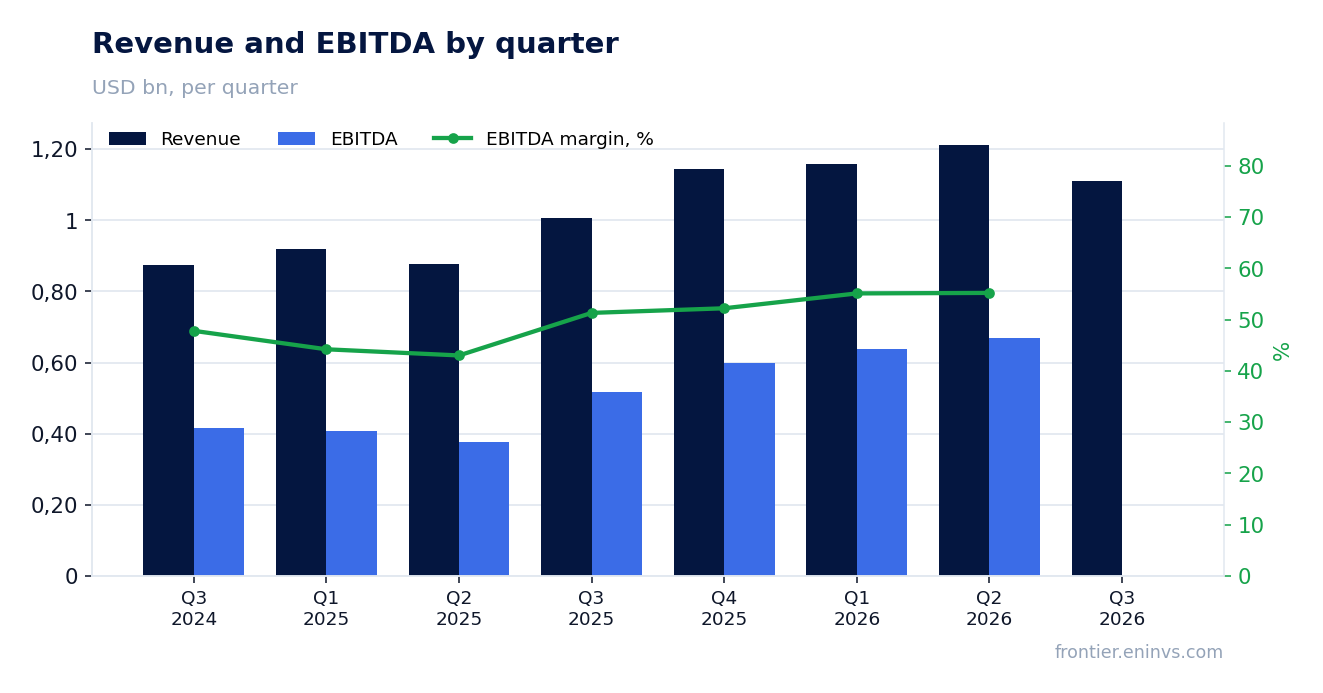
Revenue grew 10.1% year on year, but that is half the 38.1% pace of the prior quarter
In the third quarter of 2026, Lundin Mining's revenue was USD 1,109.2 million, up 10.1% year on year. A quarter earlier growth was 38.1%, so the pace slowed more than threefold. The slowdown is also visible against the prior quarter: revenue was USD 1,212.7 million in the second quarter and USD 1,109.2 million in the third.
Revenue is still growing year on year, but the support for that growth has shifted. The quarterly comparison shows a decline from the second-quarter level, while the year-on-year comparison shows a gain. This means the main support comes not from higher volumes but from a higher realised price than in the third quarter of 2025.
For further growth, what matters is not so much the comparison base as the ability to hold the price. If metal prices stay at the current level, year-on-year revenue will keep growing, but more slowly than in the first half. If prices retreat, quarterly dynamics could turn negative.
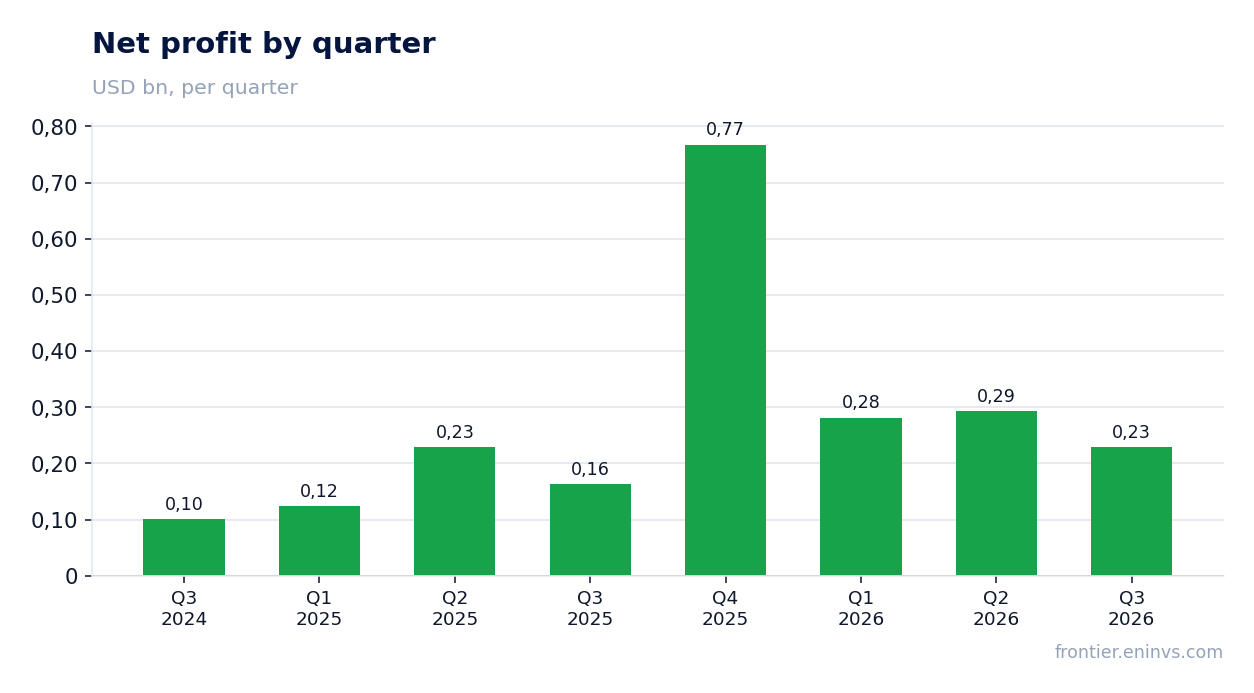
The margin rose to 20.6% from 16.2%, and profit grew 40.5%, faster than revenue
Net profit in the third quarter of 2026 was USD 228.9 million, up 40.5% year on year. Revenue over the same period grew 10.1%, so profit grew four times faster. The gap is explained by net margin expansion: it rose to 20.6% from 16.2% in the third quarter of 2025.
Margin growth on modest revenue growth means the bulk of the gain came not from additional revenue but from lower costs or a more favourable sales mix. With revenue of USD 1,109.2 million and a 20.6% margin, profit is USD 228.9 million – that is the level to hold in the next quarter.
Profit of USD 228.9 million is below the second quarter's USD 292.8 million but above the year-earlier USD 162.9 million. That pattern matches the revenue slowdown: quarterly profit is falling, while the year-on-year figure is rising. For an investor the annual pace matters, because it shows the company earns more than a year ago even on a weaker quarterly comparison.
Operating cash flow of USD 531.6 million covered capex of USD 221.6 million with room to spare
Operating cash flow in the third quarter of 2026 was USD 531.6 million. Capital expenditure over the same period was USD 221.6 million. The USD 310.0 million difference remained after investment and before dividends and debt service.
The flow grew markedly: it was USD 270.3 million a year earlier and USD 458.8 million in the second quarter of 2026. Flow growth alongside a sequential revenue decline means the company is collecting cash from sales better, not just selling more.
Capex rose to USD 221.6 million from USD 163.8 million a year earlier. That is the highest quarterly level in the past two years. If this level of investment persists, free cash flow will stay positive but its cushion will narrow.
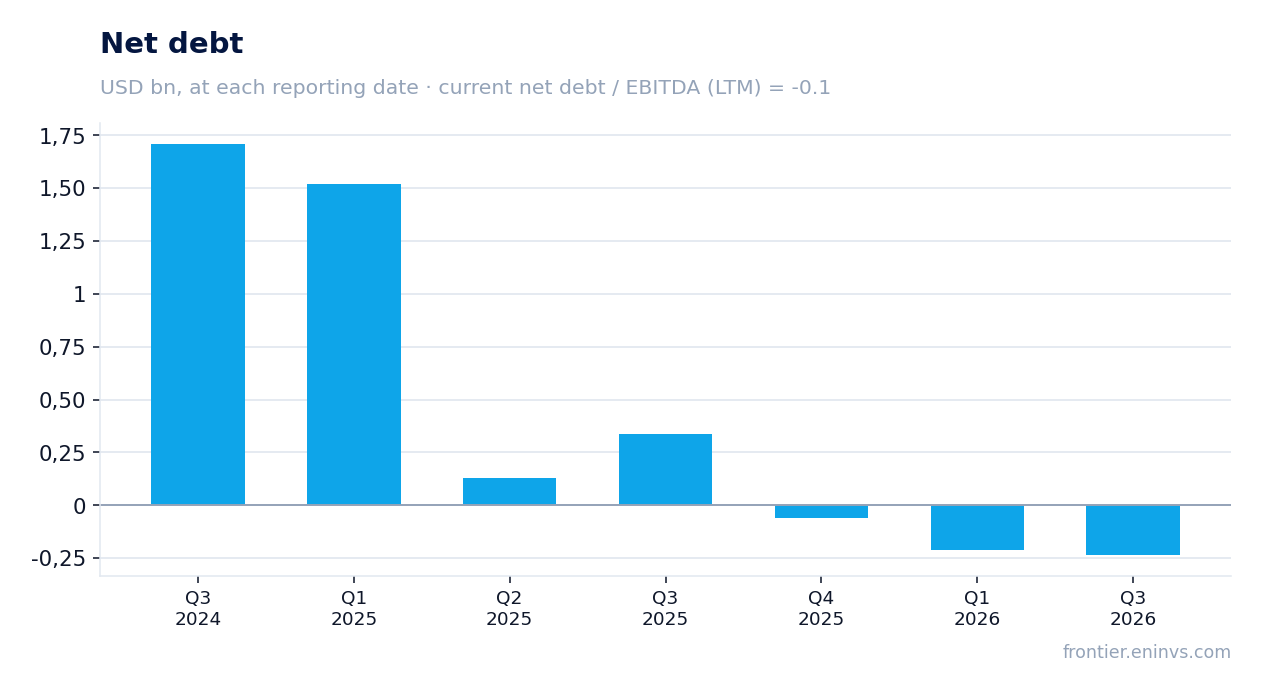
Net debt turned negative at USD 237.0 million – leverage at minus 0.1 EBITDA
As of 30 September 2026, Lundin Mining's net debt was minus USD 237.0 million, meaning cash exceeds debt. A year earlier, on 30 September 2025, net debt was USD 337.3 million. The change over the year is minus USD 0.6 billion.
The ratio of net debt to EBITDA over the last twelve months is minus 0.1. At this level debt creates no burden on profit. For comparison, EBITDA over the last twelve months was USD 2,444.0 million and net profit USD 1,570.4 million.
Negative net debt means the company can fund capex and dividends without borrowing. That lowers risk for a shareholder, but it also says free cash is not being directed into growth through acquisitions or new projects.
A dividend yield of 0.35% barely affects the stock's total return
Lundin Mining's dividend yield over the last twelve months is 0.35%. At a market capitalisation of USD 19,445.4 million, that corresponds to payouts of about USD 68.8 million. For comparison, net profit over the last twelve months was USD 1,570.4 million, so dividends take a small share of profit.
Our estimate for the current year's dividend assumes the current yield is maintained: at the share price implied by the market cap, the payout will stay within a 0.3–0.4% yield. This hinges on the payout ratio, which the company does not disclose in the facts, and on the profit base – if profit stays at the last-twelve-month level, the dividend will not grow significantly.
A yield of 0.35% is well below the key rate, so the dividend is not a reason to hold the stock. The investor's main return comes from share-price appreciation, not payouts. If profit falls, the dividend could be cut, but at the current payout level that is unlikely.
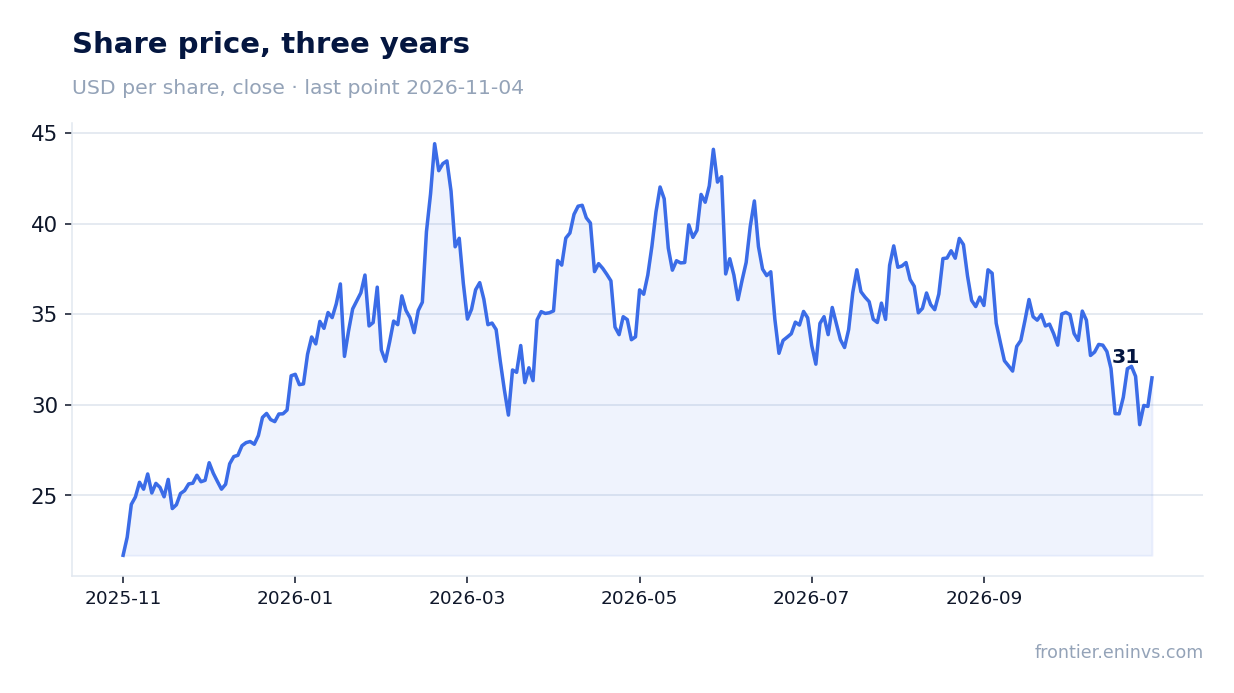
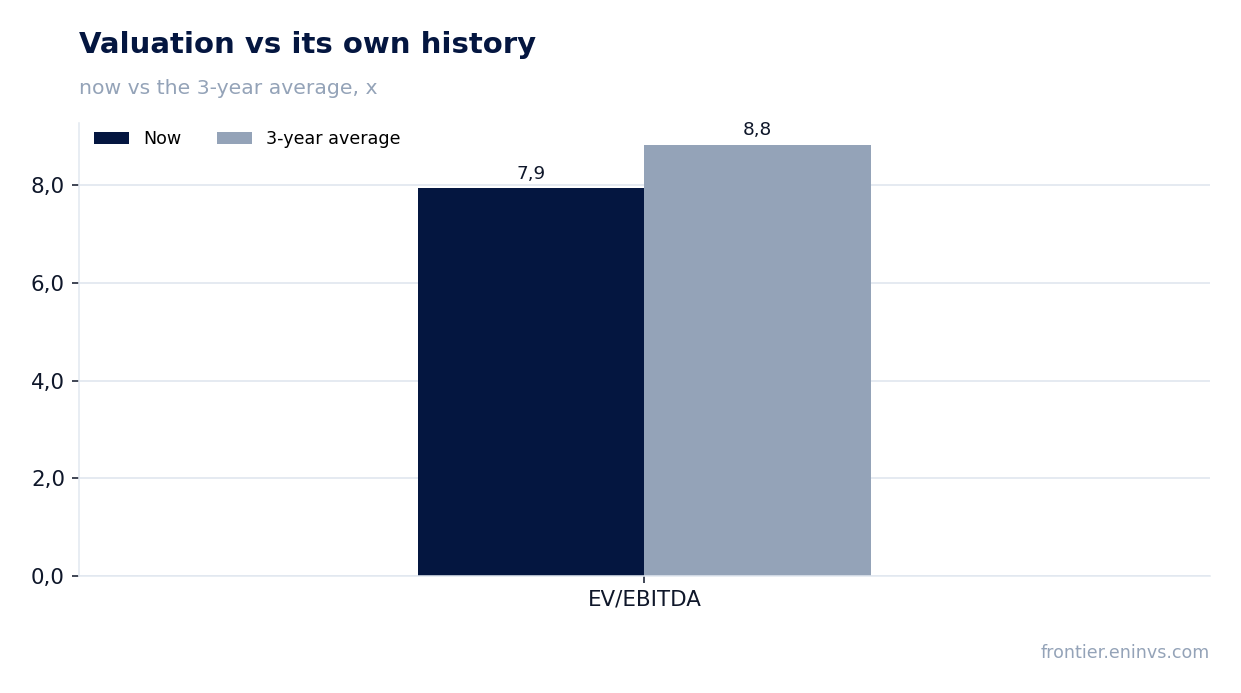
EV/EBITDA of 7.9 is 10% below its own three-year average of 8.8
The EV/EBITDA multiple over the last twelve months is 7.9. The three-year average is 8.8. The current value is 10% below the average, meaning the stock trades cheaper than usual over the past three years.
The P/E over the last twelve months is 12.4. With net profit of USD 1,570.4 million and a market cap of USD 19,445.4 million, this corresponds to a level at which the market values profit at 12.4 years' worth. For a company with negative net debt and a 16.9% ROE, that is not a high valuation.
The portal's model, which reprices EBITDA at current commodity prices at the target EV/EBITDA, puts the share's upside to fair value at minus 2%. This means that at current metal prices the stock is valued close to fair, and further gains require an improvement in market conditions.
The portal's model puts the share's upside to fair value at minus 2%
According to the portal's model, which reprices EBITDA at current commodity prices at the target EV/EBITDA, the fair value of the share is 2% below the current market price. This means the market has already priced in the current level of metal prices and the company's profitability.
The minus 2% estimate is not a target price and does not reflect market consensus. It is the result of our model, which shows that at current commodity prices the stock is fairly valued. Growth requires either higher metal prices, lower costs, or higher production volumes.
With an EV/EBITDA of 7.9 against a three-year average of 8.8, the stock has a discount to its own history, but the portal's model shows that this discount is already reflected in the price. Further movement depends on whether the current margin and cash flow hold.
Valuation on the latest reported figures
| Metric | Value |
|---|---|
| Market cap | 19.4 bn USD |
| P/E (LTM) | 12.4 |
| EV/EBITDA (LTM) | 7.9 |
| P/B | 2.94 |
| Net debt / EBITDA (LTM) | -0.10 |
| Operating cash flow (LTM) | 2.04 bn |
| ROE | 16.9% |
| Dividend yield (12m) | 0.4% |
| EV/EBITDA, 3-year average | 8.8 |
Bottom line
The report's strength was the margin: it rose to 20.6% from 16.2%, and profit grew 40.5%, faster than revenue. Operating cash flow of USD 531.6 million covered capex of USD 221.6 million with room to spare, and net debt turned negative at USD 237.0 million. The weak spot is the slowdown in revenue to 10.1% from 38.1% in the prior quarter: growth rests on metal prices, not volume. The stock trades below its own history on EV/EBITDA (7.9 versus 8.8), but the portal's model shows minus 2% to fair value, so the discount is already realised. The verdict is rather attractive: margin and cash flow are strong, but further growth requires better market conditions.
Open the company's financial profile LUN →
See also: market overview · valuation map · stock screeners