Matson: profit up 55.5% on the China trade, yet the stock fell after the release
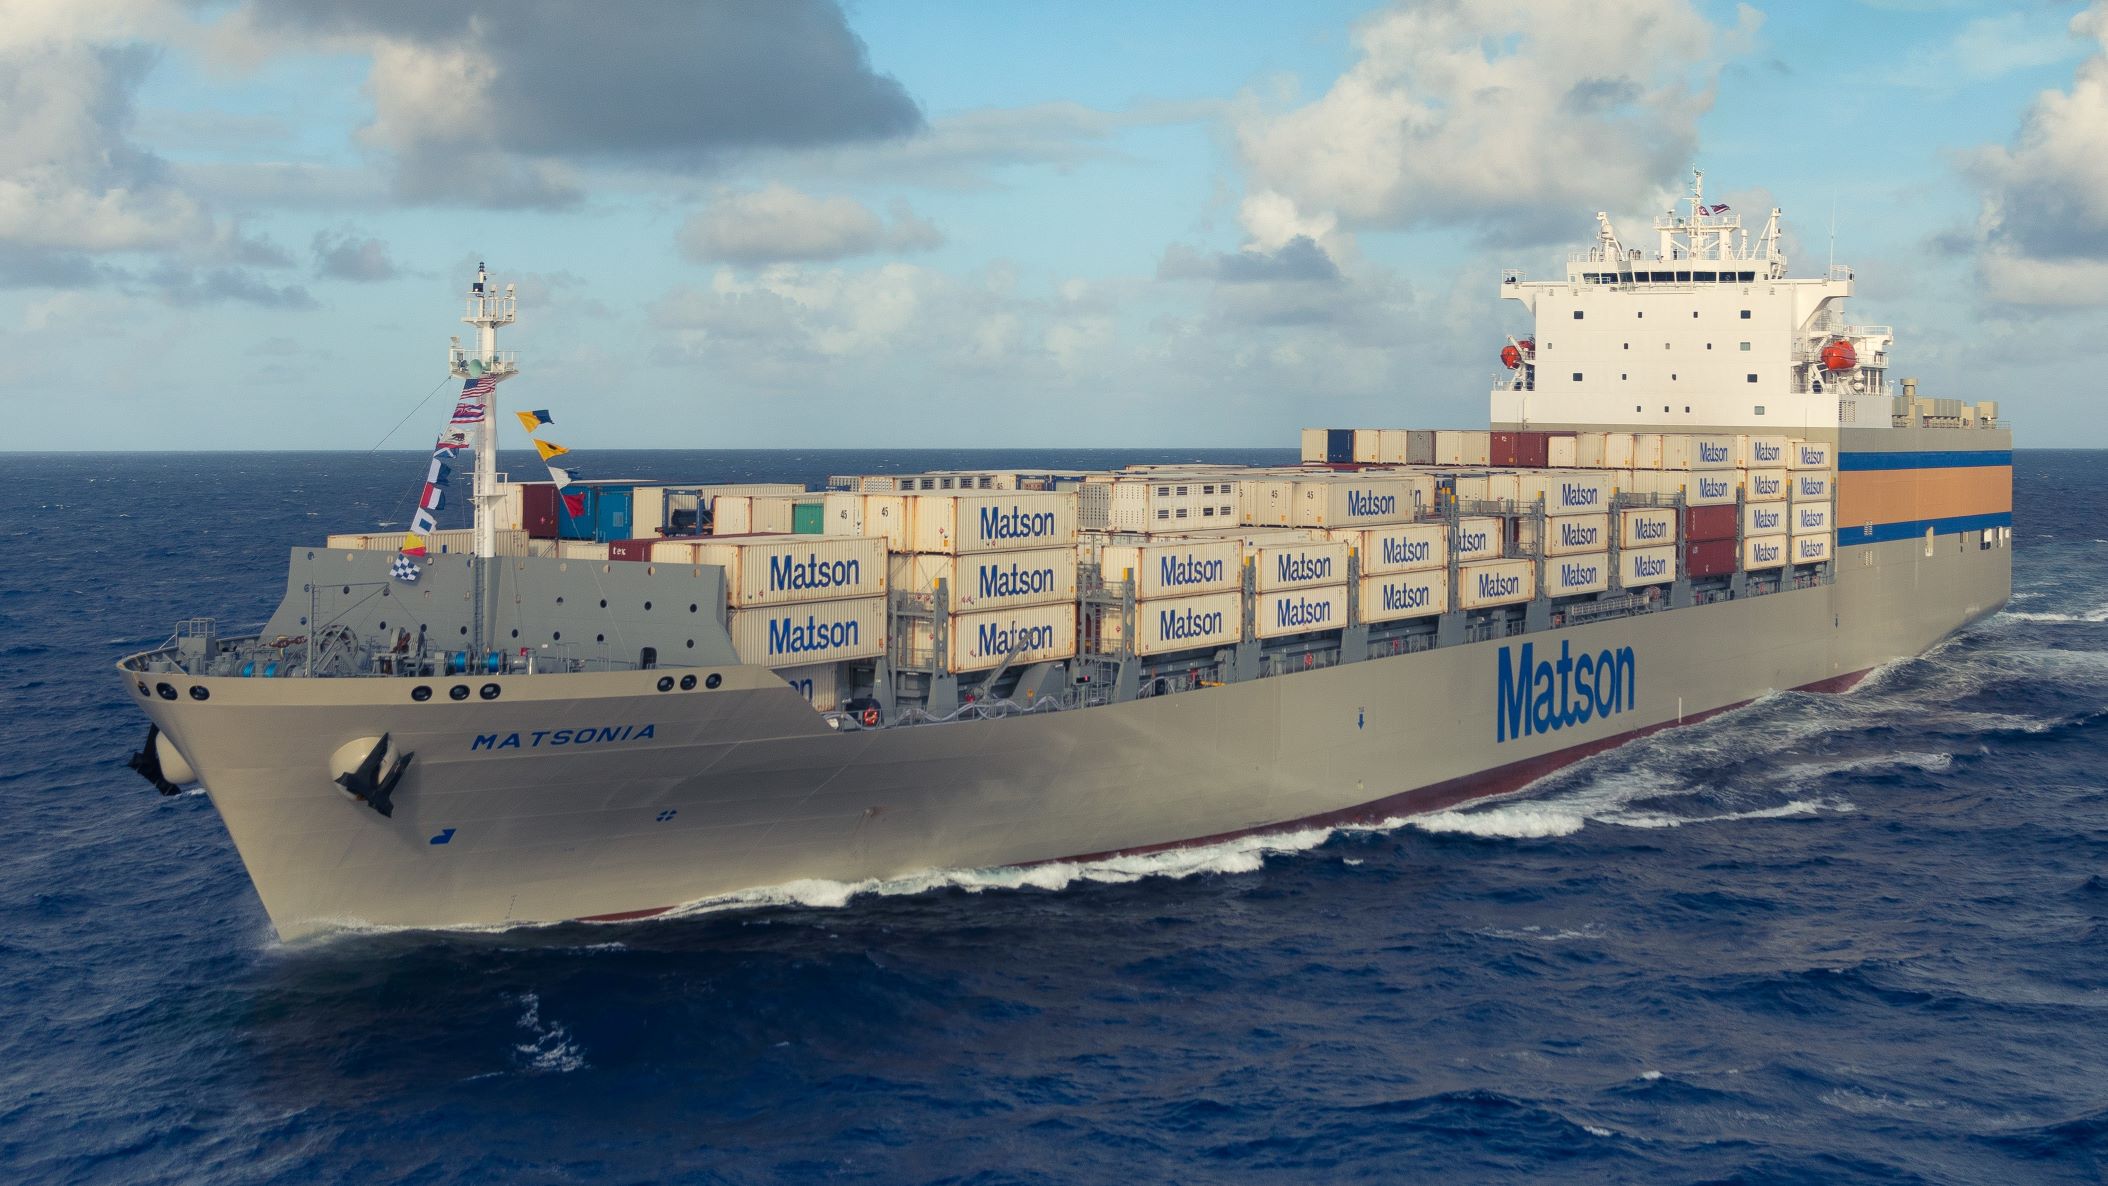
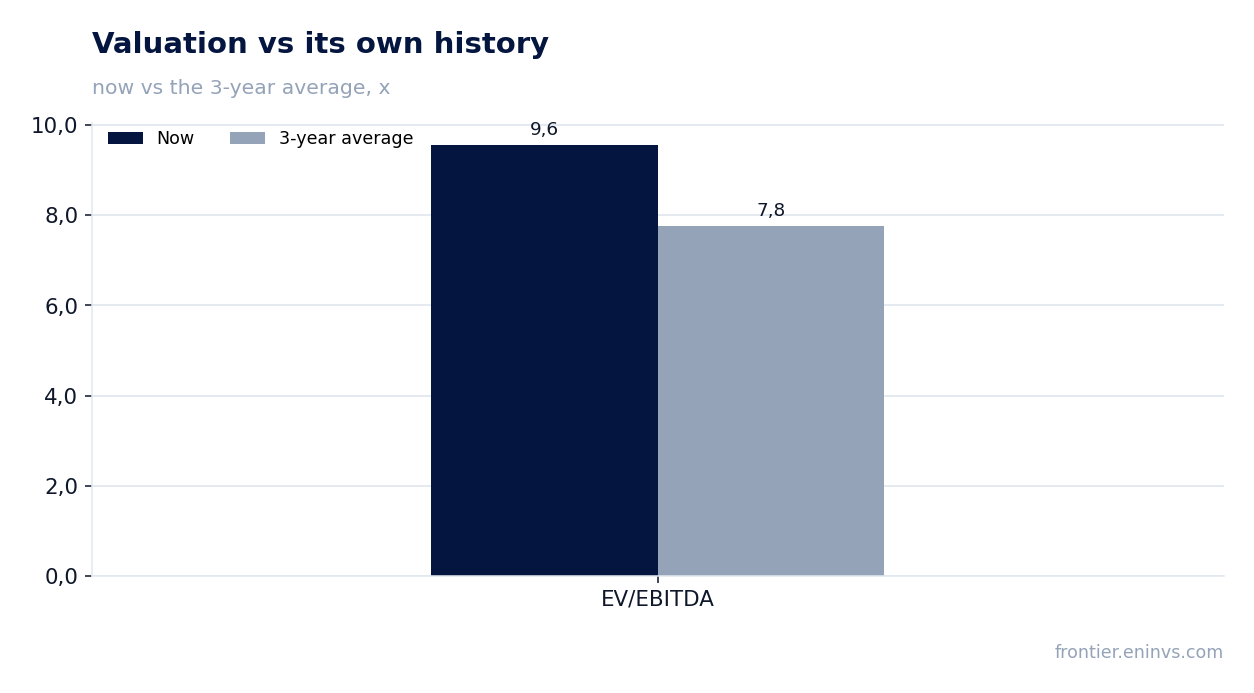
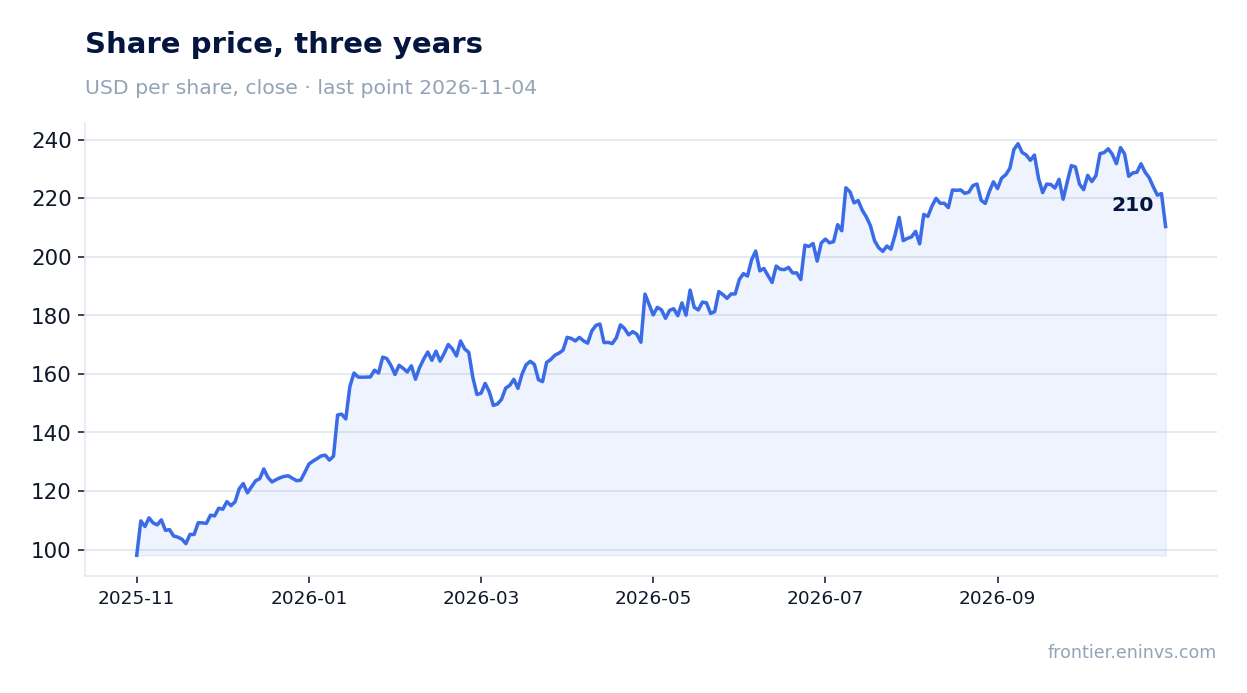
On 4 November Matson reported third-quarter 2026 results. Revenue came in at $1,113.5 million (+26.5% year on year), operating profit at $255.2 million, net profit at $209.4 million (+55.5%), and the net margin rose to 18.8% from 15.3%. Growth accelerated versus the second quarter (+16.7%), yet the market met the release with a 5.1% drop in the share on the day. With EV/EBITDA LTM at 9.6 against its own three-year average of 7.8, the stock is more expensive than its own history, so the verdict is neutral.
Key takeaways
— Revenue rose 26.5%, and almost all of the gain came from the China trade, where volume grew 16.0%
— Ocean Transportation operating profit rose 62.2% on segment revenue growth of 24.1%
— Net profit rose 55.5%, but a year earlier it was depressed by a one-off tax adjustment of $18.5 million
— Net debt fell from $0.7 billion on 30 September 2025 to $0.1 billion on 30 September 2026
— The company repurchased 0.3 million shares for $59.8 million and raised its fourth-quarter outlook
— The $0.38 per-share dividend yields about 0.7%, a token payout next to the buyback
— EV/EBITDA LTM of 9.6 is 23% above its own three-year average of 7.8, so the stock is dearer than its own history
Attractiveness
Key figures, USD bn
| Metric | Q3 2025 | Q3 2026 | Change |
|---|---|---|---|
| Revenue | 0.88 | 1.11 | +26.5% |
| EBITDA | 0.24 | — | — |
| Operating profit | 0.16 | 0.26 | +58.5% |
| Net profit | 0.13 | 0.21 | +55.5% |
| Operating cash flow | 0.18 | — | — |
| Capex | 0.08 | — | — |
| EBITDA margin | 27.8% | — | — |
| Net margin | 15.3% | 18.8% | +3.5 pp |
Revenue rose 26.5%, and almost all of the gain came from the China trade, where volume grew 16.0%
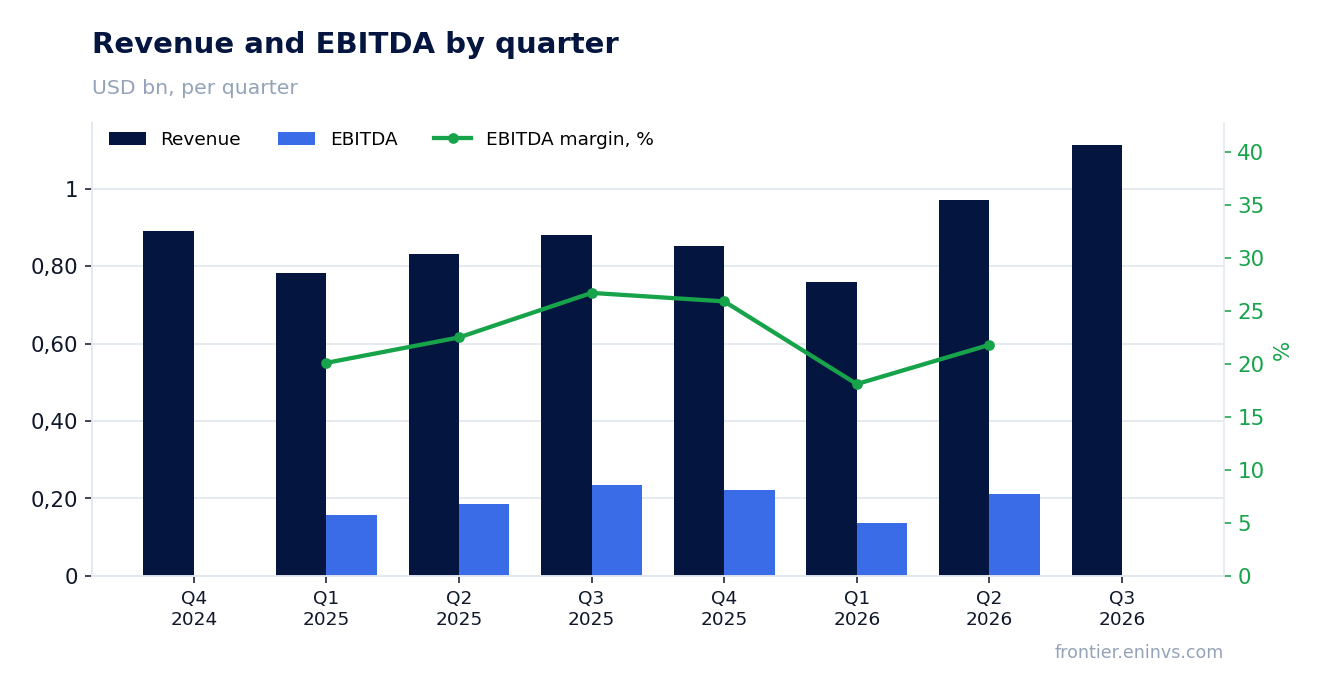
Third-quarter 2026 revenue was $1,113.5 million against $880.1 million a year earlier, up 26.5%. That is an acceleration from the second quarter, when revenue grew 16.7%. A quarter earlier revenue was $969.4 million, so it rose by $144.1 million in three months.
Almost all of the gain came from the ocean segment, whose revenue rose 24.1% to $891.3 million. The driver is the China trade, where container volume grew 16.0% year on year to 40,500 FEU and freight rates were elevated. The company names strong demand and high rates amid congestion at key Asian ports as the cause.
The other lanes moved little. Hawaii volume was down 0.3%, Alaska down 4.8%, other containers down 6.5%. Logistics revenue rose 37.3% to $222.2 million, mainly on transportation brokerage. Growth therefore rests on one trade lane rather than a broad base.
Ocean Transportation operating profit rose 62.2% on segment revenue growth of 24.1%
Ocean Transportation operating profit was $239.1 million against $147.4 million a year earlier, up 62.2%. Segment margin rose to 26.8% from 20.5%. Revenue grew 24.1% while operating costs rose only 14.2%, so each extra dollar of revenue delivered disproportionately more profit.
Consolidated operating profit was $255.2 million against $161.0 million, up 58.5%. Logistics added $16.1 million against $13.6 million, though its margin fell to 7.2% from 8.4% as brokerage revenue outgrew profit. The SSAT joint venture contributed $7.4 million against $9.3 million on lower lift volume.
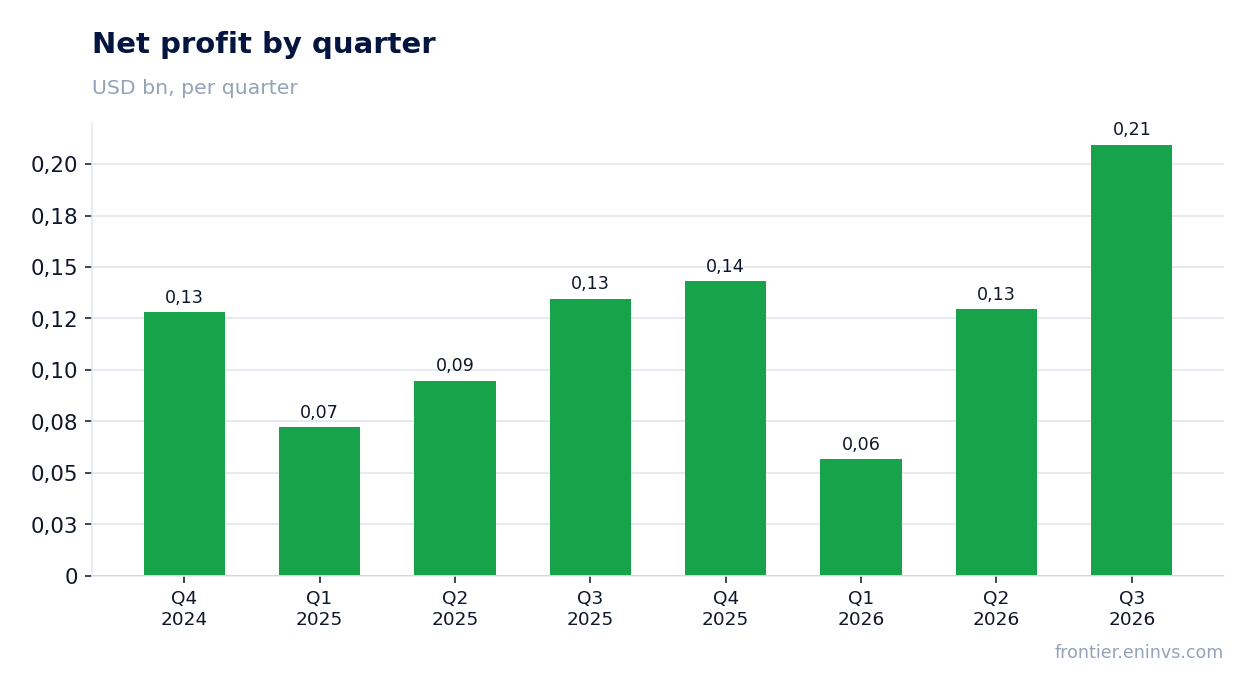
Net profit reached $209.4 million against $134.7 million, up 55.5%. The net margin rose to 18.8% from 15.3%. The comparison base matters: in the third quarter of 2025 the effective tax rate was 5.2% because of a one-off adjustment of $18.5 million, or $0.59 per share. Without it, profit growth would have been smaller.
Net profit rose 55.5%, but a year earlier it was depressed by a one-off tax adjustment of $18.5 million
The tax-rate gap explains a visible part of the profit gain. In the third quarter of 2026 the effective rate was 20.5%, and the company expects about 20.0% in the fourth quarter. A year earlier the rate was 5.2% because of a one-off deferred-tax adjustment of $18.5 million.
Adding that amount back to third-quarter 2025 profit raises the comparison base, and the profit growth rate then looks smaller than the stated 55.5%. This does not undo a strong quarter, but part of the effect is accounting rather than operating.
Operating profit, by contrast, rose 58.5% and contains no one-off items: its gain came from the China trade and fuel surcharges. Earnings per share were $6.96 against $4.24 a year earlier.
Net debt fell from $0.7 billion on 30 September 2025 to $0.1 billion on 30 September 2026
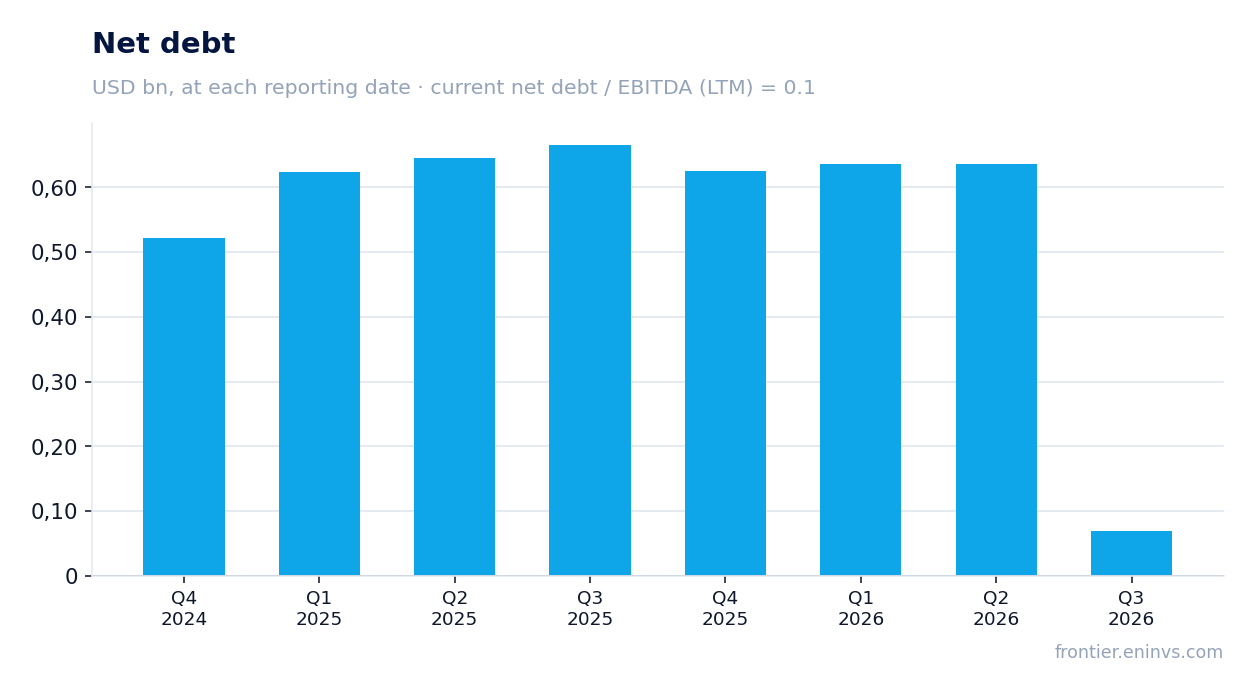
Net debt on 30 September 2026 was $0.1 billion against $0.7 billion on 30 September 2025, a reduction of $0.6 billion. Over the quarter it also fell from $0.6 billion on 30 June 2026 to $0.1 billion. Net debt to EBITDA LTM is 0.1, so debt barely affects the valuation.
Cash flow confirms it. Over the nine months of 2026 operating cash flow was $460.6 million against $370.2 million a year earlier. Total debt fell by $30.0 million to $331.2 million, of which $291.5 million is long-term. Interest expense is small at $1.6 million for the quarter.
The company channels free cash into buybacks and shipbuilding. It repurchased about 0.3 million shares for $59.8 million in the third quarter and $180.1 million over nine months. That is a weightier return channel than the dividend.
The company repurchased 0.3 million shares for $59.8 million and raised its fourth-quarter outlook
The outlook was raised. Matson expects fourth-quarter 2026 operating profit about 50% above the fourth quarter of 2025, when it was $143.7 million. The ocean segment should deliver about 50% more than $136.0 million, and logistics modestly above $7.7 million.
The basis is continued strong demand and high rates on the China trade through year end and into early 2027. The company expects full-year 2026 China volume above the 2025 level, while Hawaii and Alaska should be modestly lower.
Capex stays heavy. Over nine months of 2026 it was $349.8 million against $258.7 million a year earlier, including shipbuilding. For the full year the company plans about $130 million of maintenance capex, about $375 million on vessels and about $45 million on dry-docking. That caps free cash flow even with debt nearly eliminated.
The $0.38 per-share dividend yields about 0.7%, a token payout next to the buyback
On 20 October the board declared a quarterly dividend of $0.38 per share, payable on 3 December 2026. At the pre-release share price of $221.57 the trailing twelve-month yield is about 0.7%. That is a low yield both for the market and for the company itself.
The dividend is not the main return channel. Over nine months of 2026 dividends absorbed $33.4 million while buybacks took $180.1 million, more than five times as much. With LTM net profit of $538.5 million the payout is covered many times over, but the company prefers to put money into buybacks and vessels.
Our estimate: the dividend stays around $0.38 a quarter unless profit falls sharply. The risk to the payout is not debt, which is nearly eliminated, but a drop in China rates, on which most of the profit depends. A 0.7% yield on its own does not make the stock attractive.
EV/EBITDA LTM of 9.6 is 23% above its own three-year average of 7.8, so the stock is dearer than its own history
EV/EBITDA LTM is 9.6 against its own three-year average of 7.8, 23% above it. P/E LTM is 11.7 and return on equity is 18.8%. On its historical multiple the stock is dearer than usual, and that is the main argument against buying after a strong quarter.
Debt, however, is nearly eliminated: net debt to EBITDA LTM is 0.1. That supports the valuation but does not change the fact that the market has already priced in a strong year. The share fell 5.1% on the release day, and from the release to 4 November the decline held at the same level.
On the portal's model, which reprices EBITDA at current commodity prices at the target EV/EBITDA, the upside to fair value is +44%. That is our own estimate, not a market consensus. It rests on high profit persisting rather than on the current multiple.
Valuation on the latest reported figures
| Metric | Value |
|---|---|
| Market cap | 6.29 bn USD |
| P/E (LTM) | 11.7 |
| EV/EBITDA (LTM) | 9.6 |
| P/B | 2.28 |
| Net debt / EBITDA (LTM) | 0.10 |
| ROE | 18.8% |
| Dividend yield (12m) | 0.7% |
| EV/EBITDA, 3-year average | 7.8 |
Bottom line
The quarter was genuinely strong: revenue rose 26.5%, operating profit 58.5%, the net margin climbed to 18.8%, and net debt fell to $0.1 billion. But part of the profit gain comes from a low tax base a year earlier, and growth rests on one China trade lane. The $0.38 dividend yields only 0.7%, with most of the return coming through buybacks. At EV/EBITDA of 9.6 against its own three-year average of 7.8 the stock is dearer than its own history, so the verdict is neutral. The verdict would improve if high China rates persist longer than the outlook assumes, and would weaken if they normalise.
Open the company's financial profile MATX →
See also: market overview · valuation map · stock screeners