Mexco Energy: profit doubled, but it came from the oil price, not from production
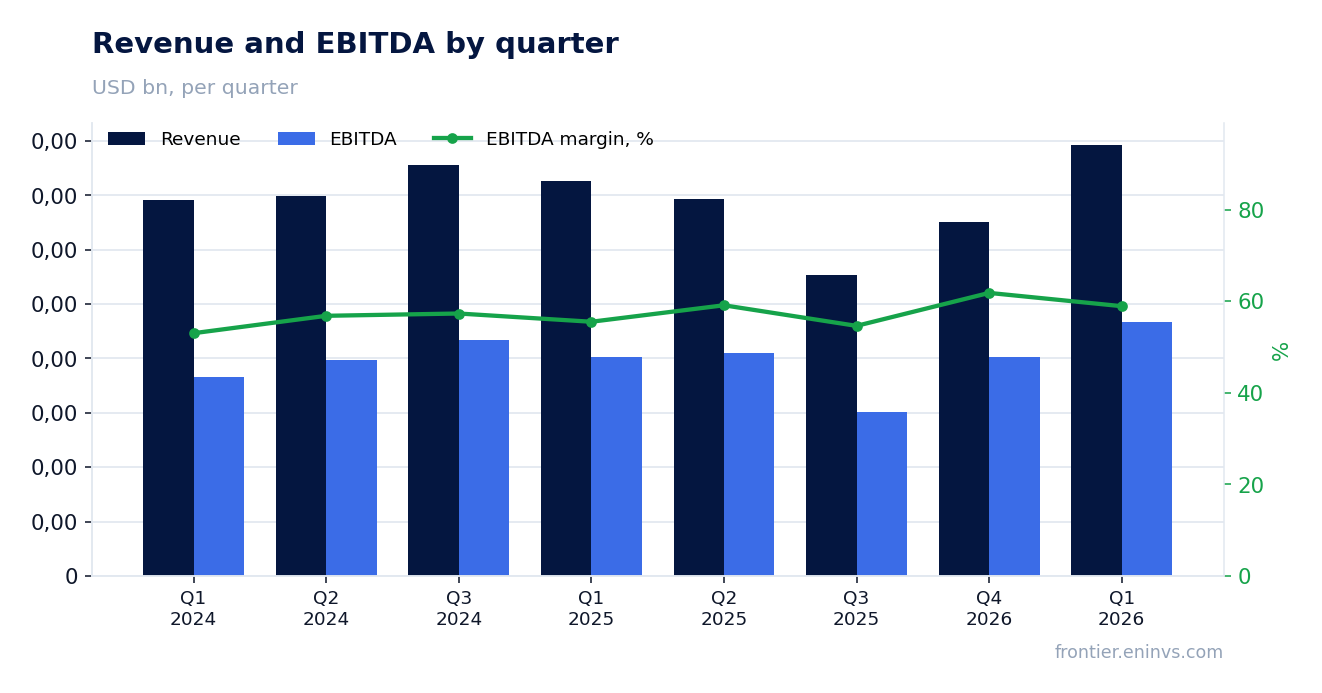
On 12 August Mexco Energy reported results for the first quarter of fiscal 2027 (quarter ended 30 June 2026). Revenue rose 9.3% year on year to $1.98 million, EBITDA – by 15.9% to $1.17 million, net profit – by 107.1% to $0.50 million. Doubling profit on modest revenue growth looks strong, but it rests on a one-off 52% jump in the average oil price, while oil production fell 15% and gas production fell 9%. At EV/EBITDA of 5.3 and P/E of 14.3 the stock is not expensive, but the sustainability of earnings is questionable – verdict neutral.
Key takeaways
— Revenue rose 9.3%, but it was driven by the oil price, not by production
— Profit doubled thanks to a one-off 52% jump in the oil price
— EBITDA margin rose to 58.9% amid falling production
— Free cash flow turned negative due to $2.1 million of royalty acquisitions
— Leverage is negative: the company sits on a cash cushion
— Valuation is cheap: EV/EBITDA 5.3 and P/E 14.3 with ROE around 10%
Attractiveness
Key figures, USD bn
| Metric | Q1 2025 | Q1 2026 | Change |
|---|---|---|---|
| Revenue | 0.00 | 0.00 | +9.3% |
| EBITDA | 0.00 | 0.00 | +15.9% |
| Operating profit | 0.00 | 0.00 | +70.9% |
| Net profit | 0.00 | 0.00 | +107.1% |
| Operating cash flow | 0.00 | 0.00 | +10.0% |
| Capex | 0.00 | 0.00 | +625.2% |
| EBITDA margin | 55.5% | 58.9% | +3.4 pp |
| Net margin | 13.3% | 25.3% | +12.0 pp |
Revenue rose 9.3%, but it was driven by the oil price, not by production
Revenue in the first quarter of fiscal 2027 was $1.98 million, up 9.3% year on year. The growth looks modest, but it hides divergent dynamics: the average oil price rose 52%, while oil production fell 15%, gas production fell 9%, and the average gas price fell 49%.
In other words, the company sold fewer hydrocarbons but at a significantly higher price. Such revenue growth is not organic – it depends entirely on commodity market conditions. If the oil price retreats, revenue could quickly return to previous levels or fall below.
The decline in production is a warning signal. It may be due to natural well depletion or to a pause in drilling. The company plans to participate in drilling 53 horizontal wells and completing 20 wells in the current fiscal year at an estimated total cost of about $1.8 million, of which $620,000 has already been spent. This should support production, but the effect will not be immediate.
Profit doubled thanks to a one-off 52% jump in the oil price
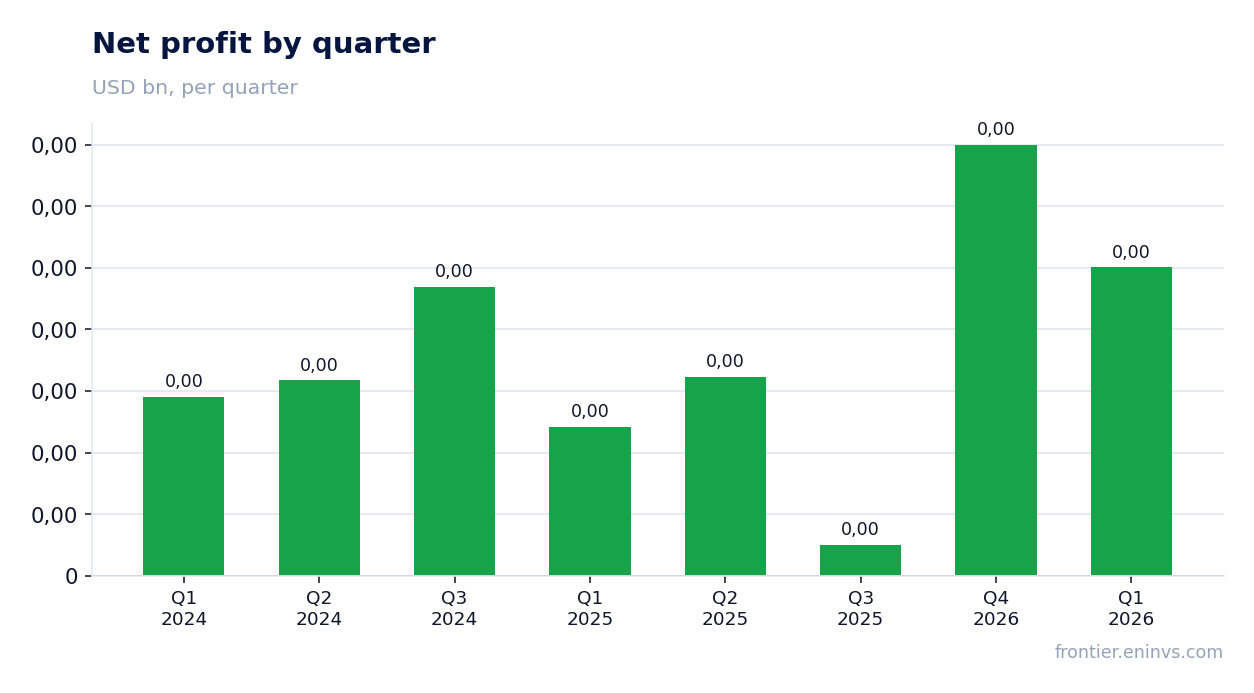
Net profit in the first quarter of fiscal 2027 was $0.50 million, up 107.1% year on year. Such growth looks impressive, but it is almost entirely explained by a 52% increase in the average realised oil price.
Operating profit rose to $0.57 million from $0.33 million a year earlier. At the same time, revenue added only 9.3% and EBITDA – 15.9%. Such strong net profit growth on modest revenue growth suggests that a significant part of the increase came from non-operating factors or from operating leverage on higher prices.
It is important to understand that the 52% oil price increase is a one-off factor that could be followed by an equally sharp decline. The sustainability of profit at this level is questionable, especially against the backdrop of falling production.
EBITDA margin rose to 58.9% amid falling production
EBITDA margin in the first quarter of fiscal 2027 was 58.9% versus 55.5% a year earlier. The 3.4 percentage point increase is explained by revenue growing faster than costs – with falling production, many expenses declined.
However, margin growth does not necessarily mean improved efficiency. With lower production, some costs (e.g., electricity, repairs, transportation) fall proportionally, mechanically improving profitability. If production continues to decline, the effect may disappear.
Net margin rose to 25.3% from 13.3% a year earlier. This is a very high level for an oil and gas company, but it was achieved mainly through the price factor, not through sustainable business growth.
Free cash flow turned negative due to $2.1 million of royalty acquisitions
Operating cash flow in the first quarter of fiscal 2027 was $1.5 million, higher than a year earlier ($1.36 million). However, capital expenditure rose to $2.7 million versus $0.37 million a year earlier. As a result, free cash flow turned negative.
The increase in capex is linked to investments in oil and gas royalty acquisitions worth about $2.1 million, as stated by company president Tammy McComic. These investments were funded from existing cash resources, not from debt.
Royalty acquisitions are part of the company's strategy to expand its portfolio with development potential. However, such investments are one-off in nature and may not repeat next quarter. It is important to monitor whether these acquisitions yield returns in the form of increased production and revenue.
Leverage is negative: the company sits on a cash cushion
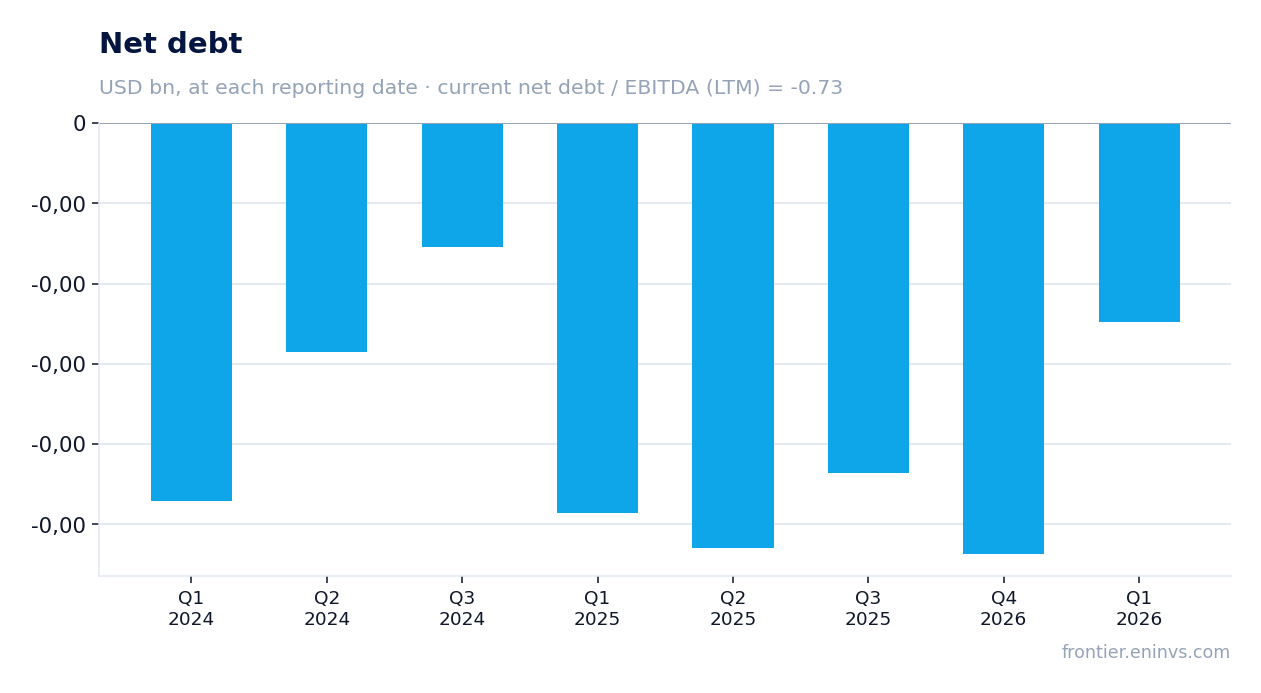
Net debt at the latest reporting date was -$2.69 million, meaning cash exceeds debt obligations. This gives the company financial stability and the ability to fund acquisitions without borrowing.
The net debt to EBITDA ratio for the trailing twelve months is -0.73. The negative value confirms that the company has no debt burden and instead has a net cash position.
Unlike many companies in the industry, Mexco Energy does not depend on creditors and can weather periods of low prices without default risk. This is an important advantage, especially amid commodity market volatility.
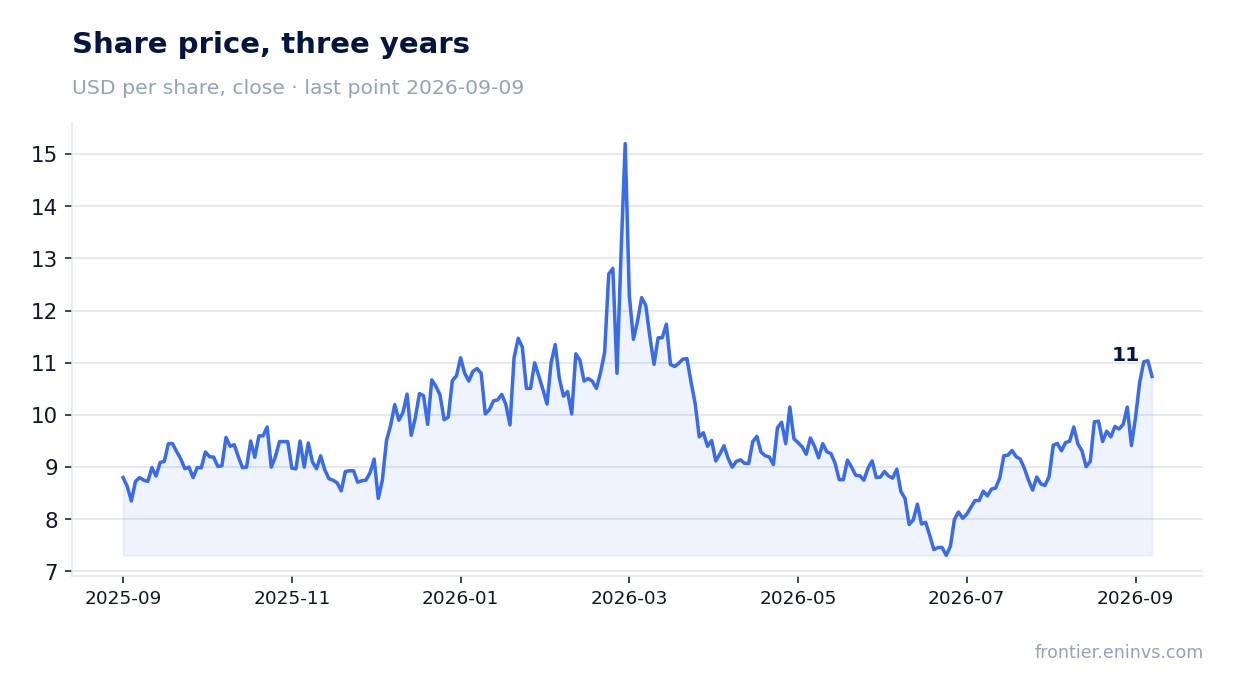
Valuation is cheap: EV/EBITDA 5.3 and P/E 14.3 with ROE around 10%
The EV/EBITDA multiple for the trailing twelve months is 5.3, P/E – 14.3. For an oil and gas company with negative net debt and high margin, these are not high values.
Return on equity (ROE) for the trailing twelve months is 9.9%. This is a moderate figure, reflecting a low capital base and the impact of the price factor on profit.
The company's market capitalisation is $22.3 million. With such a small capitalisation, the shares can be volatile and liquidity limited. Nevertheless, the current valuation does not look inflated, especially if oil prices remain at current levels.
Valuation on the latest reported figures
| Metric | Value |
|---|---|
| Market cap | 0.02 bn USD |
| P/E (LTM) | 14.3 |
| EV/EBITDA (LTM) | 5.3 |
| P/B | 1.12 |
| Net debt / EBITDA (LTM) | -0.73 |
| Operating cash flow (LTM) | 0.01 bn |
| ROE | 9.9% |
Bottom line
The report's strengths are the doubling of net profit and EBITDA margin rising to 58.9%, as well as the absence of debt burden (negative net debt). However, this result is largely one-off: it rests on a 52% jump in the oil price, while production is falling. Free cash flow turned negative due to large royalty acquisitions, and it is not yet clear whether they will pay off. Valuation is cheap (EV/EBITDA 5.3, P/E 14.3), but the sustainability of earnings is questionable. Verdict neutral: the stock does not look overvalued, but there are no obvious drivers for growth.
Open the company's financial profile MXC →
See also: market overview · valuation map · stock screeners