NACCO Industries: net profit fell 17.7% even as operating profit rose 37% – tax took the difference

On 4 November NACCO Industries reported third-quarter 2026 results. Revenue came in at $80.5 million (+5.1% year on year), EBITDA at $15.6 million (+20.2%) and net profit at $10.9 million, down 17.7% from $13.3 million a year earlier. Operating profit, by contrast, rose 37% to $9.3 million and pre-tax profit more than doubled to $12.5 million: the gap to net profit was created by a sharp increase in income tax. At an EV/EBITDA of 7.6, exactly in line with its own three-year average, and a dividend yield of 3.0%, the share is fairly valued, but the portal model points to no upside – a neutral verdict.
Key takeaways
— Revenue rose 5.1%, but growth decelerated from 6.0% a quarter earlier
— Operating profit added 37% on contract mining and the utility coal segment
— Net profit fell 17.7% because of tax, not operations
— One-offs added $4.5 million to pre-tax profit from a pension settlement
— Leverage of 1.32x EBITDA on net debt of $55.8 million is moderate
— Dividend yield of 3.0% on payouts the company intends to maintain
— EV/EBITDA of 7.6 is exactly at the three-year average, and the portal model offers no upside
Attractiveness
Key figures, USD bn
| Metric | Q3 2025 | Q3 2026 | Change |
|---|---|---|---|
| Revenue | 0.08 | 0.08 | +5.1% |
| EBITDA | 0.01 | 0.02 | +20.2% |
| Operating profit | 0.01 | 0.01 | +36.6% |
| Net profit | 0.01 | 0.01 | -17.7% |
| Operating cash flow | 0.04 | 0.01 | -79.9% |
| Capex | 0.02 | — | — |
| EBITDA margin | 16.9% | 19.4% | +2.5 pp |
| Net margin | 17.3% | 13.6% | -3.7 pp |
Revenue rose 5.1%, but growth decelerated from 6.0% a quarter earlier
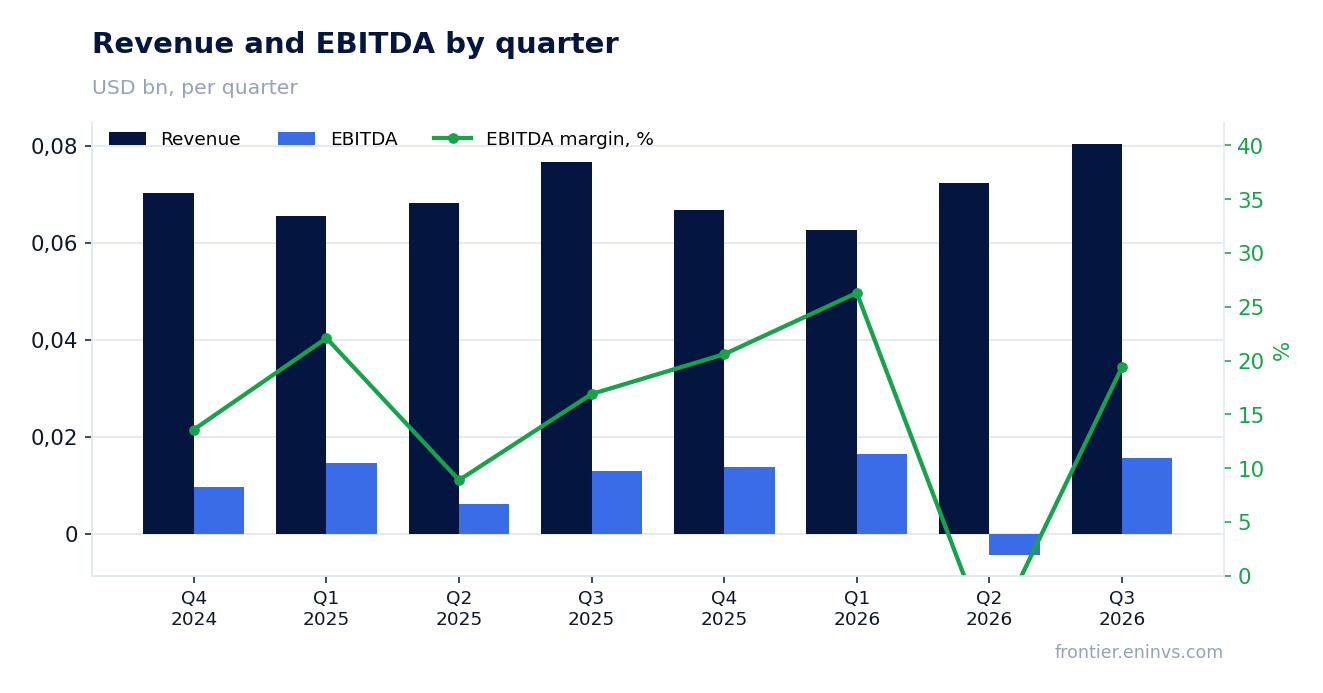
Third-quarter 2026 revenue came in at $80.5 million, up 5.1% from a year earlier. That is a deceleration from the second quarter, when growth was 6.0%. The sequential gain over the $72.3 million of the second quarter is 11%, but the year-on-year dynamic matters more: it shows the pace of expansion is slowing.
The main contribution to growth came from contract mining: its revenue reached $48.3 million against $45.6 million a year earlier. Excluding reimbursable costs it rose 75% to $22.2 million – the effect of the new dragline services contract in Palm Beach County, Florida. The utility coal segment added $20.8 million against $19.7 million, while Minerals and Royalties cut revenue to $6.1 million from $9.3 million on lower natural gas production and pricing.
The slowdown in overall growth is explained not by weakness in contract mining but by the fall in royalties. If contract mining keeps ramping and the new Arizona limestone quarry, started in early October, begins to contribute revenue, the annual rate could recover. For now the 5.1% figure is a fact, not a trend toward acceleration.
Operating profit added 37% on contract mining and the utility coal segment
Operating profit came in at $9.3 million against $6.8 million a year earlier, up 37%. Gross profit rose 18% to $11.8 million on revenue of $80.5 million. Operating profit outgrew revenue because the sales mix improved: higher-margin contract mining gained share while royalties declined.
The contract mining segment delivered operating profit of $4.9 million against $1.9 million a year earlier – a 2.5-fold increase. The utility coal segment added $6.6 million against $5.0 million on improved contractual pricing and lower inventory impairment charges at Mississippi Lignite Mining Company. Minerals and Royalties held profit almost flat at $7.7 million against $8.0 million, as higher equity earnings offset lower royalties.
Unallocated costs rose to $10.0 million from $8.1 million, including $3.4 million of solar curtailment costs. Without these costs operating profit would have been higher still. Solar remains the main source of uncertainty: the company continues to evaluate project sales or contract amendments and warns of possible additional costs in the fourth quarter.
Net profit fell 17.7% because of tax, not operations
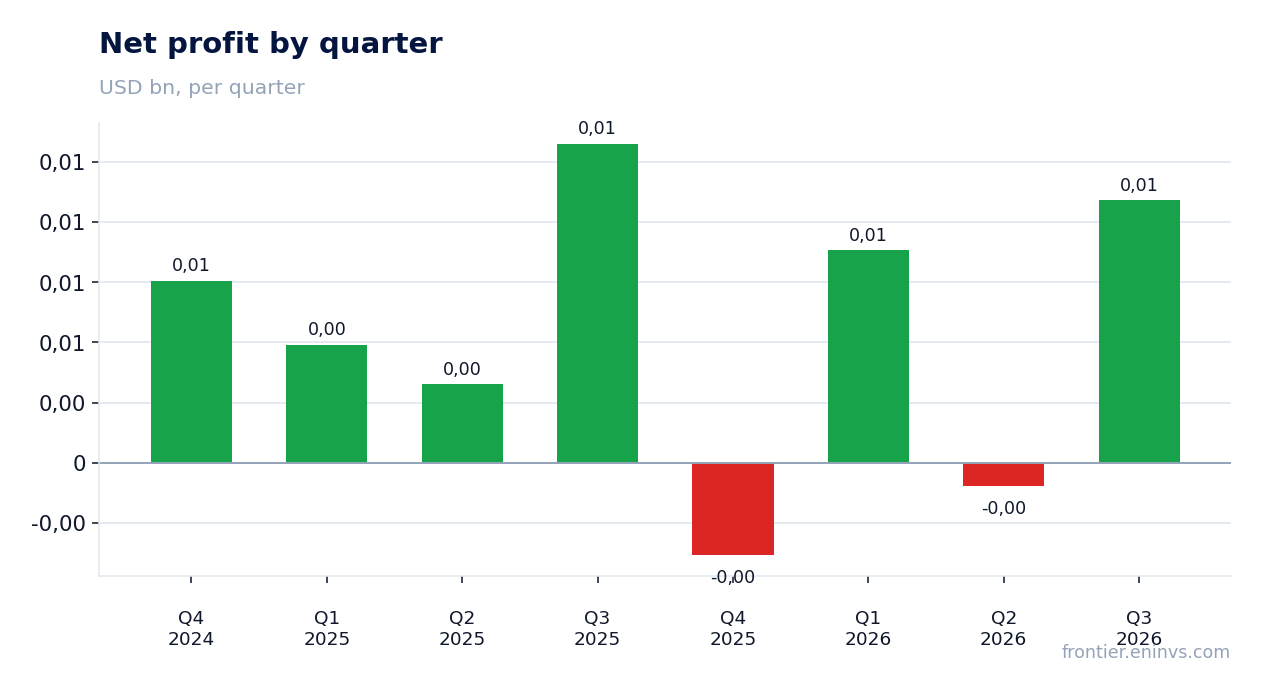
Net profit came in at $10.9 million against $13.3 million a year earlier, down 17.7%. Pre-tax profit, by contrast, more than doubled to $12.5 million from $6.0 million. The gap is tax: in the third quarter of 2026 the company recorded an income tax expense of $1.6 million, whereas a year earlier it booked a tax benefit of $7.3 million. That prior-year benefit inflated the comparison base.
Net margin fell to 13.6% from 17.3% a year earlier, but that is a consequence of the tax effect, not of weaker operations. EBITDA margin, on the other hand, rose to 19.4% from 16.9% – the operating business became more profitable. The gap between the two margins is the best illustration of what happened in the report.
For a holder the important point is that operating dynamics are positive and the fall in net profit is one-off in nature. However, the prior-year tax base was abnormally low, and a return to a normal tax level means net profit will grow more slowly than operating profit going forward.
One-offs added $4.5 million to pre-tax profit from a pension settlement
Within other income the company recorded $4.5 million of gain from the settlement of an excess pension funding liability. That amount went into the $12.5 million pre-tax profit and materially inflated it. Without this one-off gain pre-tax profit would have been about $8.0 million – still above the prior-year $6.0 million, but with more modest growth.
The report also mentions $12.0 million of solar asset impairment charges in the second quarter of 2026 and $3.4 million of solar curtailment costs in the third quarter. In total solar-related items reached roughly $15 million over nine months. The company expects full-year operating profit to be comparable to the prior year precisely because of these costs.
One-offs cut both ways: the pension gain inflates the third-quarter base, while solar write-downs depress the second-quarter and full-year base. For assessing sustainable profit the more relevant measure is Adjusted EBITDA, which the company calculates excluding these items – $20.4 million for the quarter, up 63% year on year.
Leverage of 1.32x EBITDA on net debt of $55.8 million is moderate
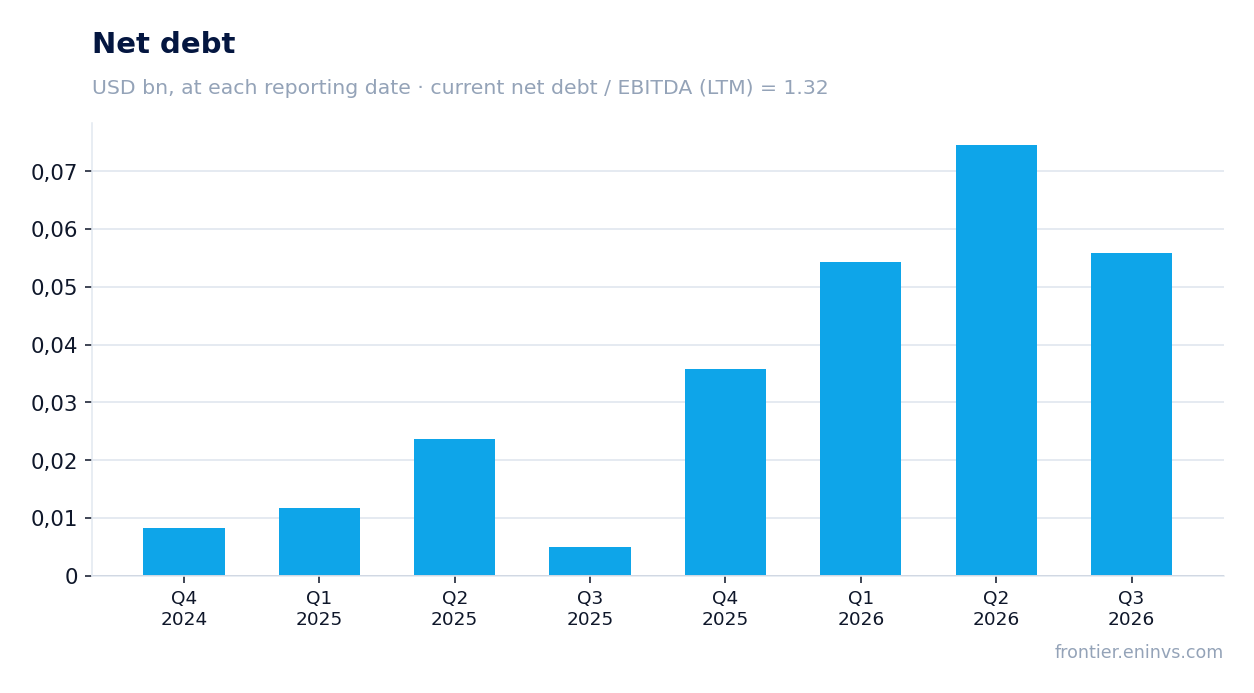
Net debt at 30 September 2026 was $55.8 million, or 1.32x EBITDA over the last twelve months. That is a moderate level for a company with revenue of $282.4 million over the same period. Total debt is $124.8 million, cash $56.5 million, revolver availability $58.7 million, total liquidity $115.2 million.
Net debt dynamics: from $0.1 billion at 30 June 2026 to $0.1 billion at 30 September 2026, a negligible change. Over the year, from 30 September 2025, net debt rose from $0.0 billion to $0.1 billion. The increase reflects the investment programme: the company is putting money into new contracts and projects, including Sawtooth Mining for Thacker Pass.
Operating cash flow was $8.5 million in the third quarter and $40.6 million over the last twelve months. That is enough to service debt: interest expense for the quarter was $2.2 million. The company says it intends to reduce debt over time while preserving flexibility for investment. At the current leverage the refinancing risk is low.
Dividend yield of 3.0% on payouts the company intends to maintain
Dividend yield over the last twelve months is 3.0%. The company pays dividends and states its commitment to returning value to shareholders alongside investment in growth. With net profit of $14.9 million over the last twelve months and a market capitalisation of $256.8 million, payouts look sustainable, although the payout ratio is not disclosed.
Our estimate for the current year's dividend is maintenance of payouts at a level providing a yield of about 3.0% on the current price. That depends on profit remaining sufficient after the tax increase and solar write-downs. The company expects net profit to grow for the full year, which supports payouts.
A yield of 3.0% is below the key rate, but for a company with moderate leverage and a growing operating business that is an acceptable level. A cut is possible if solar projects require additional costs or the tax burden proves higher than expected. For now the dividend is one of the factors supporting the valuation.
EV/EBITDA of 7.6 is exactly at the three-year average, and the portal model offers no upside
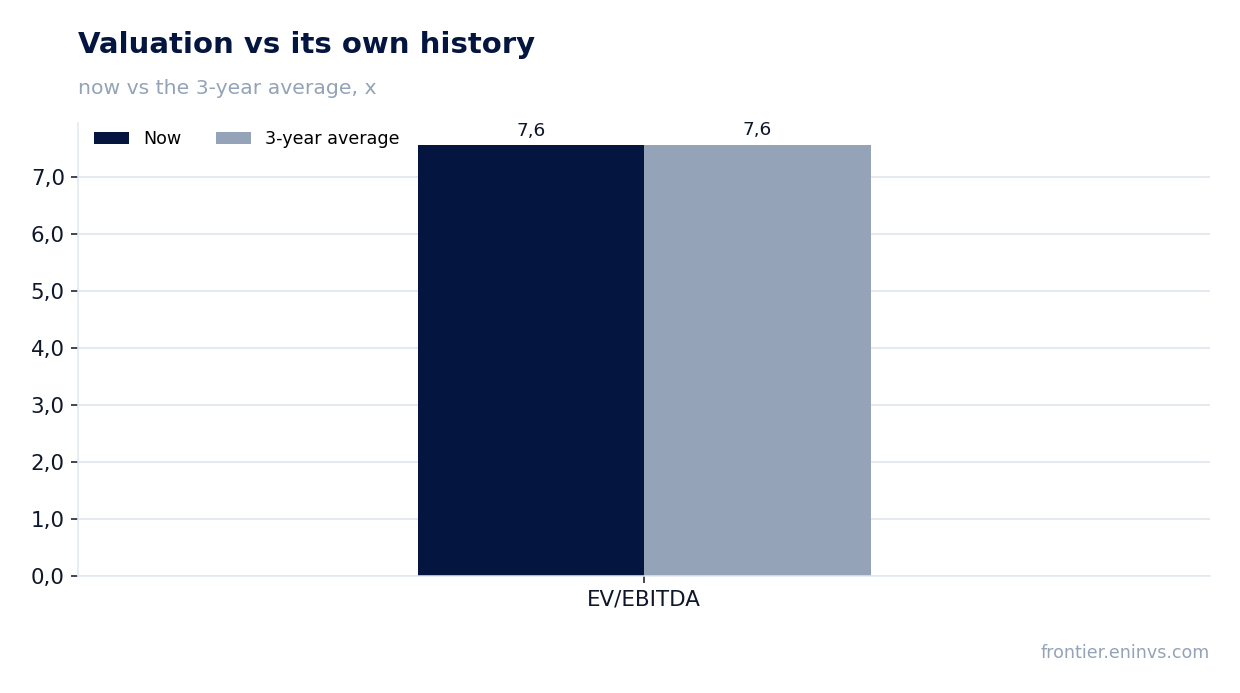
The EV/EBITDA multiple over the last twelve months is 7.6, exactly matching its own three-year average of 7.6. The share is valued as it has been on average over the past three years, with neither premium nor discount. P/E over the last twelve months is 17.2, which against a return on equity of 9.9% looks neutral.
The portal model, which re-prices EBITDA at current commodity prices at the target EV/EBITDA, puts the upside to fair value at minus 90%. The value sits on the model's clamp, so it is a bound, not an estimate. In other words, at current commodity prices and the current multiple there is no upside.
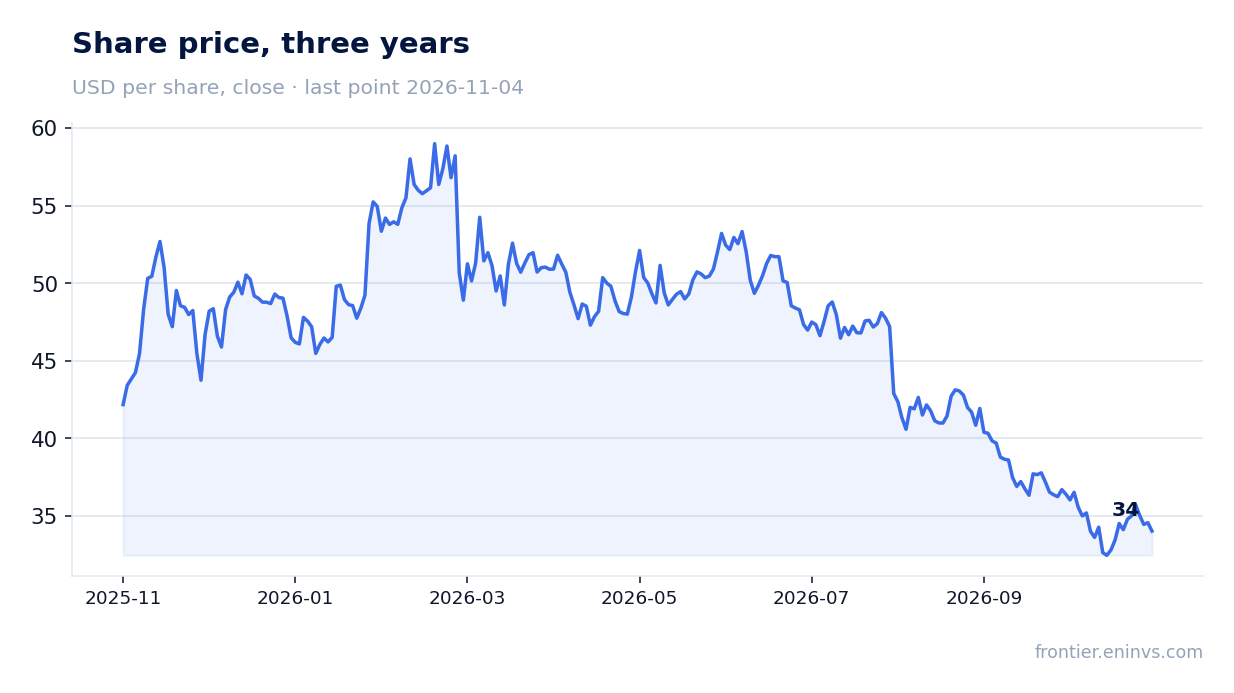
The market reaction to the report was muted: the share lost 1.6% on the publication day and is down the same 1.6% from then to 4 November. Investors saw no reason to re-rate the stock. For the share to rise it needs either a stronger operating result, lower one-off costs or higher commodity prices.
Valuation on the latest reported figures
| Metric | Value |
|---|---|
| Market cap | 0.26 bn USD |
| P/E (LTM) | 17.2 |
| EV/EBITDA (LTM) | 7.6 |
| P/B | 0.60 |
| Net debt / EBITDA (LTM) | 1.32 |
| Operating cash flow (LTM) | 0.04 bn |
| ROE | 9.9% |
| Dividend yield (12m) | 3.0% |
| EV/EBITDA, 3-year average | 7.6 |
Bottom line
The strong side of the report was operating dynamics: profit rose 37%, EBITDA 20.2%, and EBITDA margin climbed to 19.4%. The weak side was net profit, down 17.7% on tax, and one-offs: $4.5 million of pension gain inflated the base while $3.4 million of solar costs depressed it. Leverage is moderate at 1.32x EBITDA, and the dividend yield is 3.0%. The key question for a holder is whether the company can sustain operating growth and cut one-off costs so that net profit follows operating profit. With the multiple exactly at its own history and no upside on the portal model, the verdict is neutral.
Open the company's financial profile NC →
See also: market overview · valuation map · stock screeners