Newmont Corporation: profit up 35.1%, yet the market shrugged – the share fell 2.6%

On 22 October Newmont Corporation released its third-quarter 2026 results. Revenue came in at USD 6,363.0 mn (+15.2% YoY), net profit at USD 2,475.0 mn (+35.1%), and the net margin rose to 38.9% from 33.2% a year earlier. Net debt remains negative at USD -3,740.0 mn at end-September, and the LTM EV/EBITDA of 7.5 sits below its own three-year average of 8.6. Yet the share fell 2.6% after the release, and the portal's model puts fair value 44% below the market – on a strong report and a cheap multiple the stock looks rather attractive, though the model flags re-rating risk.
Key takeaways
— Revenue rose 15.2% YoY, and the pace was roughly the same as the 15.1% a quarter earlier
— Net profit grew 35.1%, lifting the net margin to 38.9% from 33.2%
— Free cash flow for the quarter was USD 1,912.0 mn after capex of USD 856.0 mn
— Net debt is negative at USD -3,740.0 mn, down USD 3.0 bn over the year
— The 0.9% dividend yield looks modest against strong cash generation
— LTM EV/EBITDA of 7.5 is 13% below its own three-year average of 8.6
— The portal's model puts fair value 44% below the market
Attractiveness
Key figures, USD bn
| Metric | Q3 2025 | Q3 2026 | Change |
|---|---|---|---|
| Revenue | 5.52 | 6.36 | +15.2% |
| EBITDA | 3.15 | — | — |
| Operating profit | 2.51 | — | — |
| Net profit | 1.83 | 2.48 | +35.1% |
| Operating cash flow | 2.30 | 2.77 | +20.5% |
| Capex | 0.73 | 0.86 | +17.7% |
| EBITDA margin | 57.0% | — | — |
| Net margin | 33.2% | 38.9% | +5.7 pp |
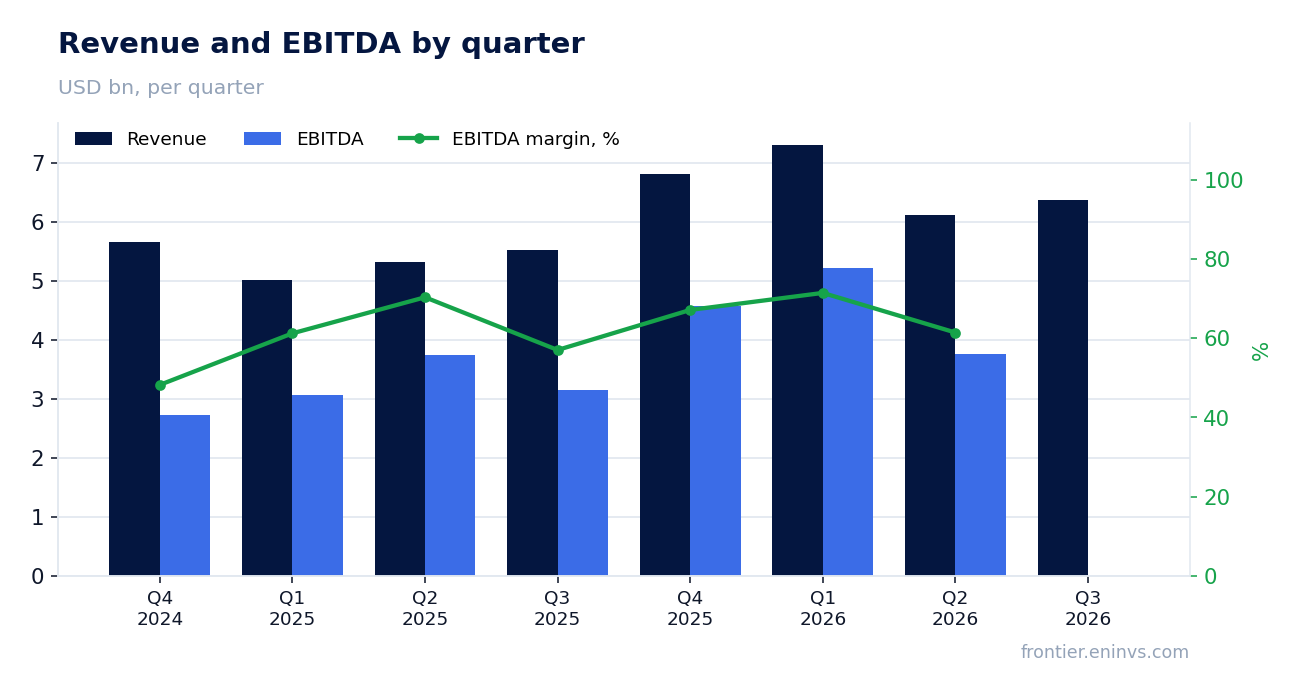
Revenue rose 15.2% YoY, and the pace was roughly the same as the 15.1% a quarter earlier
Revenue for Q3 2026 came in at USD 6,363.0 mn, up 15.2% year on year. In Q2 the growth was 15.1%, so the pace was roughly the same. The company has now posted double-digit growth for a second consecutive quarter after a 45.8% surge in Q1 2026.
For context, Q3 2025 revenue was USD 5,524.0 mn and Q4 2025 was USD 6,818.0 mn. The current level is below the late-2025 peak but above the four-quarter average. Revenue holding at this level is the main argument that the business is not losing momentum.
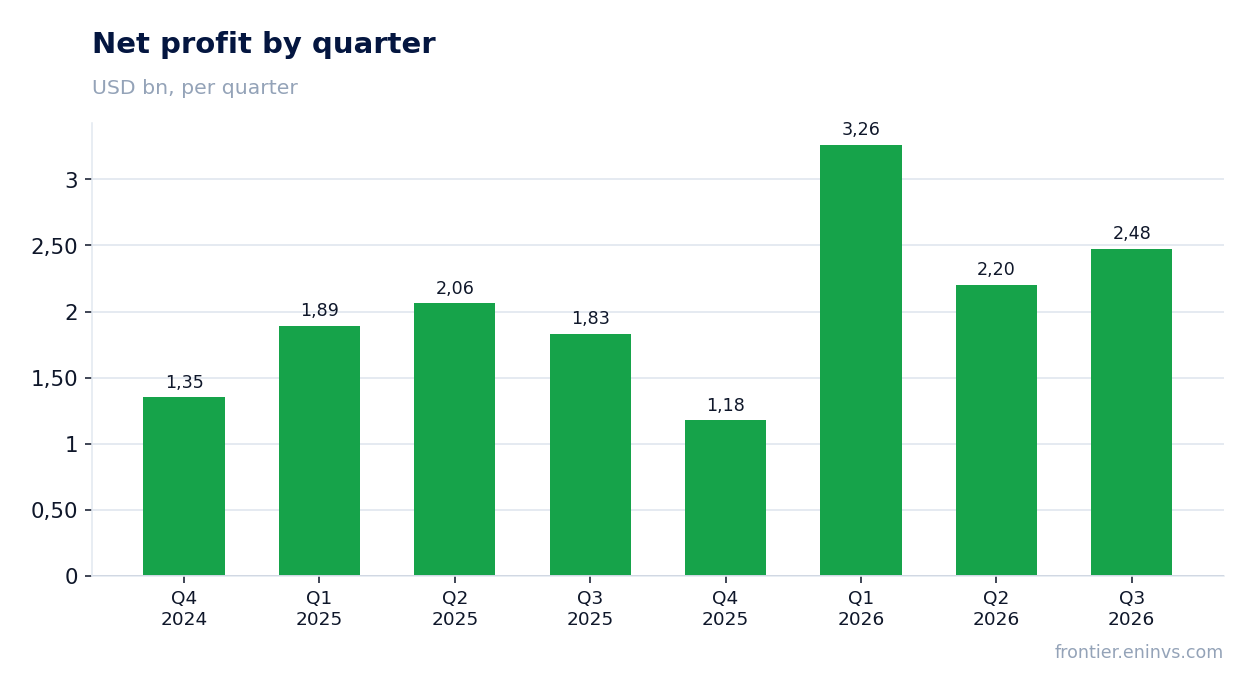
Net profit grew 35.1%, lifting the net margin to 38.9% from 33.2%
Net profit for Q3 2026 reached USD 2,475.0 mn versus USD 1,832.0 mn a year earlier – growth of 35.1%. The net margin rose to 38.9% from 33.2% in Q3 2025. Profit is growing faster than revenue, meaning the company earns more from every dollar of sales.
Over the trailing twelve months net profit was USD 9,240.0 mn on revenue of USD 26,600.0 mn. The margin for that period is about 34.7%, below the quarterly level but above last year's. The margin improvement in the reported quarter is the key differentiator of this report from previous ones.
Free cash flow for the quarter was USD 1,912.0 mn after capex of USD 856.0 mn
Operating cash flow for Q3 2026 was USD 2,768.0 mn, with capital expenditure of USD 856.0 mn. Free cash flow – the difference – was USD 1,912.0 mn. That is a solid sum covering both dividends and potential debt reduction.
Over the trailing twelve months operating cash flow was USD 13,098.0 mn. The quarterly figure of USD 2,768.0 mn is below the annualised run-rate, but that reflects seasonality and the capex schedule. What matters is that the company generates cash consistently, not through one-off inflows.
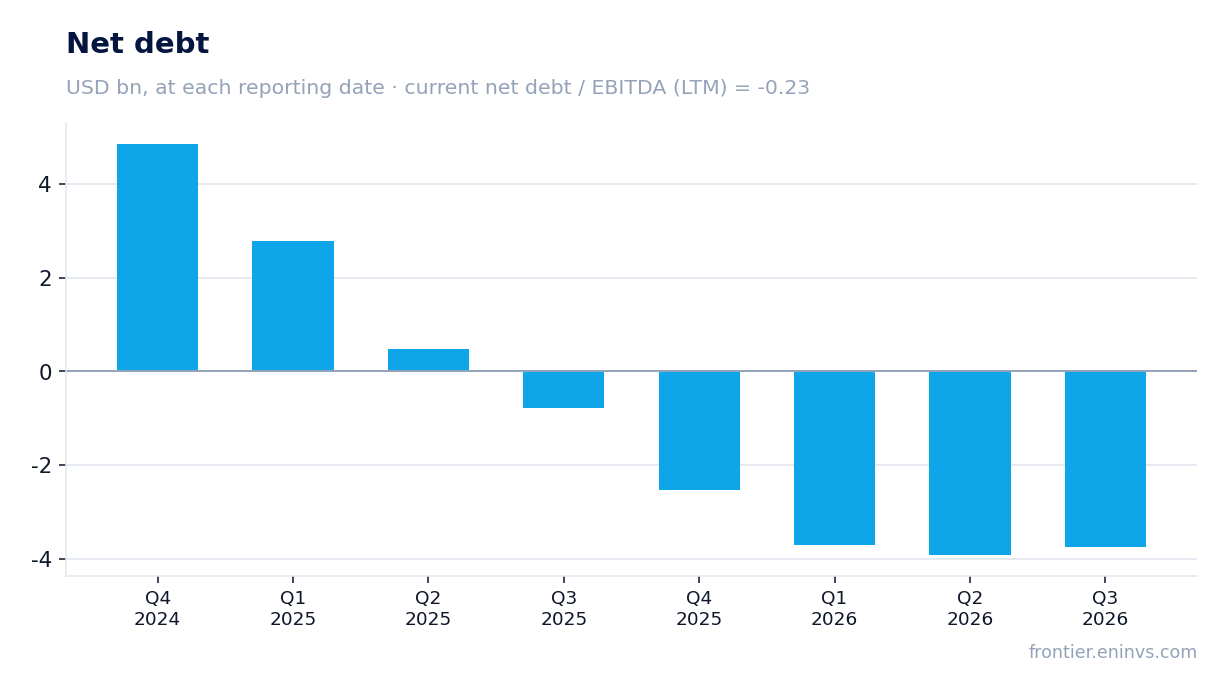
Net debt is negative at USD -3,740.0 mn, down USD 3.0 bn over the year
At end-September 2026 net debt was negative at USD -3,740.0 mn, meaning cash and equivalents exceed debt obligations. Over the quarter the figure moved from USD -3,926.0 mn on 30 June to USD -3,740.0 mn on 30 September, i.e. net debt rose by USD 0.2 bn.
Over the year net debt fell from USD -787.0 mn on 30 September 2025 to USD -3,740.0 mn on 30 September 2026 – a change of USD -3.0 bn. Negative net debt and a net debt/EBITDA LTM ratio of -0.23 point to a very strong balance sheet. That provides a cushion and lets the company fund development without external borrowing.
The 0.9% dividend yield looks modest against strong cash generation
The trailing twelve-month dividend yield is 0.9%. With a market capitalisation of USD 124,265.8 mn, that implies annual dividend payments of about USD 1,120 mn. Against quarterly free cash flow of USD 1,912.0 mn, the payout looks conservative.
Our estimate: if current profit and the payout ratio hold, the 2026 dividend may stay in the 1.0–1.2% yield range. That is below the key rate, but for a commodity company with negative net debt such a policy is typical – priority goes to financial stability and investment. A cut is possible if commodity prices fall or capex rises.
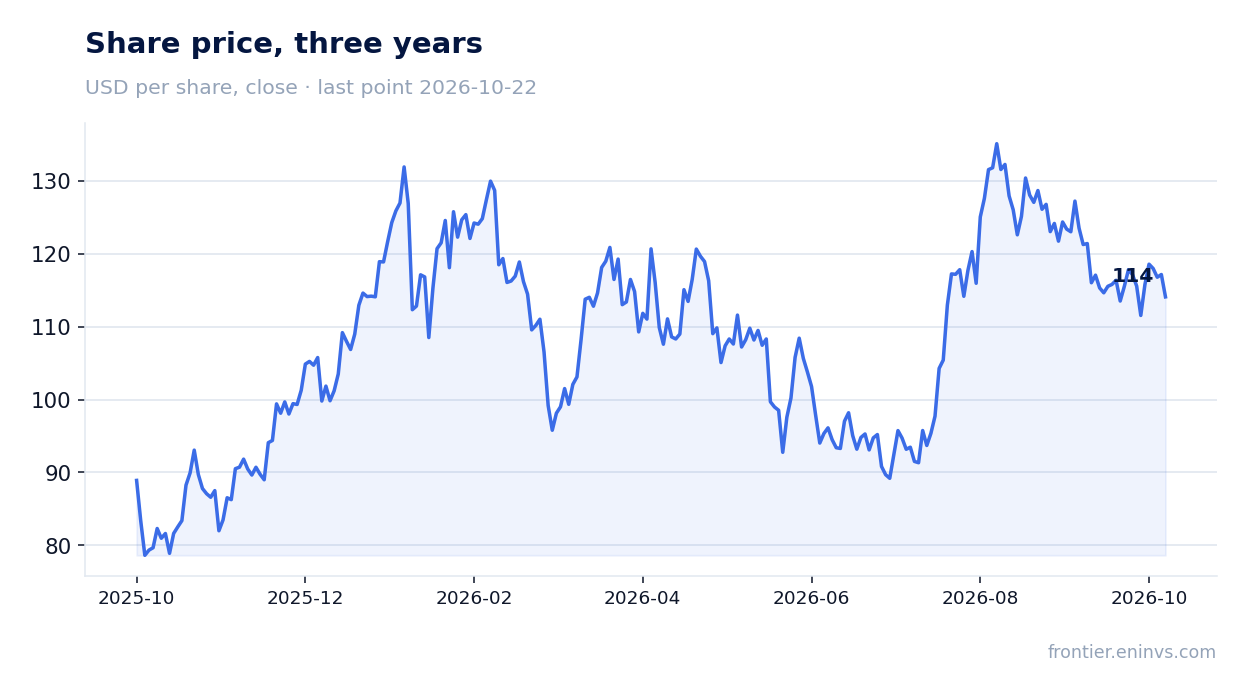
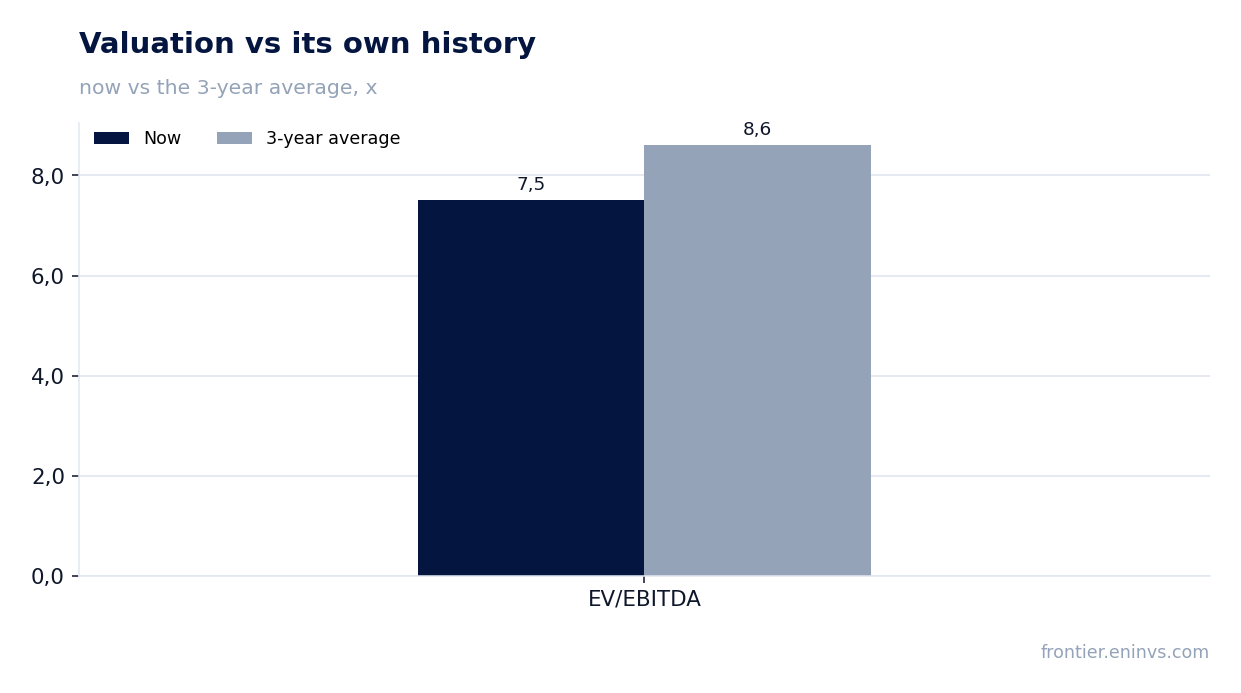
LTM EV/EBITDA of 7.5 is 13% below its own three-year average of 8.6
The LTM EV/EBITDA multiple is 7.5 against its own three-year average of 8.6. That is 13% below the historical level, meaning the stock trades cheaper than usual. The LTM P/E of 13.4 looks moderate given the 38.9% net margin.
The lower multiple may reflect a broad re-rating of the commodity sector as well as concerns over the sustainability of gold and copper prices. Yet with current financials – negative net debt and rising profit – the discount to its own history looks unwarranted. If profit holds at USD 2,475.0 mn a quarter, the multiple has room to recover.
The portal's model puts fair value 44% below the market
On the portal's model, which re-prices EBITDA at current commodity prices and a target EV/EBITDA, fair value is 44% below the market. This is the portal's own calculation, not a market consensus. It flags re-rating risk if commodity prices do not recover.
A market capitalisation of USD 124,265.8 mn at EV/EBITDA of 7.5 implies investors are pricing in higher commodity prices than current levels. If that does not materialise, the share could correct. However, the strong balance sheet and cash flow limit the downside.
Valuation on the latest reported figures
| Metric | Value |
|---|---|
| Market cap | 124 bn USD |
| P/E (LTM) | 13.4 |
| EV/EBITDA (LTM) | 7.5 |
| P/B | 3.67 |
| Net debt / EBITDA (LTM) | -0.23 |
| Operating cash flow (LTM) | 13.1 bn |
| ROE | 9.3% |
| Dividend yield (12m) | 0.9% |
| EV/EBITDA, 3-year average | 8.6 |
Bottom line
The Q3 2026 report showed strong results: revenue up 15.2%, net profit up 35.1%, and the net margin rising to 38.9%. The company generates solid free cash flow of USD 1,912.0 mn for the quarter and carries negative net debt of USD -3,740.0 mn. The EV/EBITDA multiple of 7.5 is below its own three-year average of 8.6, making the stock cheap by historical standards. However, the portal's model points to 44% downside, and the 0.9% dividend yield is modest. The verdict is rather attractive: the strong balance sheet and cash flow outweigh re-rating risk, though uncertainty over commodity prices remains for the cautious investor.
Open the company's financial profile NEM →
See also: market overview · valuation map · stock screeners